

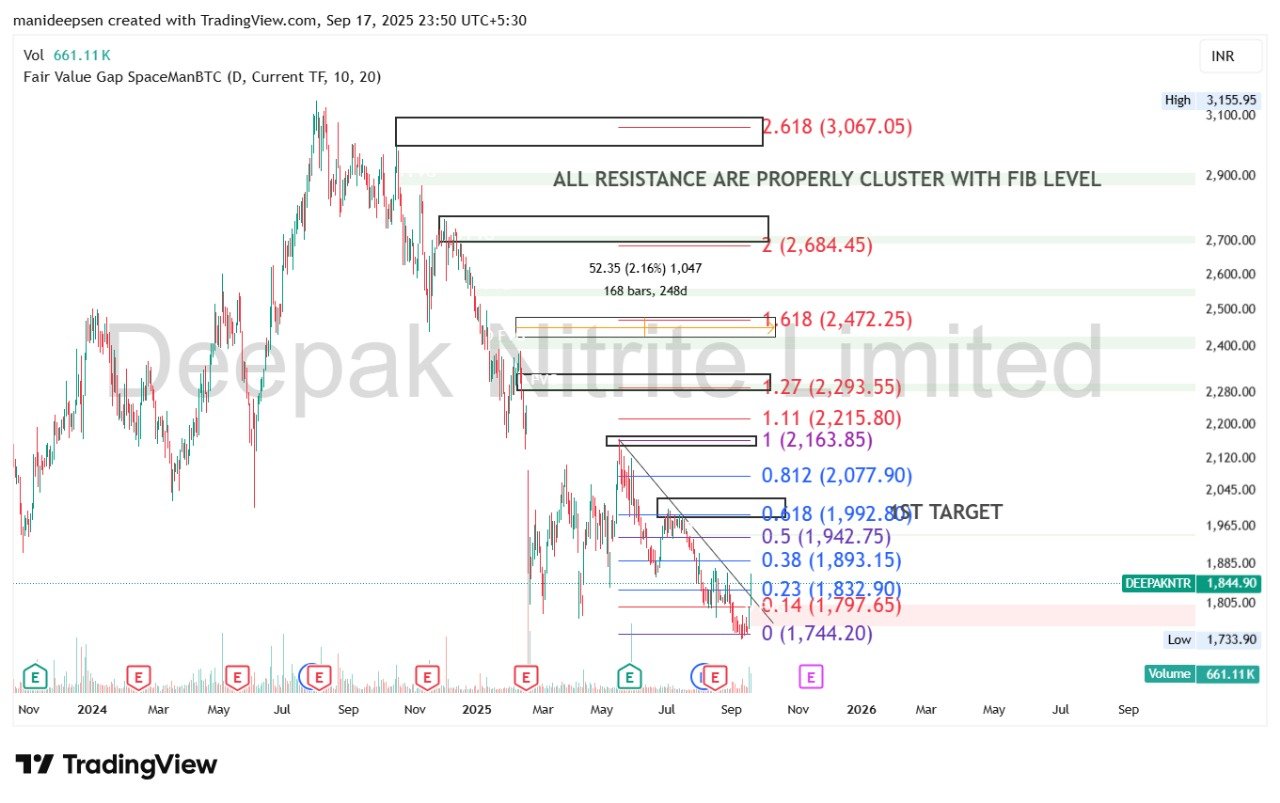
Deepak Nitrite Limited (NSE: DEEPAKNTR), one of India’s leading chemical manufacturing companies, has been under significant selling pressure since hitting its all-time high near the ₹3,100–3,150 zone. The stock has corrected sharply, testing lower supports, and is currently trading around ₹1,845.90 (as per the chart). A detailed technical analysis using Fibonacci retracement and extension levels shows that the stock is approaching a critical zone where both upside and downside targets are clearly defined.
This article explores the chart setup in detail, decoding each resistance cluster, Fibonacci retracement, and potential targets for investors and traders.
1. Understanding the Chart Setup
The chart uses the Fibonacci retracement and extension tool, a common method in technical analysis to identify possible reversal zones and price targets. It highlights how previous resistance and support levels align perfectly with Fibonacci ratios, creating “clusters” that often act as strong reversal points.
Key observations from the chart:
-
Price peaked near ₹3,155 before entering a prolonged correction.
-
Current price is around ₹1,845.90, significantly down from the highs.
-
Fibonacci levels show multiple resistances clustered at different zones between ₹2,100 and ₹3,100.
-
The downside retracement targets suggest that the stock may have already completed a major correction and is now consolidating.
2. Fibonacci Support and Downside Levels
The Fibonacci retracement is drawn from the swing low (₹1,744.20) to the swing high (₹3,155.95). The major downside retracement levels are:
-
0.0 (₹1,744.20): This is the absolute swing low and a critical support. If breached, the stock could enter a deeper bearish cycle.
-
0.14 (₹1,797.65): First minor support, already tested.
-
0.23 (₹1,832.90): Closely aligned with current price action. The market is consolidating around this level.
-
0.38 (₹1,893.15): A stronger Fibonacci retracement level, indicating potential short-term bounce if sustained.
-
0.5 (₹1,942.75): The halfway retracement, often considered a “make or break” level for trend reversals.
-
0.618 (₹1,992.85): The “golden ratio.” Holding above this could confirm reversal momentum.
-
0.812 (₹2,077.90): A deeper retracement level that could act as strong resistance on recovery rallies.
Interpretation:
The downside appears largely exhausted near ₹1,745–1,800, where multiple Fibonacci supports converge. This suggests that unless the stock breaks below ₹1,744 with volume, the probability of a rebound is strong.
3. Upside Resistance and Fibonacci Extension Targets
The chart also highlights Fibonacci extension levels, calculated beyond the retracement zones, to project possible upside targets:
-
1.0 (₹2,163.85): First strong resistance zone; aligned with psychological barrier of ₹2,150–2,200.
-
1.11 (₹2,215.80): Secondary resistance just above the 1.0 extension.
-
1.27 (₹2,293.55): A typical Fibonacci extension where many rally attempts face selling pressure.
-
1.618 (₹2,472.25): Golden extension level; if breached, the rally could gain momentum.
-
2.0 (₹2,684.45): Strong resistance and possible medium-term target.
-
2.618 (₹3,067.05): Final bullish target, very close to the stock’s all-time high.
Interpretation:
If Deepak Nitrite sustains above ₹2,000, the stock could gradually move towards ₹2,200–2,300. Beyond that, the next major target lies near ₹2,472.25. The chart shows all resistance levels properly clustering with Fibonacci, confirming these as high-probability reaction zones.
4. Volume Analysis
The chart shows a trading volume of 661.11K at current levels. Volume is crucial because:
-
Falling volume during decline suggests selling exhaustion.
-
Rising volume near support often signals accumulation.
-
A breakout above ₹2,163–2,215 with higher volume would confirm the start of a bullish reversal.
5. Fair Value Gap (FVG) and Market Psychology
The chart also uses a Fair Value Gap (FVG) indicator, highlighting inefficiencies in price action where quick moves left untested zones. These areas often act as magnets, drawing price back to fill the gap before resuming trend.
Currently:
-
Price has already filled some previous downside gaps.
-
If momentum continues, the next FVG test may occur near the ₹2,300–2,500 region.
This aligns with Fibonacci extensions, making the setup more reliable.
6. Key Scenarios Going Forward
Bullish Scenario
-
Price sustains above ₹1,832 (0.23 retracement).
-
Breaks out above ₹2,163 (1.0 extension) with strong volume.
-
Next targets: ₹2,215 → ₹2,293 → ₹2,472.
-
Medium-term rally possible towards ₹2,684–3,067 if momentum persists.
Bearish Scenario
-
Price falls below ₹1,744 (swing low).
-
Increased selling pressure drags stock lower towards ₹1,650–1,600.
-
This would invalidate the bullish retracement and indicate structural weakness.
7. Investor and Trader Perspective
For Traders
-
Short-term traders can look for entry near ₹1,832–1,893 with stop loss at ₹1,740.
-
Target zones: ₹2,077 → ₹2,163 → ₹2,293.
-
Risk–reward ratio improves if entry is near strong support.
For Investors
-
Investors with long-term horizon should accumulate gradually near current levels.
-
₹1,744 is a strong support zone; buying in tranches reduces risk.
-
Long-term potential remains strong as chemical sector growth continues.
8. Macro and Sector Considerations
Apart from technicals, it is important to remember that Deepak Nitrite is part of India’s specialty chemicals sector, which:
-
Benefits from the “China + 1” strategy as global supply chains diversify.
-
Faces raw material cost fluctuations and regulatory risks.
-
Has strong domestic demand in pharmaceuticals, agrochemicals, and industrial uses.
A recovery in global chemical demand and stable input costs could provide fundamental tailwinds, complementing the bullish technical setup.
9. Risk Factors
-
Breakdown below ₹1,744: Would negate the bullish reversal thesis.
-
Global crude oil and chemical cycle: A downturn could impact margins.
-
High resistance clusters: Profit booking is likely at each Fibonacci level, meaning rallies could face intermittent corrections.
10. Conclusion
The technical chart of Deepak Nitrite highlights a textbook case of Fibonacci cluster alignment, where retracement and extension levels map almost perfectly to real resistance and support zones. With the stock currently consolidating around ₹1,845, the near-term outlook depends on whether it can hold above the critical support zone of ₹1,744–1,800.
-
If sustained, upside targets gradually open towards ₹2,163 → ₹2,293 → ₹2,472.
-
If broken, downside risk extends below ₹1,700.
For long-term investors, this correction may represent a strategic accumulation opportunity, while traders can watch for a breakout confirmation with volume for short-term gains.
In summary, Deepak Nitrite’s chart suggests a high-probability bullish reversal is in the making, but confirmation is required via price action above the ₹2,163–2,215 resistance zone. The alignment of Fibonacci levels, fair value gaps, and historical price structures makes this setup particularly significant for market participants.
Also Read – Brian Armstrong’s corporate crypto vision


