

The Indian stock market has recently witnessed heightened volatility, with investors carefully tracking mid-cap and PSU stocks for directional cues. In particular, Garden Reach Shipbuilders & Engineers Ltd. (GRSE) and IFCI Ltd. are showing strong signs of potential breakouts. Both charts highlight key technical setups supported by Fibonacci retracements, MACD crossovers, and volume surges—indicators that often precede strong price movements.
This article provides an in-depth breakdown of these stocks’ technical outlook, explains the breakout indicators in detail, and assesses what traders and investors should monitor going forward.
Understanding Breakouts
A breakout occurs when the price of a stock moves above a resistance level or below a support level with strong volume confirmation. Breakouts often signal the beginning of a new trend and can lead to sharp price rallies (in bullish scenarios) or steep declines (in bearish setups). Key tools used in identifying potential breakouts include:
-
Fibonacci retracements: Identify potential reversal levels and price targets.
-
MACD (Moving Average Convergence Divergence): Measures momentum and trend shifts.
-
Volume analysis: Confirms whether the breakout is backed by market participation.
-
Trendlines: Highlight resistance and support break levels.
1. Garden Reach Shipbuilders & Engineers Ltd. (GRSE)
Current Price Action
-
CMP: ₹2,603.60
-
The stock has been consolidating for several weeks but recently broke out of its downtrend resistance line, a strong bullish signal.
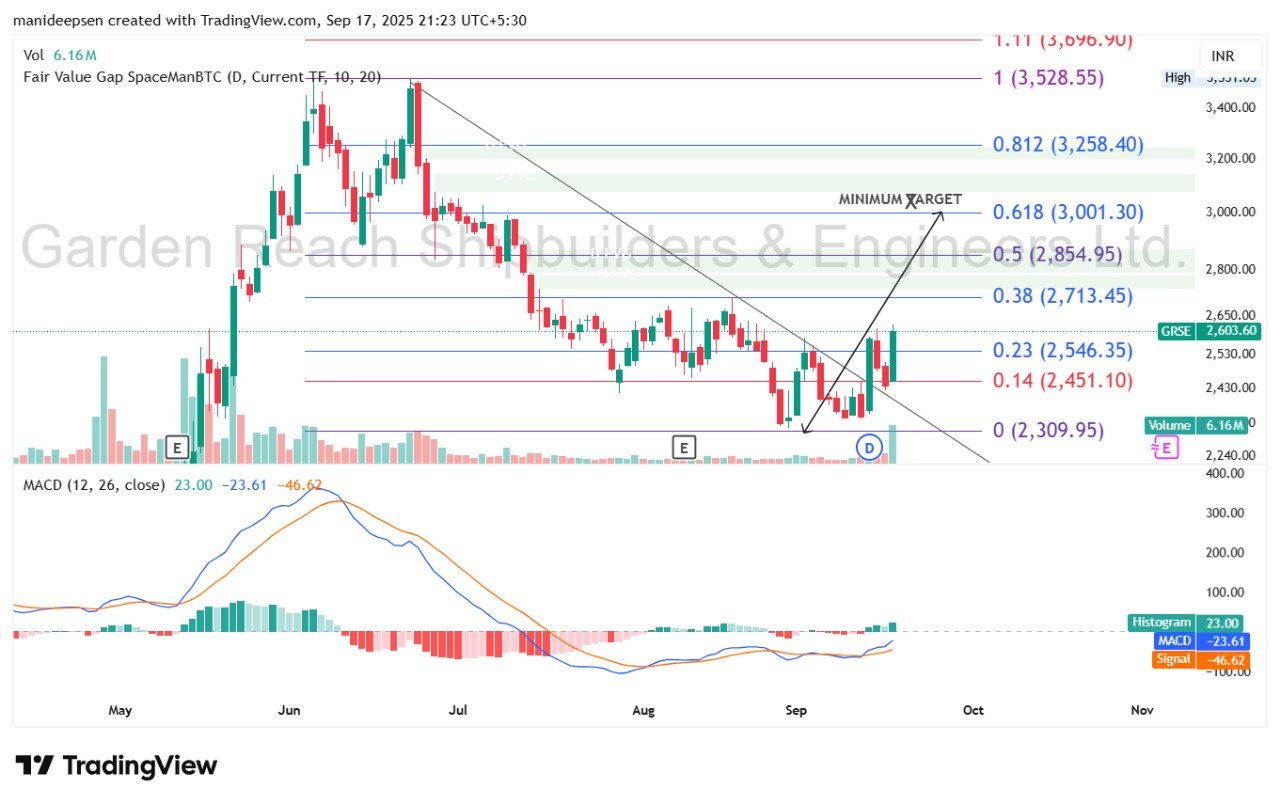
Fibonacci Retracement Levels
-
23.6% level: ₹2,546 – already reclaimed.
-
38.2% level: ₹2,713 – immediate short-term resistance.
-
50% retracement: ₹2,854 – strong resistance zone.
-
61.8% retracement (golden ratio): ₹3,001 – identified as the minimum breakout target.
These levels suggest that if the momentum sustains, GRSE could rally toward ₹2,850–₹3,000 in the coming weeks.
MACD Indicator
-
MACD has turned positive with a bullish crossover above the signal line.
-
Histogram bars are turning green, signaling rising bullish momentum.
Volume Profile
-
The recent breakout candle was backed by 6.16M shares in volume, much higher than its average, confirming participation from institutional investors.
Technical Outlook
-
Short-term target: ₹2,713
-
Medium-term target: ₹2,850–₹3,000
-
Support levels: ₹2,546 (23.6% retracement) and ₹2,451 (14% retracement).
-
A sustained move above ₹2,713 would pave the way for a bigger rally toward the 61.8% retracement.
Interpretation
The breakout above the falling trendline and confirmation through MACD crossover suggest that GRSE is entering a bullish phase. Traders may consider accumulating on dips with stop-loss around ₹2,450.
2. IFCI Ltd.
Current Price Action
-
CMP: ₹59.01
-
The stock has completed a corrective phase (ABC correction on the Elliott Wave count) and is now showing signs of reversal from its recent base at ₹51–₹52.
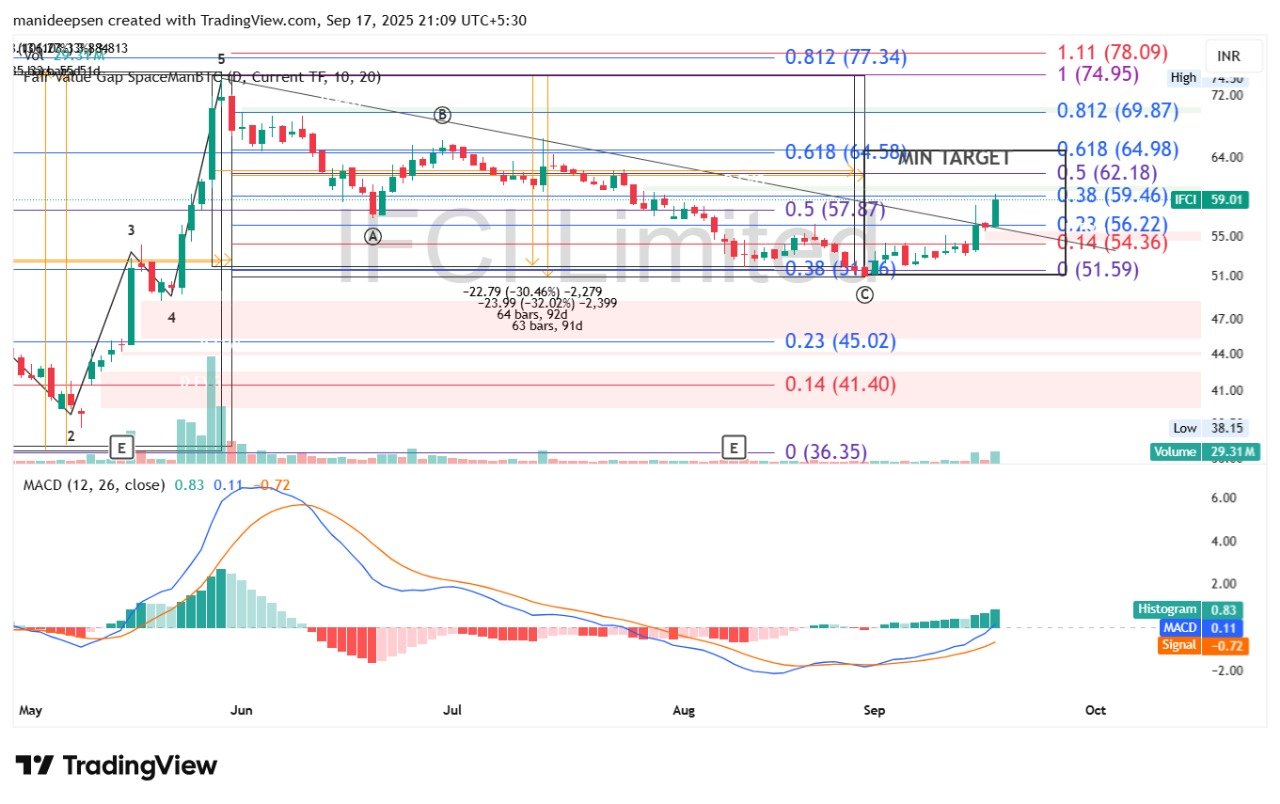
Fibonacci Retracement Levels
-
38.2% retracement: ₹56.22 – successfully crossed.
-
50% retracement: ₹57.87 – currently trading above this zone.
-
61.8% retracement (key breakout level): ₹64.98 – defined as the minimum breakout target.
-
78.6% retracement: ₹69.87 – potential medium-term target.
The breakout above ₹57–₹58 zone is significant as it was a strong resistance for months.
MACD Indicator
-
MACD line has turned positive (0.11) and crossed above the signal line (-0.72).
-
Histogram is green and rising, suggesting strengthening bullish momentum.
Volume Profile
-
29.31M shares traded during the breakout, far higher than the average, which validates the breakout strength.
Technical Outlook
-
Immediate target: ₹64.98 (61.8% retracement).
-
Medium-term target: ₹70–₹75 if momentum continues.
-
Support levels: ₹56 (38.2% retracement) and ₹54 (14% retracement).
Interpretation
The strong breakout with volume and a bullish MACD crossover point toward a fresh uptrend in IFCI. Momentum traders could see upside toward ₹65–₹70 in the short term.
Broader Market Implications
Both GRSE and IFCI represent different sectors (defense PSU and financial services) but share a common breakout structure:
-
Downtrend resistance broken.
-
Volume spike validating moves.
-
MACD crossover confirming bullish momentum.
-
Fibonacci targets aligning with market structure.
Such setups are often early indicators of broader mid-cap sector strength. If PSU and financial sector stocks see continued participation, this could reflect bullish market sentiment spilling over into October.
Key Risks to Watch
While the charts look bullish, traders should remain cautious of the following risks:
-
False breakouts: If volume dries up or follow-through is weak, prices may retest lower supports.
-
Macro risks: Interest rate changes, fiscal policy announcements, or global cues (US Fed, crude oil prices) can impact momentum.
-
Sector rotation: Markets may shift focus away from PSUs to private sector equities, reducing momentum.
Trading & Investment Strategy
-
GRSE Strategy:
-
Buy on dips above ₹2,550.
-
Targets: ₹2,713 / ₹2,850 / ₹3,000.
-
Stop-loss: ₹2,450.
-
-
IFCI Strategy:
-
Buy above ₹58–₹59 with momentum.
-
Targets: ₹65 / ₹70 / ₹75.
-
Stop-loss: ₹54.
-
Position Sizing: Given the volatility, it’s wise to limit exposure to 3–5% of portfolio per stock and trail stop-losses as targets are achieved.
Lessons for Traders
-
Confluence is key: Breakouts are more reliable when multiple indicators align (trendline break, Fibonacci level, MACD crossover, volume).
-
Volume confirms conviction: A breakout without volume often fails. Both GRSE and IFCI show above-average participation, strengthening the case.
-
Patience with targets: Breakouts usually test immediate Fibonacci levels first before scaling higher zones. Avoid chasing; instead, accumulate in phases.
-
Stop-loss discipline: Essential for protecting capital in case of reversal.
Conclusion
The current technical setups in Garden Reach Shipbuilders & Engineers Ltd. and IFCI Ltd. highlight classic breakout patterns with bullish indicators in play. If follow-through momentum continues, GRSE could scale toward ₹3,000 while IFCI has room to test ₹65–₹70 in the short to medium term.
For traders, this represents a strong opportunity to ride potential uptrends, provided risk management strategies are followed. For long-term investors, these moves indicate sector strength and could be an early sign of broader market re-rating in select PSUs and financials.
In the dynamic world of trading, breakouts are windows of opportunity—but only for those who combine technical analysis with disciplined execution.
Also Read – Elizabeth Stark and Lightning Network push


