
The Nifty 50 index often creates clear stories on lower-timeframe charts, and this session shows a textbook example of a controlled intraday decline inside a descending channel. The price respects both the trendline and the Fibonacci grid. The momentum readings reflect weakening strength from buyers. Sellers hold short-term dominance, but the market still develops conditions that require close attention, especially near the lower boundary of the channel.
This analysis examines the entire structure—trend, momentum, candlestick behavior, support-resistance clusters, and potential breakout scenarios. I break down every component so traders gain clarity about the full narrative that unfolds on this chart.
1. Understanding the Broader Intraday Structure
The index opens the session near the 26,180 region. Sellers step in early and show firm control. The candles slip lower and never challenge the early swing high again. This behavior creates a strong directional bias from the beginning of the session. Every attempt from buyers fails to generate a higher high, and every pullback creates a new lower high.
This environment signals a prevailing downward trend.
Traders love such clean structures because the market offers clarity. The candles align neatly inside a descending channel. The channel forms as the upper boundary connects the sequence of lower highs and the lower boundary ties together a clean sequence of lower lows. This channel does not show erratic movement; the price travels with consistency and discipline.
The overall tone favors sellers, but the story holds more depth than a simple downtrend.
2. The Descending Channel – The Spine of the Trend
A descending channel guides the entire price movement. The price enters this channel shortly after the opening weakness and moves inside this downward slope throughout the session.
A descending channel often signals ongoing selling pressure. When the market trades inside such a structure:
-
Sellers maintain dominance.
-
Buyers attempt counter-moves but fail to shift momentum.
-
Each rally loses strength quickly.
-
Each dip gains strength easily.
-
Every touch of the channel boundaries creates important trading signals.
The upper boundary of this channel rejects multiple bullish attempts. Bulls consistently attempt minor pullbacks, but they fail to climb above this trendline. Bears absorb every bounce and push the price lower with conviction.
The lower boundary of the channel acts as demand. Buyers step in near the channel floor and absorb selling pressure. They do not reverse the trend, but they defend these levels enough to create a short-term bounce.
This bounce near the channel support carries significance because the market often prepares for a larger move after such interaction.
Traders must pay close attention to both boundaries because the price often accelerates sharply when it breaks out of a channel.
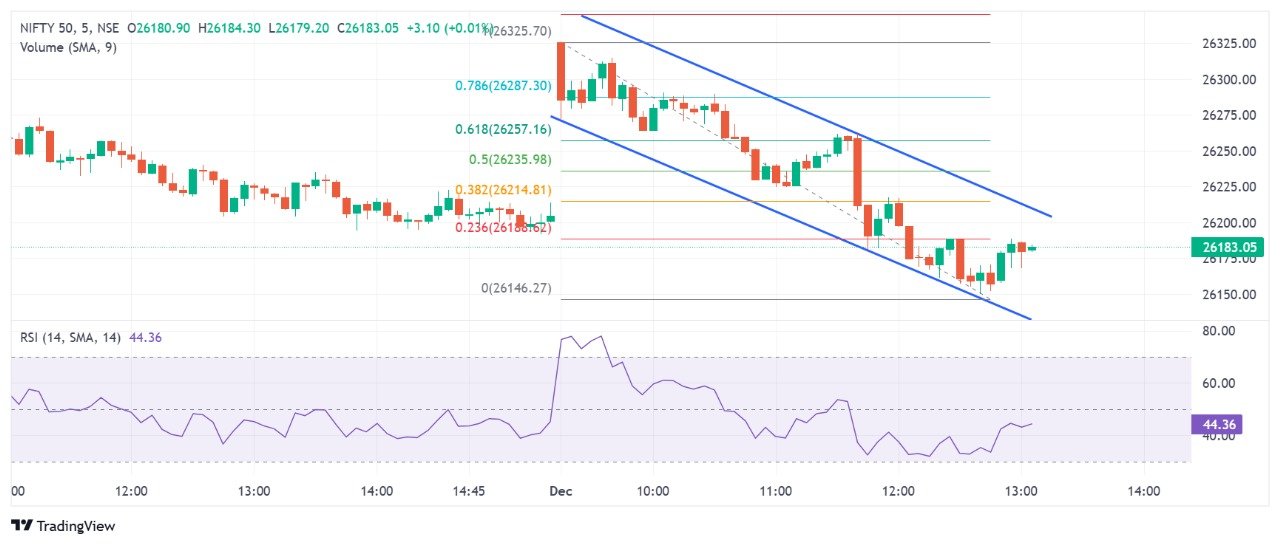
3. Fibonacci Retracements – Understanding the Price Reaction Zones
The chart uses Fibonacci retracement levels drawn from the swing low near 26,146 to the swing high near 26,325. These levels reveal how the market reacts to retracement zones during a declining trend.
3.1 The 23.6% Level
The 23.6% retracement at 26,168 initially holds as support. Buyers defend this area during the early pullback phase. When the price loses this level later, sellers regain strength and push the index deeper inside the channel.
3.2 The 38.2% Level
The 38.2% retracement at 26,214 acts as a strong resistance in the mid-session pullback. Buyers attempt to lift the market toward this zone multiple times. Sellers respond quickly each time and push candles down before they form a meaningful reversal.
This reaction confirms the downtrend’s grip.
3.3 The 50% and 61.8% Levels
The price does not reach the 50% retracement at 26,253 or the 61.8% level at 26,257 after the early fall. Strong reversals normally challenge these levels, but this chart shows no such strength. Buyers struggle to regain even half the distance of the fall. Sellers keep the market below the mid-retracement zone.
3.4 Fibonacci Confluence With the Channel
The Fibonacci grid aligns beautifully with the channel resistance zones. When both structures agree, the probability of rejection increases sharply. The price touches those Fibonacci levels and reacts according to the channel slope, reinforcing the bearish structure.
This combination strengthens the reliability of the trend.
4. Candlestick Behavior – Revealing Trader Psychology
Candlestick action exposes how participants behave during the session:
4.1 Red Candles Control the Structure
Bearish candles appear frequently and carry stronger body size. These candles show clear directional pressure from sellers. Every strong red candle drives the index deeper and stops buyers from taking control.
4.2 Small Green Candles Reflect Weak Buying Interest
The bullish candles that appear inside the channel carry smaller bodies. They fail to travel upward with momentum. Many bullish candles close near their midpoints or below. This structure signals weak confidence from buyers.
Those candles show that bulls attempt to defend support, but they do not chase rallies.
4.3 No Major Reversal Pattern Emerges
The chart does not show:
-
Bullish engulfing patterns
-
Large hammer wicks
-
Morning star patterns
-
Double bottoms
-
Inverse head-and-shoulders structure
Without such signals, traders avoid aggressive bullish bets.
The bearish climate continues until the market nears the lower channel boundary, where it prints a small bounce.
5. RSI Momentum Analysis – Tracking Internal Strength
The RSI hovers around 44 at the end of the chart. The momentum indicator tells a story that aligns with price action:
5.1 RSI Remains in Bearish Territory
The RSI swings mostly between 35 and 50. This range denotes bearish strength because strong bullish markets often push RSI above 60. Here, the indicator trades below the midpoint of the scale, which signals that sellers maintain advantage.
5.2 RSI Shows a Mild Divergence at the Channel Floor
When the price creates a new low near the channel boundary, RSI does not fall further. Instead, it forms a slightly higher low. This divergence signals weakening selling pressure. Buyers feel this shift and attempt a mild bounce.
This bounce remains limited, but it warns traders to monitor the next few candles carefully.
5.3 RSI Fails to Push Above 50
Even during the bounce, RSI struggles to break above 50. When an instrument fails to lift momentum beyond the halfway point of the RSI scale, the bounce often remains corrective.
This behavior matches the ongoing downtrend.
6. Volume Behavior – Understanding Participation
Volume bars show irregular but informative patterns:
6.1 Selling Pressure Gains High Volume
The stronger bearish candles carry higher volume. Institutional participants join these moves. This alignment strengthens the trend.
6.2 Bounce Carries Thin Volume
The bounce from the lower channel boundary shows lower volume. Buyers step in weakly. This lack of volume confirms the bounce does not carry real strength.
This volume structure strengthens the idea that sellers still influence the market more convincingly.
7. Key Levels That Control the Market
Support Levels
-
26,150 — channel support and reaction zone
-
26,146 — Fibonacci anchor low
-
26,120 — next intraday demand area
Resistance Levels
-
26,214 — strong Fibonacci resistance
-
26,230–26,240 — upper channel trendline
-
26,253 — 50% retracement
-
26,257 — 61.8% retracement
These levels create a roadmap for the next move.
8. Intraday Bias – Sellers Hold Control but a Breakout Scenario Emerges
The dominant narrative favors sellers. The channel slope, the failed bullish pullbacks, the rejected Fibonacci levels, and the RSI structure combine to confirm a short-term downtrend.
However, the price now trades near the lower channel boundary. When the market hits the extreme end of a channel, it often prepares for one of two outcomes:
-
Continuation downward
-
A breakout reversal after a trendline break
The current bounce looks small but meaningful because:
-
RSI shows mild divergence
-
Sellers show declining strength at the bottom
-
Candles print slightly higher lows
-
Volume dips as selling cools
These factors require traders to watch the trendline closely.
9. The Breakout Scenario – What Traders Must Notice
The upper channel boundary now acts as the key trigger.
If the price breaks the descending trendline, the market could deliver a breakout.
This breakout gains significance because the trendline has controlled the entire intraday movement. A break above this boundary signals that buyers finally step up with conviction and absorb seller pressure.
Such a breakout often triggers:
-
short-covering
-
momentum-based buying
-
a drive toward retracement levels
-
a push toward the 26,214 resistance
-
a potential rise toward the 26,253 and 26,257 Fibonacci regions
The breakout scenario strengthens if volume rises during the trendline breach and if RSI pushes above 55.
Traders must monitor these confirmations because a breakout from a well-defined descending channel often creates strong intraday opportunities.
10. Bearish Continuation Scenario – What Happens if Price Fails?
If the price fails to break the channel resistance:
-
Sellers regain command.
-
The bounce turns into a corrective move.
-
The index returns toward the lower channel boundary.
-
Another attempt to break 26,150 emerges.
-
A drop below 26,150 opens a path toward 26,120 and below.
This scenario aligns with the prevailing downtrend and fits the earlier structure.
Traders must track rejection signals near the trendline:
-
long upper wicks
-
bearish engulfing
-
weak green candles
-
volume spikes on red candles
Such signals often confirm continuation.
11. Trader-Specific Strategy Insights
11.1 Strategy for Short Sellers
Short sellers gain high-probability setups near the channel upper boundary and Fibonacci zones. They look for:
-
rejection at 26,214
-
rejection at the trendline
-
bearish candles near resistance
-
RSI failure to cross 50
Targets include:
-
26,168
-
26,150
-
26,120
This structure offers clean risk-reward.
11.2 Strategy for Buyers
Buyers need stronger confirmation because the broader structure favors sellers. They look for:
-
trendline breakout
-
price close above 26,214
-
RSI above 55
-
rising volume during the move
If these signals align, the market opens space for an upward reversal.
Otherwise, buyers should avoid premature entries.
12. Final Market Interpretation
The Nifty 50 chart shows a clean and disciplined downward movement inside a well-defined descending channel. Sellers guide the entire session, and buyers struggle to lift momentum. Fibonacci levels reject pullbacks, and RSI supports the bearish bias.
However, the market now approaches a key turning point. The lower channel boundary shows signs of exhaustion from sellers. Buyers defend this region and trigger a small bounce. This bounce does not generate full strength, but it creates the setup for a potential breakout.
The next major move depends entirely on how the price behaves at the upper trendline.
If the market breaks the trendline, a breakout could follow and shift momentum upward.
If the market fails to break it, the downtrend continues toward lower supports.
Traders must track this boundary closely because the next wave of momentum could emerge directly from this zone.
Also Read – Avalanche Rush: DeFi Incentive Program Driving Growth