Analysis and Research By – Manideep Sen
Krishna Institute of Medical Sciences Limited (KIMS) trades near a decisive technical and fundamental inflection point. The stock corrected sharply from its recent highs and now trades near ₹629.85. Despite price weakness, delivery volumes remain consistently elevated above 60% in most recent weeks. This behavior signals strong participation from long-term investors rather than speculative churn.
Financial metrics reveal a business with high return ratios but moderating profitability. Valuation multiples trade above industry averages, which explains the recent price compression. Technical structure, based on Elliott Wave analysis and volume-weighted price levels, suggests the stock operates inside a corrective Wave 4 phase. Momentum indicators such as RSI approach oversold territory, which historically aligns with accumulation phases rather than distribution.
Peer comparison places KIMS in a mid-cap valuation band with superior capital efficiency but lower absolute scale than national hospital chains. This report integrates delivery data, financial ratios, quarterly trends, peer metrics, and chart structure to present a unified assessment of risk, opportunity, and market behavior.
Company Overview
Krishna Institute of Medical Sciences Limited operates as a leading multi-specialty hospital chain in India. The company focuses on tertiary and quaternary healthcare services across Telangana, Andhra Pradesh, and Maharashtra. KIMS delivers advanced treatment across cardiology, oncology, neurology, orthopaedics, gastroenterology, and critical care.
KIMS follows an asset-heavy hospital expansion model with strong regional dominance. The company prioritizes bed capacity utilization, operational efficiency, and medical specialization rather than aggressive pan-India branding.
Recent Price Action
Krishna Institute of Medical Sciences (KIMS) currently trades at a Last Traded Price (LTP) of ₹629.85, positioning the stock firmly inside a critical corrective zone. Over the past several weeks, the stock has recorded weekly declines ranging from −1.5% to −5.9%, reflecting sustained but orderly selling pressure. This phase followed a failed attempt to hold above the ₹730–750 peak resistance zone, which had earlier acted as a supply-heavy area during the prior rally.
The inability to sustain prices above ₹730 marked a clear shift in short-term market structure. Sellers emerged aggressively near this zone, indicating profit booking by traders who participated in the preceding uptrend. However, the nature of the decline offers important insight into market intent. The price did not collapse sharply, nor did it register wide-range bearish candles typically associated with panic selling. Instead, the stock declined in a measured, stepwise fashion, signaling controlled distribution rather than forced liquidation.
The current correction range of ₹620–630 has now emerged as a key short-term equilibrium zone. Price action in this band reflects hesitation and compression rather than continuation of the downward move. Multiple sessions show overlapping candles, smaller real bodies, and reduced volatility, which together suggest that selling pressure has started to lose momentum. This behavior often appears when short-term sellers exhaust their positions while longer-term participants absorb supply.
A crucial factor that alters the interpretation of this decline lies in delivery data behavior. Throughout the price correction, delivery percentages remained consistently elevated, frequently exceeding 60%. Such a pattern contradicts the idea of speculative exit or weak hands capitulating. Instead, it indicates that market participants who take delivery—typically institutional investors, family offices, and high-conviction long-term holders—continue to accumulate shares despite falling prices. This delivery-led absorption effectively cushions downside risk and prevents sharp breakdowns.
The market structure also reflects a transition from trend acceleration to consolidation. The rally into the ₹730–750 zone represented an exhaustion phase of the previous impulse move. Once price failed to attract fresh momentum buyers above that region, the stock naturally entered a corrective phase to rebalance valuations and sentiment. Importantly, the correction has respected higher-order support levels and has not violated the broader uptrend structure visible on higher time frames.
From a behavioral perspective, the decline flushed out short-term leveraged positions while attracting value-focused participants who view the ₹620–630 zone as an accumulation area rather than a breakdown point. This shift in ownership from weak to strong hands often precedes stabilization and base formation.
Weekly Delivery vs Traded Quantity Analysis
Key Observation
High delivery percentages during falling prices indicate accumulation by informed participants.
Weekly Delivery Data (2025)
| Week | Price (₹) | Weekly Change | Delivery % |
| 21–24 Dec | 629.85 | −1.5% | 62.5% |
| 14–20 Dec | 639.30 | −3.5% | 62.5% |
| 07–13 Dec | 662.55 | −5.9% | 64.0% |
| 30 Nov–06 Dec | 704.00 | +2.8% | 55.1% |
| 23–29 Nov | 685.10 | +2.2% | 65.6% |
| 16–22 Nov | 670.10 | +0.8% | 53.5% |
| 09–15 Nov | 665.00 | −8.7% | 54.8% |
Interpretation
- Delivery percentages remain above 60% in most declining weeks.
- Institutions absorb supply instead of exiting.
- Traders exit positions, while investors accumulate shares.
This pattern historically appears during intermediate corrections inside larger uptrends.
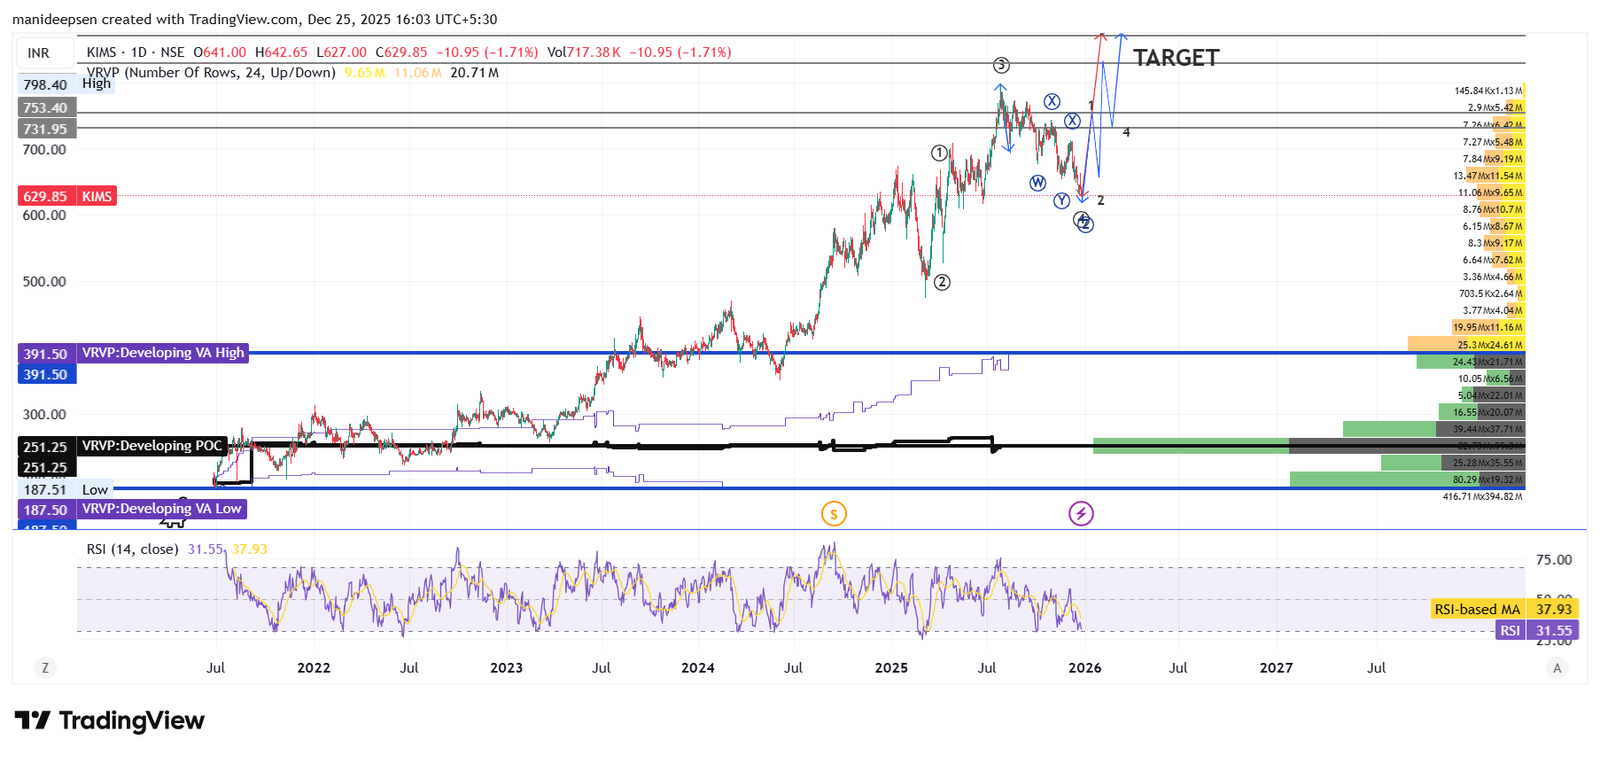
Elliott Wave Structure Assessment
The current price structure of Krishna Institute of Medical Sciences (KIMS) fits well within a classical Elliott Wave impulsive framework, followed by an active corrective phase. The wave count offers a structured explanation for recent price behavior, momentum shifts, and volume dynamics observed over the past several quarters.
The impulsive cycle began with Wave 1, which emerged from a prolonged consolidation range. This phase marked a clear transition from accumulation to trend initiation. Price expansion occurred alongside improving market participation, and momentum indicators confirmed the shift. The lowest point on the MACD histogram has been treated as the reference base for Wave 1, providing a clear and objective anchor for the wave count. Rising volumes during this phase indicated broad-based participation rather than short-term speculative activity, establishing a strong foundation for the subsequent trend.
Wave 2 unfolded as a relatively shallow corrective pullback. Price retraced only a modest portion of the Wave 1 advance, reflecting underlying demand strength. The correction developed with declining volume and limited downside follow-through, as buyers entered early and absorbed supply. Such behavior is typical in strong trends where market participants expect higher prices and remain unwilling to wait for deeper retracement levels.
The trend accelerated sharply during Wave 3, which developed into the most extended and dynamic phase of the cycle. KIMS registered a powerful impulsive rally toward the ₹730–750 zone, supported by expanding volume and sustained delivery participation. Price action displayed classic impulsive characteristics, including strong directional candles, minimal overlap, and consistent higher highs. Institutional momentum buying dominated this phase, and the same price zone later evolved into a major resistance and profit-taking area.
Following the completion of Wave 3, the stock entered Wave 4, which defines the current market structure. Price retreated into the ₹620–630 region, initially aligning with a 23.6%–38.2% retracement of Wave 3. However, Wave 4 corrections often evolve into complex corrective structures, and in such cases, the retracement can extend further toward the 50%–61.8% Fibonacci range without invalidating the broader trend. The ongoing correction reflects this complexity through overlapping price action, narrow trading ranges, and choppy movement, all of which confirm a corrective phase rather than the start of a new bearish trend.
Momentum indicators support this interpretation. During Wave 4, momentum weakened gradually, and oscillators such as RSI trended lower without producing extreme bearish divergence. This behavior signals momentum normalization rather than structural breakdown. Simultaneously, delivery participation increased during declines, highlighting accumulation by informed market participants who anticipate trend continuation.
Volume behavior further reinforces the Wave 4 thesis. Selling pressure lacks urgency and fails to generate climactic volume spikes commonly associated with distribution or trend failure. Instead, volumes remain stable while delivery ratios stay elevated, suggesting consistent absorption of supply on price weakness. This pattern often appears during the later stages of corrective waves, when ownership shifts from short-term participants to stronger hands.
In Elliott Wave terms, Wave 4 corrections tend to challenge patience rather than price structure, and KIMS currently reflects this characteristic. The market consolidates prior gains, adjusts valuation expectations, and allows momentum indicators to reset. As long as price continues to respect the broader corrective boundaries and delivery participation remains strong, the structure favors completion of Wave 4 rather than trend reversal.
Overall, the wave count remains internally consistent and technically valid. KIMS continues to exhibit the defining features of a mature, potentially extended Wave 4 correction, positioning the stock for the next impulsive phase once consolidation completes.
RSI and Momentum Behavior
- RSI (14-period): ~31–37 range
- RSI-based MA: ~37.9
RSI approaches the 30 threshold, which historically aligns with exhaustion of selling pressure in strong stocks. RSI does not guarantee reversal, but it signals weakening downside momentum.
Momentum divergence appears mild but constructive. Price makes lower lows, while RSI stabilizes.
Financial Ratio Analysis (Consolidated)
Profitability Ratios
| Metric | 2021-03 | 2022-03 | 2023-03 | 2024-03 | 2025-03 |
| ROE (%) | 28.12 | 30.55 | 23.93 | 19.21 | 20.92 |
| ROCE (%) | 30.82 | 35.69 | 27.84 | 20.25 | 19.04 |
| ROA (%) | 15.64 | 20.60 | 15.23 | 10.00 | 8.74 |
Interpretation
- Return ratios peaked during FY22.
- Margins compressed due to expansion costs and normalization.
- ROE and ROCE remain strong relative to most capital-intensive hospital peers.
- Declining ROA reflects asset base expansion.
Valuation Snapshot
| Metric | Value |
| EPS | ₹8.40 |
| P/E Ratio | 75.00 |
| Industry P/E | 65.62 |
| Book Value / Share | ₹56.74 |
| Price to Book | 11.10 |
| Dividend Yield | 0.00% |
| Shares Outstanding | 40.01 Cr |
| Face Value | ₹2 |
Valuation Insight
- KIMS trades at a premium to industry P/E.
- Market prices future growth and operating leverage.
- Any earnings disappointment triggers valuation compression, which explains recent price action.
Quarterly Financial Performance Trend
Last Five Quarters (₹ Crore)
| Quarter | Net Sales | EBITDA | PAT |
| 2024-09 | 777.30 | 218.10 | 120.70 |
| 2024-12 | 772.40 | 187.20 | 92.50 |
| 2025-03 | 796.90 | 198.00 | 106.10 |
| 2025-06 | 871.60 | 192.60 | 85.00 |
| 2025-09 | 960.70 | 204.00 | 72.00 |
Trend Analysis
- Revenue shows steady sequential growth.
- EBITDA remains range-bound.
- PAT declines despite rising revenue due to margin pressure and higher costs.
- Market reacts negatively to PAT compression despite topline strength.
Peer Comparison Analysis
Healthcare Sector Peer Snapshot
| Company | LTP (₹) | Market Cap (₹ Cr) | Debt (₹ Cr) | EV (₹ Cr) | Sales (₹ Cr) |
| KIMS | 629.85 | 25,198.75 | 2,510.80 | 27,609.55 | 3,401.60 |
| Max Healthcare | 1,081.40 | 105,117.46 | 2,716.83 | 107,337.27 | 7,941.09 |
| Apollo Hospitals | 7,172.00 | 103,117.32 | 5,341.10 | 107,192.52 | 23,264.70 |
| Fortis Healthcare | 902.70 | 68,112.32 | 2,632.30 | 70,326.08 | 8,433.62 |
| Narayana Hrudayalaya | 1,876.20 | 38,320.72 | 2,135.46 | 39,938.18 | 5,993.18 |
Competitive Positioning
- KIMS operates at smaller scale but higher efficiency.
- Debt levels remain manageable.
- Valuation multiple reflects growth expectations rather than current earnings dominance.
Institutional Ownership and Market Behavior
Institutional ownership plays a decisive role in interpreting price behavior, particularly during corrective phases. In the case of Krishna Institute of Medical Sciences (KIMS), delivery data and volume structure strongly support the presence of institutional accumulation rather than distribution. The market activity over recent weeks reflects deliberate positioning by long-term participants rather than reactive selling by weak hands.
The most compelling evidence lies in the consistently high delivery percentages during periods of price decline. When stocks fall sharply due to fear or forced liquidation, delivery ratios typically drop as traders exit positions through intraday or short-term trades. KIMS shows the opposite pattern. Delivery percentages remain elevated, often exceeding 60%, even as prices retreat. This behavior indicates that buyers willingly take ownership of shares at lower levels instead of waiting for further downside. Such commitment usually comes from institutional investors, including domestic institutions, long-only funds, and high-conviction portfolio managers.
Another critical signal emerges from the absence of abnormal volume spikes. Panic-driven selling almost always produces sudden surges in traded volume as market participants rush to exit simultaneously. KIMS does not exhibit such characteristics. Volume remains steady and orderly throughout the correction. Sellers distribute shares gradually, and buyers absorb supply without disruption. This balance confirms a controlled transfer of ownership rather than a disorderly exit.
Volatility behavior further reinforces this conclusion. Despite multiple weeks of negative returns, daily and weekly price swings remain contained. Large gap-down openings, long bearish candles, or cascading stop-loss events do not appear. Instead, the stock trades within a narrowing range, signaling negotiation between buyers and sellers. Institutions typically prefer such environments, as they allow accumulation without chasing prices higher or triggering excessive attention.
Institutional investors rarely pursue momentum at euphoric highs. They operate with predefined valuation models, risk limits, and time horizons. Corrective phases provide optimal entry conditions, as they combine reduced sentiment, lower prices, and abundant liquidity. KIMS currently exhibits all these characteristics. Price has cooled from peak levels, sentiment has shifted from optimism to caution, and delivery absorption confirms active participation from long-term players.
The pattern also suggests a shift in ownership structure. Short-term traders and leveraged participants exit during corrections, while institutions step in to build positions gradually. This transition reduces future supply overhang and improves the quality of the shareholder base. Once this process completes, even modest demand can trigger sharp upward price responses due to reduced floating supply.
Risk Factors
Valuation remains elevated relative to current earnings growth, which limits immediate upside and increases sensitivity to even modest earnings disappointments or guidance downgrades.
PAT compression may persist if operating margins fail to expand, especially as rising employee costs, expansion-related expenses, and normalization of post-pandemic profitability continue to pressure net margins.
Wave 4 corrective phases often extend in time rather than price, which means the stock may continue to consolidate in a broad range and test investor patience even if major downside levels remain protected.
The healthcare sector operates under constant regulatory scrutiny, and any adverse changes in pricing controls, insurance reimbursement structures, or government healthcare policies could directly impact profitability and valuation multiples.
Opportunity Factors
The company commands a strong regional franchise with established brand equity, and ongoing bed expansion provides a clear runway for sustained revenue growth over the medium to long term.
KIMS consistently delivers high return on capital employed despite operating in an asset-intensive industry, which highlights efficient capital allocation and disciplined operational execution.
The current technical setup favors mean reversion rallies, as momentum indicators approach oversold levels while price remains within a structurally intact uptrend.
Persistent institutional accumulation during the corrective phase reduces downside tail risk, strengthens the shareholder base, and increases the probability of a sharp recovery once selling pressure exhausts.
Technical Levels to Monitor
| Level | Significance |
| ₹600–620 | Major support zone |
| ₹580 | Breakdown risk level |
| ₹700–720 | First resistance |
| ₹750+ | Wave 5 breakout zone |
Forward-Looking Technical Scenario
The forward technical outlook for Krishna Institute of Medical Sciences (KIMS) hinges on the stock’s ability to sustain above the ₹600 psychological and structural support zone. This level represents more than a round number; it aligns with the lower boundary of the current corrective structure and coincides with areas where delivery absorption has remained consistently strong. As long as price continues to hold above this zone with elevated delivery participation, the market signals that long-term investors continue to absorb supply rather than exit positions.
If this condition persists, the market likely completes the ongoing Wave 4 consolidation phase. Wave 4 structures typically resolve through time-based consolidation rather than sharp directional moves. In such scenarios, price oscillates within a defined range while momentum indicators reset and valuation expectations normalize. KIMS already exhibits these characteristics through narrowing price ranges, overlapping candles, and declining but stabilizing momentum readings. This behavior suggests preparation rather than exhaustion.
Upon completion of Wave 4, the technical framework supports the emergence of a Wave 5 impulsive advance. Wave 5 rallies often occur with improving sentiment but lower momentum divergence than Wave 3, driven by renewed participation from trend followers and institutions that completed accumulation during the corrective phase. In KIMS, a successful base above ₹600 could provide the launchpad for a move toward the ₹750–800 zone over the medium term, which aligns with prior resistance, Fibonacci extensions, and psychological price targets.
However, risk management remains essential. A decisive breakdown below ₹580 would invalidate the current bullish wave structure. Such a move would indicate that buyers failed to defend the correction boundary, opening the possibility of a deeper retracement toward lower value areas. This scenario would shift the technical narrative from corrective consolidation to structural reassessment and demand a fresh evaluation of trend strength.
Final Thoughts
KIMS currently stands at a critical intersection where valuation compression meets institutional accumulation. The market has already adjusted expectations by compressing price from peak levels while maintaining high delivery participation. This combination reflects a recalibration phase rather than a loss of confidence in the business model. Investors price in near-term margin pressure but continue to acknowledge the company’s long-term growth trajectory and operational strengths.
Delivery data, volume profile behavior, and RSI dynamics collectively point toward informed buying rather than distribution. The absence of panic-driven volume, coupled with controlled volatility, confirms that long-term participants continue to build exposure during weakness. Such behavior historically precedes stabilization and base formation rather than prolonged declines.
At current levels, the stock does not present a low-risk momentum entry. Valuations still demand patience, and the corrective phase may extend further in time. However, KIMS offers a structurally strong accumulation opportunity for investors who understand market cycles and remain comfortable with consolidation phases inside broader secular trends.
Price structure, volume behavior, and fundamental resilience now align toward stabilization rather than breakdown. As long as key support levels hold and institutional accumulation persists, the probability favors eventual trend resumption over structural deterioration.
Disclaimer
This article serves educational and analytical purposes only. It does not constitute investment advice or a recommendation to buy or sell securities
Also Read – Ghana Legalises Crypto Trading: A Turning Point