
The stock market is an intricate world driven by patterns, trends, and investor sentiment. Recognizing breakout prices and chart patterns offers valuable insights into potential stock movements. Below is an in-depth analysis of selected stocks, focusing on their breakout prices, chart patterns, current market prices (CMP), and the trends that drive their performance.
Jubilant FoodWorks Limited (JUBLFOOD)
Jubilant FoodWorks Limited (JUBLFOOD) is one of India’s leading food service companies. It operates popular quick-service restaurant brands like Domino’s Pizza and Dunkin’ Donuts in India and various other international markets. The company’s strong brand presence, efficient operational model, and consistent focus on expansion have made it a favorite among investors in the consumer goods sector.
Technical Pattern Analysis
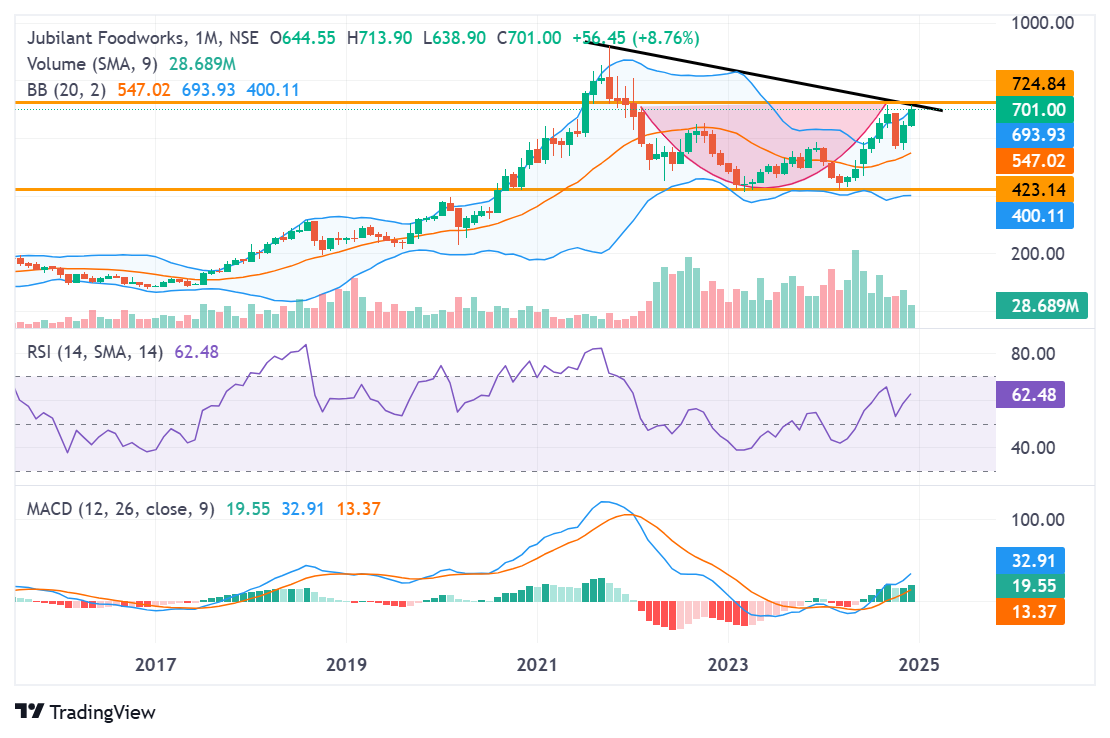
- Breakout Price: ₹713.9
- Pattern: Cup with Handle
- CMP: ₹704.15
- Change: ₹12.5 (1.8%)
The Cup with Handle is a classic bullish chart pattern. It resembles the shape of a tea cup, where the “cup” is formed after a rounded bottom of price consolidation and the “handle” represents a small dip that precedes the breakout. This pattern indicates accumulation and consolidation, often followed by upward momentum.
The breakout price of ₹713.9 represents a critical resistance level. A successful breach above this level, particularly with high trading volume, can confirm the continuation of the bullish trend.
Current Market Position
Jubilant FoodWorks is trading slightly below the breakout price, at ₹704.15. The stock has gained 1.8% in recent sessions, indicating growing investor interest and momentum. However, the failure to breach ₹713.9 suggests some hesitation or resistance near this level.
This position reflects that the market is testing investor conviction, with traders watching closely for confirmation of the breakout.
Key Indicators and Signals
- Positive Price Action: The 1.8% gain is a sign of positive sentiment, showing that investors are accumulating shares in anticipation of a breakout.
- Volume Trends: A breakout above ₹713.9, supported by high trading volumes, would validate the bullish trend. Weak volumes could signal a false breakout or continued consolidation.
- Resistance Level Testing: The proximity to the breakout price suggests that the stock may soon attempt to retest and breach this level. A sustained move above ₹713.9 could trigger significant buying interest.
Fundamental Strengths Driving Momentum
- Strong Brand Value: Jubilant FoodWorks benefits from a well-established brand with high consumer recall, particularly Domino’s Pizza, which dominates India’s QSR (Quick Service Restaurant) market.
- Market Leadership: The company holds a leadership position in India’s growing food delivery and dine-in markets. Its strong presence in tier-2 and tier-3 cities supports continued growth.
- Expansion and Innovation: Jubilant FoodWorks continues to expand its store network and explore new product categories. Recent launches, promotions, and collaborations further enhance its market position.
- Digital Integration: Investment in digital platforms and delivery systems has strengthened operational efficiency, particularly during the pandemic-driven surge in online ordering.
- Sector Growth: The Indian QSR market is projected to grow significantly, driven by urbanization, increasing disposable incomes, and changing consumer preferences for convenience foods.
Potential Challenges
- Cost Pressures: Rising inflation and higher raw material costs can pressure margins, potentially affecting profitability.
- Intense Competition: The QSR space is highly competitive, with established players and new entrants vying for market share.
- Consumer Sentiment: Changes in discretionary spending patterns or economic slowdowns may impact revenue growth.
Scenario Analysis
- Bullish Case:
- If Jubilant FoodWorks breaches ₹713.9 with strong volume, the Cup with Handle pattern would confirm a bullish breakout.
- The stock could then aim for higher resistance levels at ₹750 and beyond.
- Momentum traders and swing investors would likely increase participation, driving short-term gains.
- Bearish Case:
- If the stock fails to break ₹713.9 and retraces, it could consolidate further or even decline to test support levels around ₹680.
- A lack of volume during the breakout attempt would signal weak conviction, warranting caution.
- Neutral Case:
- The stock may consolidate further between ₹690 and ₹713.9 as investors await broader market cues or company-specific catalysts to drive the next significant move.
Investment Strategy
- For Swing Traders: Monitor the stock closely for a breakout above ₹713.9 with increased trading volumes. Enter positions on confirmation of the breakout and set stop-loss levels slightly below the handle’s lower boundary (around ₹690).
- For Long-Term Investors: Focus on the company’s strong fundamentals and growth potential in the QSR space. Consider accumulating shares during pullbacks, particularly if the stock consolidates near support levels.
Volume and Momentum Considerations
Volume plays a critical role in confirming breakout patterns. For Jubilant FoodWorks:
- High Volume Breakout: Indicates strong buying interest and validates the Cup with Handle pattern.
- Low Volume Breakout: Raises caution, as the breakout may lack sustainability and could result in a pullback.
Momentum indicators like the Relative Strength Index (RSI) and Moving Average Convergence Divergence (MACD) can provide additional confirmation. If the RSI moves into the overbought zone with strong volumes, it would support a bullish outlook.
Support and Resistance Levels
- Immediate Resistance: ₹713.9 (Breakout Price)
- Next Resistance Levels: ₹750 and ₹780
- Immediate Support: ₹690
- Next Support Levels: ₹670 and ₹650
A decisive break above ₹713.9 could see the stock test higher resistance levels, while failure to hold above ₹690 might lead to further consolidation or downside.
The India Cements Limited (INDIACEM)
India Cements Limited is a well-established player in the Indian cement industry. With a diversified product portfolio and strong regional presence, the company caters to a wide range of construction and infrastructure projects. Despite sectoral challenges, India Cements has managed to maintain its market position, and its current technical setup suggests potential for an upward move.
Technical Pattern Analysis
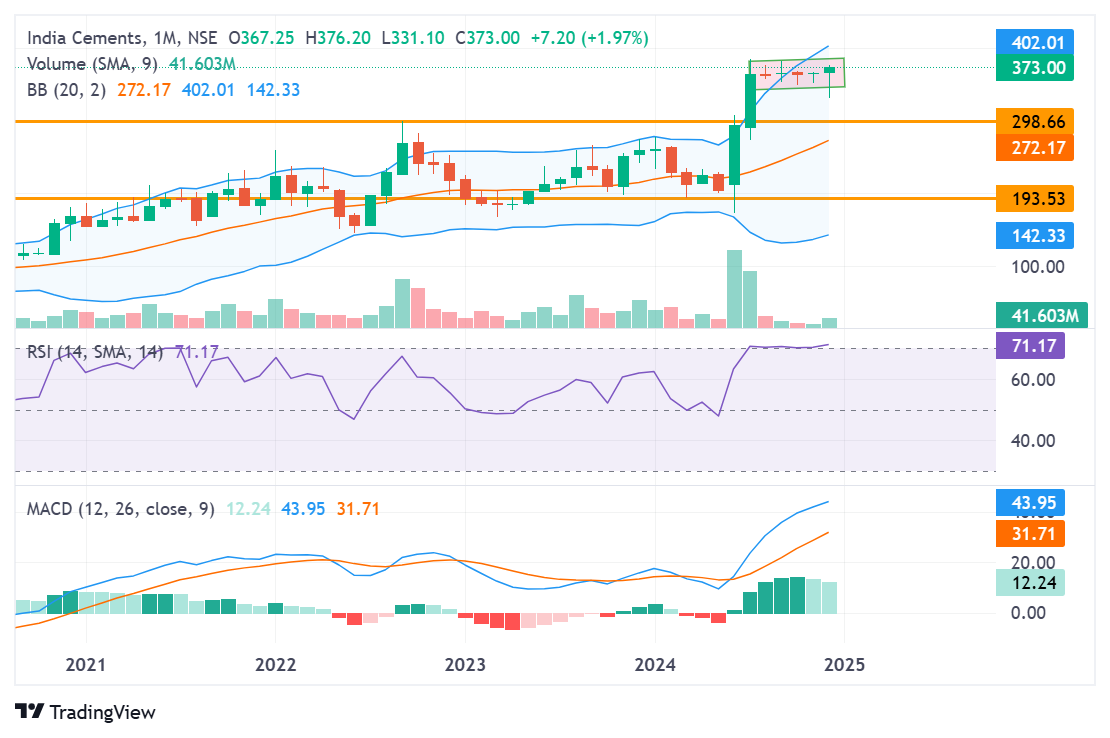
- Breakout Price: ₹385
- Pattern: Flat Base
- CMP: ₹372.45
- Change: ₹6.2 (1.7%)
The Flat Base pattern is a consolidation pattern that reflects a period of indecision in the market. This setup occurs after a prior uptrend and is marked by a relatively narrow trading range. It often signals that the stock is building strength for a potential breakout above resistance.
In India Cements’ case, the breakout price of ₹385 is a significant resistance level. The stock’s CMP of ₹372.45, combined with a 1.7% gain, suggests that the price is inching closer to this key level. The slow but steady upward movement reflects investor accumulation, a positive sign for bullish momentum.
Current Market Position
India Cements is trading near its breakout level, indicating potential upward momentum. The following factors are driving this setup:
- Investor Accumulation: The stock’s gradual rise in price hints at accumulation by investors, particularly institutional players.
- Narrow Trading Range: The tight trading range preceding the breakout price shows that sellers are not dominating the market.
A decisive move above ₹385, supported by high trading volumes, could confirm the breakout and attract further buying interest.
Key Indicators and Signals
- Price Momentum: The 1.7% gain reflects growing investor interest, signaling the stock may be preparing for a breakout.
- Volume Trends: Increased trading volumes during a breakout would validate the Flat Base pattern and indicate strong market confidence.
- Resistance Testing: The stock’s approach to ₹385 suggests that it is testing resistance, and a successful breach could trigger bullish momentum.
Fundamental Strengths Driving the Stock
- Infrastructure Demand: The ongoing expansion of infrastructure projects in India creates strong demand for cement, benefiting India Cements.
- Regional Leadership: The company’s dominance in southern India, a key market for cement, ensures a steady revenue stream.
- Diversified Product Range: India Cements’ broad product portfolio caters to various construction needs, from residential to industrial projects.
- Operational Improvements: Efforts to reduce costs and improve efficiency position the company for long-term profitability.
Potential Challenges
- Rising Input Costs: Fluctuating prices of raw materials like limestone and coal can pressure margins.
- Intense Competition: The cement industry is highly competitive, with established players vying for market share.
- Economic Cyclicality: The demand for cement is closely tied to economic activity, making it susceptible to downturns.
Scenario Analysis
- Bullish Case:
- A breakout above ₹385, supported by increased volumes, would confirm the Flat Base pattern and indicate strong upward momentum.
- The stock could then target higher resistance levels at ₹400 and ₹420, offering short-term trading opportunities.
- Bearish Case:
- If the stock fails to break above ₹385 and retraces, it could test support levels around ₹360.
- A sustained decline below ₹360 would invalidate the bullish setup and indicate further consolidation or downside.
- Neutral Case:
- The stock may continue consolidating between ₹360 and ₹385, awaiting additional market catalysts to drive a decisive move.
Investment Strategy
- For Swing Traders: Monitor the stock closely for a breakout above ₹385 with strong trading volumes. Enter positions on confirmation and set stop-loss levels near ₹360 to manage risk.
- For Long-Term Investors: Focus on India Cements’ strong fundamentals, particularly its leadership in key markets and growth prospects in the infrastructure sector. Accumulate shares during dips or consolidation phases for long-term gains.
Volume and Momentum Considerations
Volume plays a critical role in validating breakout patterns. For India Cements:
- High Volume Breakout: A surge in trading volumes above ₹385 would confirm the breakout and signal strong investor interest.
- Low Volume Breakout: A breakout with weak volumes may lack sustainability and could lead to a pullback.
Momentum indicators such as RSI (Relative Strength Index) and MACD (Moving Average Convergence Divergence) can provide additional confirmation. If RSI enters the overbought zone during the breakout, it may indicate strong bullish momentum.
Support and Resistance Levels
- Immediate Resistance: ₹385 (Breakout Price)
- Next Resistance Levels: ₹400 and ₹420
- Immediate Support: ₹360
- Next Support Levels: ₹340 and ₹320
A decisive break above ₹385 could pave the way for higher resistance levels, while failure to hold ₹360 might lead to further consolidation or a bearish trend.
Sectoral Outlook
The Indian cement sector is poised for growth, driven by:
- Government Infrastructure Initiatives: Programs like PM Gati Shakti and Smart Cities Mission are boosting demand for cement.
- Affordable Housing: Increased focus on affordable housing is creating consistent demand for construction materials.
- Export Opportunities: Indian cement companies are exploring export markets, adding revenue diversification.
India Cements is well-positioned to capitalize on these trends, given its operational scale and regional dominance.
Redington Limited (REDINGTON)
Redington Limited is a leading distributor of IT products, services, and solutions across India and international markets. The company partners with global brands to deliver technology solutions in areas like cloud computing, cybersecurity, and enterprise hardware. Its strong operational model and broad market reach have positioned Redington as a key player in the rapidly evolving IT distribution sector.
Technical Pattern Analysis
- Breakout Price: ₹215.9
- Pattern: Cup with Handle
- CMP: ₹208.73
- Change: ₹2.8 (1.4%)
The Cup with Handle pattern is a classic bullish setup, often indicating that a stock is building strength for a potential breakout. The “cup” reflects a rounded consolidation phase, while the “handle” shows a minor pullback, typically preceding the breakout. The breakout price of ₹215.9 represents a critical resistance level. Once breached with strong volume, this could signal the continuation of an upward trend.
Redington’s CMP of ₹208.73, coupled with a modest 1.4% gain, suggests accumulation by investors. The handle formation indicates temporary consolidation, a healthy sign in a bullish setup.
Current Market Position
Redington is trading close to its breakout price, suggesting the possibility of upward movement. Key observations include:
- Accumulation Phase: The modest gains suggest investors are gradually building positions, preparing for a potential breakout.
- Resistance at ₹215.9: The breakout price serves as a psychological and technical barrier. A decisive breach could signal a strong upward trend.
The stock’s behavior near the breakout level indicates that market participants are awaiting confirmation of sustained momentum.
Key Indicators and Signals
- Price Momentum: The 1.4% gain reflects cautious optimism, signaling that investors are positioning for a potential breakout.
- Volume Trends: Higher trading volumes during a breakout would validate the Cup with Handle pattern and confirm bullish sentiment.
- Handle Consolidation: The temporary dip within the handle phase is typical and suggests healthy consolidation before a breakout attempt.
Fundamental Strengths Supporting the Stock
- Expanding IT Demand: Redington benefits from the growing global demand for IT products and services, particularly in cloud computing, digital transformation, and enterprise solutions.
- Strong Partnerships: Collaborations with major global tech brands provide the company with a robust product portfolio and revenue stability.
- Geographic Diversification: Operations in India, the Middle East, Africa, and South Asia reduce dependency on a single market and mitigate regional risks.
- Operational Efficiency: Redington’s focus on supply chain optimization and cost management enhances profitability.
Potential Challenges
- Competitive Market: The IT distribution industry is highly competitive, with low margins requiring constant operational excellence.
- Economic Sensitivity: Demand for IT products can be cyclical, tied to broader economic trends and corporate spending.
- Currency Volatility: As an international distributor, Redington is exposed to foreign exchange fluctuations, which could impact earnings.
Scenario Analysis
- Bullish Case:
- A breakout above ₹215.9, supported by significant trading volumes, would confirm the Cup with Handle pattern.
- The stock could then target higher resistance levels at ₹230 and ₹250, offering strong short-term upside potential.
- Bearish Case:
- If the stock fails to breach ₹215.9, it may consolidate further or decline to test support levels near ₹200.
- Weak volumes during the breakout attempt could signal a lack of conviction, potentially leading to a pullback.
- Neutral Case:
- The stock may continue trading in a narrow range between ₹200 and ₹215.9, awaiting additional market catalysts to drive momentum.
Investment Strategy
- For Swing Traders: Monitor the stock closely for a breakout above ₹215.9 with high volumes. Enter positions on confirmation and set stop-loss levels near ₹200 to manage downside risks.
- For Long-Term Investors: Focus on Redington’s strong fundamentals and its positioning in the IT sector. Consider accumulating shares during periods of consolidation for long-term portfolio gains.
Volume and Momentum Considerations
Volume plays a critical role in validating breakout patterns. For Redington:
- High Volume Breakout: A surge in trading volumes above ₹215.9 would indicate strong buying interest and validate the pattern.
- Low Volume Breakout: A breakout with weak volumes may lack sustainability and could result in a pullback or further consolidation.
Momentum indicators such as RSI (Relative Strength Index) and MACD (Moving Average Convergence Divergence) can provide additional insights. An overbought RSI during the breakout phase might indicate strong bullish momentum.
Support and Resistance Levels
- Immediate Resistance: ₹215.9 (Breakout Price)
- Next Resistance Levels: ₹230 and ₹250
- Immediate Support: ₹200
- Next Support Levels: ₹190 and ₹180
A decisive break above ₹215.9 could open the path to higher resistance levels, while failure to hold above ₹200 might lead to further downside.
Sectoral Outlook
The IT distribution sector is poised for growth, driven by:
- Digital Transformation: Companies across industries are investing heavily in IT solutions, boosting demand for distribution services.
- Cloud Adoption: Redington is well-positioned to benefit from the growing shift to cloud-based solutions and enterprise software.
- Global Supply Chain Recovery: As global supply chains stabilize post-pandemic, the company is likely to benefit from improved logistics and inventory management.
Sarda Energy & Minerals Limited (SARDAEN)
Sarda Energy & Minerals Limited (SARDAEN) is a diversified natural resources company engaged in the production of steel and ferroalloys. The company also operates in mining and renewable energy sectors, providing it with multiple revenue streams. With a robust operational foundation and significant market presence, Sarda Energy has been a consistent player in the Indian industrial sector.
Technical Pattern Analysis
- Breakout Price: ₹500.95
- Pattern: Cup with Handle
- CMP: ₹477.80
- Change: ₹4.2 (0.9%)
The Cup with Handle is a reliable bullish chart pattern that signifies a period of consolidation followed by an upward breakout. The “cup” portion reflects a rounded bottom formation after a decline, showing market stabilization, while the “handle” represents a minor pullback, indicating short-term consolidation before the next move up.
In Sarda Energy’s case, the breakout price of ₹500.95 is the critical resistance level. The stock is currently trading at ₹477.80, slightly below this level, with a marginal 0.9% gain. The subdued momentum indicates a phase of accumulation, where investors are cautiously positioning for a potential breakout.
Current Market Position
The stock is consolidating below its breakout price, a sign of market participants waiting for confirmation of a stronger trend. Key observations include:
- Subdued Momentum: The marginal gain reflects cautious optimism but also suggests that investors are waiting for stronger signals.
- Key Resistance at ₹500.95: The stock is nearing its breakout level, which, if breached with high volumes, could lead to strong upward momentum.
Key Indicators and Signals
- Handle Consolidation: The handle formation signifies temporary consolidation, which is healthy in a bullish setup as it prevents overextension.
- Volume Confirmation: High trading volumes during a breakout above ₹500.95 would validate the Cup with Handle pattern and indicate sustained buying interest.
- Momentum Indicators: Indicators such as RSI (Relative Strength Index) and MACD (Moving Average Convergence Divergence) should be monitored for signs of strengthening momentum.
Fundamental Strengths Supporting the Stock
- Diversified Operations: Sarda Energy’s exposure to steel, ferroalloys, and mining ensures stable revenue streams even during sectoral fluctuations.
- Renewable Energy Focus: The company’s investments in renewable energy align with global sustainability trends and provide long-term growth opportunities.
- Sectoral Tailwinds: Increased infrastructure spending and industrial growth in India support the demand for steel and related products.
- Operational Efficiency: Strong cost management and resource utilization enhance the company’s competitive edge.
Potential Challenges
- Volatile Commodity Prices: Fluctuations in raw material prices such as iron ore and manganese could impact profitability.
- Global Economic Conditions: The steel and mining industries are cyclical and sensitive to global economic trends, which could affect demand.
- Regulatory Risks: Environmental regulations and government policies on mining and steel production may pose operational challenges.
Scenario Analysis
- Bullish Case:
- A breakout above ₹500.95 with significant trading volumes would confirm the Cup with Handle pattern.
- The stock could then target higher resistance levels at ₹530 and ₹550, offering potential for short-term gains.
- Bearish Case:
- If the stock fails to breach ₹500.95 and retraces, it could test support levels around ₹460.
- A decline below ₹460 would invalidate the bullish setup and suggest further consolidation or downside.
- Neutral Case:
- The stock may continue consolidating between ₹460 and ₹500.95, awaiting a catalyst to trigger the next major move.
Investment Strategy
- For Swing Traders: Look for a breakout above ₹500.95 with strong volume as a confirmation signal. Enter positions on breakout and set a stop-loss near ₹460 to manage risks.
- For Long-Term Investors: Consider accumulating shares during the consolidation phase, focusing on the company’s diversified operations and strong fundamentals for long-term growth.
Volume and Momentum Considerations
Volume is crucial for validating breakout patterns. For Sarda Energy:
- High Volume Breakout: A surge in trading volumes during the breach of ₹500.95 would confirm the bullish trend and indicate strong investor confidence.
- Low Volume Breakout: A breakout without significant volume may lack sustainability and could lead to a pullback.
Momentum indicators like RSI and MACD can provide additional insights into the stock’s strength during the breakout phase. An overbought RSI near the breakout level could signal strong bullish momentum.
Support and Resistance Levels
- Immediate Resistance: ₹500.95 (Breakout Price)
- Next Resistance Levels: ₹530 and ₹550
- Immediate Support: ₹460
- Next Support Levels: ₹440 and ₹420
A decisive move above ₹500.95 could signal a robust bullish trend, while failure to hold ₹460 might lead to a retest of lower support levels.
Sectoral Outlook
The steel and mining sectors are benefiting from:
- Increased Infrastructure Spending: Government initiatives such as road and railway development drive demand for steel and ferroalloys.
- Global Demand for Metals: Rising global industrial activity supports the demand for raw materials, benefiting companies like Sarda Energy.
- Sustainability Focus: Investments in renewable energy and sustainable mining practices align with global trends and enhance long-term growth prospects.
Dr. Reddy’s Laboratories Limited (DRREDDY)
Dr. Reddy’s Laboratories Limited is a leading pharmaceutical company with a strong global presence. The company specializes in the production of generic medicines, active pharmaceutical ingredients (APIs), and innovative therapeutics. Dr. Reddy’s is recognized for its research-driven approach and diversified product portfolio, catering to both emerging and developed markets.
Technical Pattern Analysis
- Breakout Price: ₹1,421.49
- Pattern: Consolidation
- CMP: ₹1,350.90
- Change: ₹9.6 (0.7%)
The Consolidation pattern reflects a phase where the stock moves within a tight range, indicating a balance between buyers and sellers. This pattern often precedes a breakout, as the price builds momentum for the next significant move. For Dr. Reddy’s, the breakout price of ₹1,421.49 represents a critical resistance level. A confirmed breach of this level, particularly with high trading volumes, could signal strong bullish momentum.
The CMP of ₹1,350.90, coupled with a modest gain of 0.7%, suggests limited upward momentum at present. This reflects a phase of indecision in the market, where investors are cautiously evaluating the stock’s next direction.
Current Market Position
Dr. Reddy’s is trading below its breakout price, consolidating within a narrow range. Key observations include:
- Limited Upward Momentum: The modest 0.7% gain highlights cautious sentiment among investors.
- Resistance at ₹1,421.49: The breakout price serves as a strong resistance level, requiring significant buying interest to breach.
- Market Indecision: The consolidation pattern reflects a balance of forces, with neither buyers nor sellers dominating.
Key Indicators and Signals
- Volume Trends: A breakout above ₹1,421.49 supported by high trading volumes would confirm bullish sentiment and validate the consolidation pattern.
- Momentum Indicators: Indicators like RSI (Relative Strength Index) and MACD (Moving Average Convergence Divergence) should be monitored for signs of strengthening momentum.
- Support Testing: Failure to break out could lead to a retest of lower support levels, such as ₹1,300.
Fundamental Strengths Supporting the Stock
- Global Reach: Dr. Reddy’s strong presence in regulated markets like the US, Europe, and emerging economies provides diversified revenue streams.
- Robust Product Portfolio: A mix of generics, biosimilars, and proprietary drugs positions the company well to capture opportunities across market segments.
- Focus on Innovation: Ongoing investments in research and development strengthen the company’s pipeline of new drugs and therapies.
- API Leadership: Dr. Reddy’s is a significant player in the API market, benefiting from rising global demand for high-quality pharmaceutical ingredients.
Potential Challenges
- Regulatory Risks: As a global pharmaceutical company, Dr. Reddy’s operations are subject to stringent regulatory oversight, posing risks of delays or penalties.
- Pricing Pressures: Intense competition in the generics market, particularly in the US, could lead to margin compression.
- Global Economic Factors: Changes in currency exchange rates or economic slowdowns in key markets may impact revenues.
Scenario Analysis
- Bullish Case:
- A breakout above ₹1,421.49 with significant volume would confirm bullish momentum.
- The stock could then target higher resistance levels at ₹1,500 and ₹1,550, offering strong upside potential.
- Bearish Case:
- If the stock fails to break out and retraces, it could test support levels near ₹1,300.
- A sustained decline below ₹1,300 could invalidate the bullish setup and indicate further downside.
- Neutral Case:
- The stock may continue consolidating between ₹1,300 and ₹1,421.49, awaiting a market catalyst to determine the next move.
Investment Strategy
- For Swing Traders: Monitor the stock closely for a breakout above ₹1,421.49 with strong trading volumes. Enter positions on confirmation and set a stop-loss near ₹1,300 to manage risks.
- For Long-Term Investors: Focus on the company’s strong fundamentals, particularly its leadership in the global pharmaceutical market. Consider accumulating shares during pullbacks or consolidation phases for long-term portfolio gains.
Volume and Momentum Considerations
Volume is critical for validating breakout patterns. For Dr. Reddy’s:
- High Volume Breakout: A surge in trading volumes during the breach of ₹1,421.49 would confirm a bullish trend and indicate strong buying interest.
- Low Volume Breakout: A breakout without significant volume may lack sustainability and could result in a pullback.
Momentum indicators such as RSI and MACD can provide additional insights. An overbought RSI near the breakout level could indicate strong bullish momentum.
Support and Resistance Levels
- Immediate Resistance: ₹1,421.49 (Breakout Price)
- Next Resistance Levels: ₹1,500 and ₹1,550
- Immediate Support: ₹1,300
- Next Support Levels: ₹1,250 and ₹1,200
A decisive break above ₹1,421.49 could open the path to higher resistance levels, while failure to hold ₹1,300 might lead to further consolidation or downside.
Sectoral Outlook
The pharmaceutical sector is positioned for growth, driven by:
- Global Healthcare Demand: Rising demand for affordable medicines, particularly generics, supports the growth of companies like Dr. Reddy’s.
- Biosimilar Opportunities: The increasing adoption of biosimilars in regulated markets presents significant growth potential.
- Emerging Market Expansion: Growing healthcare access in emerging economies creates opportunities for market leaders.
Sudarshan Chemical Industries Limited (SUDARSCHEM)
Sudarshan Chemical Industries Limited is a leading manufacturer of color pigments in India and a prominent global player in the sector. The company’s diverse product range caters to industries such as coatings, plastics, printing inks, cosmetics, and textiles. Its strong market position, innovative product development, and focus on exports drive long-term growth potential.
Technical Pattern Analysis
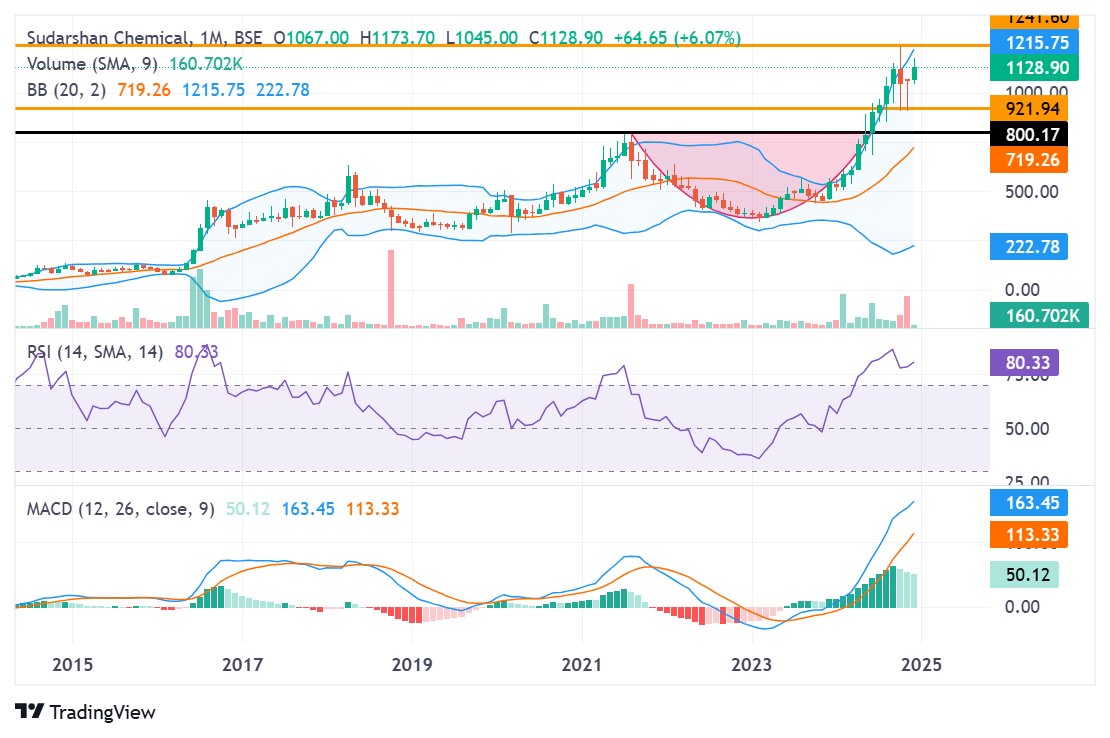
- Breakout Price: ₹1,174
- Pattern: Cup with Handle
- CMP: ₹1,131.95
- Change: ₹7.1 (0.6%)
The Cup with Handle pattern is a reliable bullish formation, often signaling that a stock is consolidating before its next upward move. The “cup” signifies a period of accumulation and stabilization, while the “handle” represents a minor pullback, creating a resistance level that, once breached, could trigger a breakout.
For Sudarshan Chemical, the breakout price at ₹1,174 represents a critical resistance level. The CMP of ₹1,131.95, along with a modest 0.6% gain, suggests that the stock is consolidating just below the breakout price. This consolidation phase indicates healthy accumulation and sets the stage for a potential upward trend.
Current Market Position
Sudarshan Chemical is trading near its breakout level, indicating potential upward momentum. Key observations include:
- Consolidation Below Resistance: The stock is stabilizing below ₹1,174, signaling that investors are preparing for the next move.
- Modest Gains: The 0.6% increase reflects cautious optimism among market participants, typical in the handle phase of this pattern.
Key Indicators and Signals
- Volume Trends: High trading volumes during a breakout above ₹1,174 would confirm the Cup with Handle pattern and indicate strong buying interest.
- Momentum Indicators: Monitoring RSI (Relative Strength Index) and MACD (Moving Average Convergence Divergence) can provide additional insights into the stock’s strength.
- Support Testing: Failure to break out could lead to a retest of lower support levels near ₹1,100.
Fundamental Strengths Supporting the Stock
- Global Market Presence: Sudarshan Chemical has a strong foothold in both domestic and international pigment markets, providing revenue diversification.
- Innovative Product Portfolio: The company invests in R&D to develop high-performance pigments for various applications, ensuring market relevance.
- Export Focus: With exports contributing a significant portion of revenue, the company benefits from global demand for high-quality pigments.
- Sectoral Growth: The increasing use of pigments in high-growth industries like coatings and cosmetics supports long-term demand.
Potential Challenges
- Raw Material Price Volatility: Fluctuating prices of raw materials used in pigment manufacturing can pressure margins.
- Global Competition: The pigments industry is highly competitive, requiring continuous innovation and cost efficiency to maintain market share.
- Currency Risk: As a significant exporter, the company is exposed to fluctuations in currency exchange rates, which can impact earnings.
Scenario Analysis
- Bullish Case:
- A breakout above ₹1,174, supported by strong trading volumes, would confirm the Cup with Handle pattern.
- The stock could then target higher resistance levels at ₹1,200 and ₹1,250, offering potential for short-term gains.
- Bearish Case:
- If the stock fails to breach ₹1,174, it may consolidate further or decline to test support levels near ₹1,100.
- A sustained decline below ₹1,100 would invalidate the bullish setup and indicate further downside.
- Neutral Case:
- The stock may continue to trade between ₹1,100 and ₹1,174, awaiting a catalyst to determine its next direction.
Investment Strategy
- For Swing Traders: Monitor the stock closely for a breakout above ₹1,174 with significant trading volumes. Enter positions on confirmation and set a stop-loss near ₹1,100 to manage risks.
- For Long-Term Investors: Focus on the company’s strong fundamentals and growth potential in the pigments industry. Consider accumulating shares during periods of consolidation for long-term portfolio gains.
Volume and Momentum Considerations
Volume is crucial for validating breakout patterns. For Sudarshan Chemical:
- High Volume Breakout: A surge in trading volumes during the breach of ₹1,174 would confirm bullish momentum and signal strong investor confidence.
- Low Volume Breakout: A breakout without significant volume may lack sustainability and could result in a pullback.
Momentum indicators such as RSI and MACD can provide additional insights. An overbought RSI during the breakout phase could indicate strong bullish momentum.
Support and Resistance Levels
- Immediate Resistance: ₹1,174 (Breakout Price)
- Next Resistance Levels: ₹1,200 and ₹1,250
- Immediate Support: ₹1,100
- Next Support Levels: ₹1,050 and ₹1,000
A decisive move above ₹1,174 could signal a robust upward trend, while failure to hold ₹1,100 might lead to further downside or consolidation.
Sectoral Outlook
The pigments industry is poised for growth, driven by:
- Increasing Industrial Applications: Rising demand for pigments in coatings, plastics, and cosmetics supports long-term growth.
- Sustainability Trends: Growing focus on eco-friendly and high-performance pigments aligns with global sustainability initiatives.
- Global Economic Recovery: Increased industrial activity and infrastructure spending are boosting demand for pigment-based products.
Apollo Tyres Limited (APOLLOTYRE)
Apollo Tyres Limited is a leading tyre manufacturer with a robust market presence in India and a growing footprint in international markets. The company offers a diverse range of tyres for passenger vehicles, commercial vehicles, and two-wheelers. Known for its focus on innovation, quality, and brand value, Apollo Tyres has consistently positioned itself as a key player in the global tyre industry.
Technical Pattern Analysis
- Breakout Price: ₹557
- Pattern: Cup with Handle
- CMP: ₹534.80
- Change: ₹2.7 (0.5%)
The Cup with Handle pattern is a bullish chart formation, often signaling a consolidation phase before a breakout to higher levels. The “cup” represents a rounded bottom, showing stabilization after a decline, while the “handle” indicates a minor pullback, setting up a resistance level that needs to be breached for further gains.
For Apollo Tyres, the breakout price of ₹557 serves as a critical resistance level. The current market price (CMP) of ₹534.80, coupled with a modest 0.5% gain, indicates a phase of consolidation below this resistance. This setup is typical of the handle phase, where the stock builds momentum for a potential breakout.
Current Market Position
Apollo Tyres is trading below its breakout price, consolidating in a narrow range. Key observations include:
- Consolidation Below Resistance: The stock is stabilizing just below ₹557, indicating cautious accumulation by investors.
- Modest Gains: The small 0.5% increase reflects subdued momentum, suggesting that the market is awaiting confirmation of a breakout.
Key Indicators and Signals
- Volume Confirmation: A breakout above ₹557, supported by significant trading volumes, would validate the Cup with Handle pattern and indicate sustained bullish sentiment.
- Momentum Indicators: Monitoring RSI (Relative Strength Index) and MACD (Moving Average Convergence Divergence) can help gauge the strength of the stock’s momentum.
- Handle Formation: The handle phase is a healthy sign of consolidation, preventing the stock from becoming overextended before a breakout attempt.
Fundamental Strengths Supporting the Stock
- Market Leadership: Apollo Tyres enjoys a strong market position in India and significant brand recall, which supports stable revenue growth.
- Diversified Product Portfolio: The company offers tyres for a wide range of vehicles, reducing dependency on any single segment.
- Global Presence: Apollo Tyres’ growing presence in Europe, the Middle East, and other regions ensures revenue diversification and access to high-growth markets.
- Focus on Innovation: Investments in R&D and technology-driven manufacturing processes enhance the company’s competitive edge.
Potential Challenges
- Raw Material Costs: Fluctuations in the prices of key raw materials like rubber and crude oil derivatives can pressure margins.
- Global Competition: The tyre industry is highly competitive, with established players and new entrants vying for market share.
- Economic Sensitivity: Demand for tyres is closely tied to the automotive sector, making it susceptible to economic slowdowns.
Scenario Analysis
- Bullish Case:
- A breakout above ₹557, supported by strong trading volumes, would confirm the Cup with Handle pattern.
- The stock could then target higher resistance levels at ₹580 and ₹600, offering potential for short-term gains.
- Bearish Case:
- Failure to breach ₹557 could lead to continued consolidation or a decline to test support levels near ₹520.
- A sustained decline below ₹520 would invalidate the bullish setup and indicate further downside.
- Neutral Case:
- The stock may continue consolidating between ₹520 and ₹557, awaiting a catalyst to determine its next direction.
Investment Strategy
- For Swing Traders: Monitor the stock for a breakout above ₹557 with high trading volumes. Enter positions on confirmation and set a stop-loss near ₹520 to manage risks.
- For Long-Term Investors: Focus on Apollo Tyres’ strong fundamentals and growth potential in domestic and international markets. Consider accumulating shares during consolidation phases for long-term portfolio gains.
Volume and Momentum Considerations
Volume is critical for validating breakout patterns. For Apollo Tyres:
- High Volume Breakout: A surge in trading volumes during the breach of ₹557 would confirm the bullish trend and indicate strong buying interest.
- Low Volume Breakout: A breakout without significant volume may lack sustainability and could result in a pullback.
Momentum indicators like RSI and MACD can provide additional insights. An overbought RSI during the breakout phase could signal strong bullish momentum, while weak momentum could suggest continued consolidation.
Support and Resistance Levels
- Immediate Resistance: ₹557 (Breakout Price)
- Next Resistance Levels: ₹580 and ₹600
- Immediate Support: ₹520
- Next Support Levels: ₹500 and ₹480
A decisive move above ₹557 could lead to higher resistance levels, while failure to hold ₹520 might result in a deeper pullback.
Sectoral Outlook
The tyre industry is poised for growth, supported by:
- Automotive Recovery: As the global automotive sector recovers, demand for replacement and OEM (original equipment manufacturer) tyres is rising.
- Government Initiatives: Infrastructure development and policies supporting electric vehicles (EVs) boost tyre demand across categories.
- Export Opportunities: Rising global demand for high-quality tyres opens new markets for established players like Apollo Tyres.
Jindal Stainless Limited (JSL)
Jindal Stainless Limited (JSL) is a leading player in the stainless steel industry, known for its robust production capacity and innovative solutions. The company caters to diverse sectors, including automotive, construction, consumer goods, and industrial applications. JSL’s strong market position in India and its expanding global footprint make it a significant contributor to the stainless steel industry.
Technical Pattern Analysis
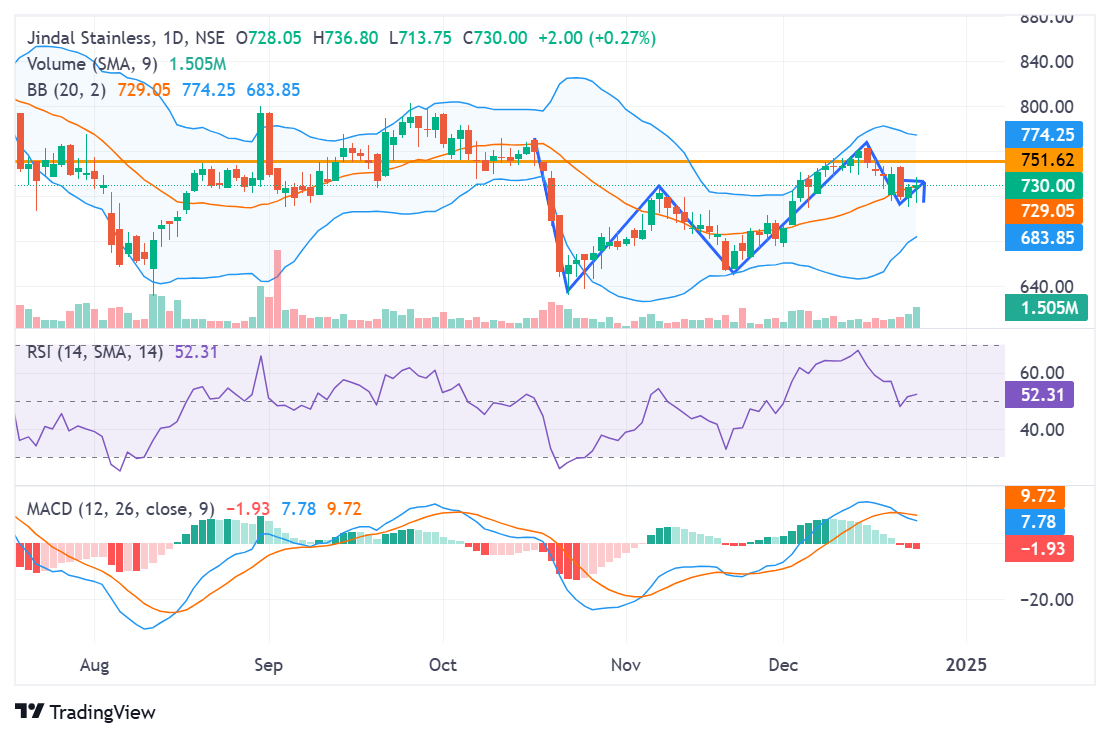
- Breakout Price: ₹763.95
- Pattern: Cup with Handle
- CMP: ₹730.05
- Change: ₹2.0 (0.3%)
The Cup with Handle pattern is a bullish technical setup. The “cup” signifies a phase of accumulation following a rounded decline and recovery, while the “handle” represents a temporary pullback, which serves as a launching point for the next upward move.
In Jindal Stainless, the breakout price of ₹763.95 is the critical resistance level. The CMP of ₹730.05, accompanied by a modest 0.3% gain, reflects a consolidation phase. This setup is typical in the handle formation, where the stock gathers momentum before attempting a breakout.
Current Market Position
Jindal Stainless is consolidating below its breakout price, signaling a period of indecision in the market. Key observations include:
- Handle Formation: The current price action shows the stock consolidating just below ₹763.95, indicating healthy accumulation before a potential breakout.
- Muted Momentum: The slight gain of 0.3% reflects cautious optimism among investors, awaiting stronger signals for a decisive move.
- Support and Resistance Testing: The CMP is near support levels, and the stock may test the ₹763.95 resistance level soon.
Key Indicators and Signals
- Volume Confirmation: A breakout above ₹763.95, supported by high trading volumes, would confirm the Cup with Handle pattern and indicate sustained buying interest.
- Momentum Indicators: Tracking the RSI (Relative Strength Index) and MACD (Moving Average Convergence Divergence) will provide additional insights into the stock’s momentum.
- Volatility Check: Increased volatility near the breakout level could indicate heightened activity and stronger potential for upward movement.
Fundamental Strengths Supporting the Stock
- Diverse Applications: Jindal Stainless caters to a broad range of industries, ensuring stable and diversified revenue streams.
- Capacity and Scalability: The company’s robust production capabilities and focus on expansion provide a strong competitive advantage.
- Focus on Exports: With an increasing share of exports, Jindal Stainless is well-positioned to leverage global demand for high-quality stainless steel.
- Sustainability Practices: The company’s initiatives in sustainable production align with global trends, enhancing its appeal to environmentally conscious clients.
Potential Challenges
- Raw Material Volatility: Fluctuations in the prices of nickel and chromium, key raw materials, could impact profitability.
- Global Competition: The stainless steel market is competitive, with global players vying for market share in premium segments.
- Economic Sensitivity: Demand for stainless steel is closely tied to economic activity in key end-user industries, making it sensitive to slowdowns.
Scenario Analysis
- Bullish Case:
- A breakout above ₹763.95 with significant trading volumes would confirm the Cup with Handle pattern.
- The stock could then target higher resistance levels at ₹800 and ₹850, offering strong short-term upside potential.
- Bearish Case:
- If the stock fails to breach ₹763.95, it could retrace to test support levels near ₹700.
- A sustained decline below ₹700 would invalidate the bullish setup and signal further downside.
- Neutral Case:
- The stock may continue consolidating between ₹700 and ₹763.95, awaiting a catalyst to trigger the next significant move.
Investment Strategy
- For Swing Traders: Watch for a confirmed breakout above ₹763.95 with strong volumes. Enter positions upon confirmation and set a stop-loss near ₹700 to manage risks.
- For Long-Term Investors: Focus on the company’s strong fundamentals, including its growth potential in the stainless steel sector and its increasing global market presence. Accumulating shares during consolidation phases could yield long-term gains.
Volume and Momentum Considerations
Volume is critical in validating breakout patterns. For Jindal Stainless:
- High Volume Breakout: A surge in trading volumes during a move above ₹763.95 would signal strong investor confidence and validate the bullish trend.
- Low Volume Breakout: A breakout without significant volume may lack sustainability and could result in a pullback or extended consolidation.
Momentum indicators, such as RSI and MACD, can help gauge the strength of the stock’s movement. An overbought RSI during the breakout phase may signal strong upward momentum.
Support and Resistance Levels
- Immediate Resistance: ₹763.95 (Breakout Price)
- Next Resistance Levels: ₹800 and ₹850
- Immediate Support: ₹700
- Next Support Levels: ₹680 and ₹650
A decisive move above ₹763.95 could open the path to higher resistance levels, while failure to hold above ₹700 might lead to further downside.
Sectoral Outlook
The stainless steel industry is benefiting from:
- Infrastructure Growth: Increasing infrastructure investments globally, particularly in emerging economies, are driving demand for stainless steel.
- Automotive Sector Recovery: Stainless steel demand in the automotive sector is growing due to its durability and resistance to corrosion.
- Sustainability Trends: The focus on sustainable and recyclable materials is boosting stainless steel’s appeal across industries.
ICICI Bank Limited (ICICIBANK)
ICICI Bank is one of India’s largest private sector banks, renowned for its diverse portfolio of financial products and services. With a strong presence in retail, corporate, and international banking, the bank has consistently delivered robust growth driven by technological innovation and customer-centric strategies. Its operational excellence and expanding digital offerings make it a preferred choice for investors in the financial sector.
Technical Pattern Analysis
- Breakout Price: ₹1,362.35
- Pattern: Flat Base
- CMP: ₹1,297.25
- Change: ₹0.5 (0.0%)
The Flat Base pattern is a bullish consolidation pattern that occurs after a prior uptrend. It is characterized by a narrow trading range over a specific period, indicating a balance between buyers and sellers. The pattern represents a pause in the stock’s upward movement as it gathers momentum for the next potential breakout.
ICICI Bank’s breakout price of ₹1,362.35 serves as a significant resistance level. The CMP of ₹1,297.25 reflects that the stock is consolidating in a tight range, with no significant change in price. This indicates that market participants are awaiting a catalyst to drive the next move.
Current Market Position
The stock is consolidating below its breakout price, signaling a phase of market indecision. Key observations include:
- Flat Momentum: The lack of price change suggests that the stock is in a holding pattern, with neither buyers nor sellers dominating.
- Key Resistance: The breakout price at ₹1,362.35 is a critical level. A breach above this, particularly with strong volumes, would confirm a bullish breakout.
- Support Zone: The stock appears to be finding support near ₹1,290, ensuring that downside risk remains limited in the short term.
Key Indicators and Signals
- Volume Analysis: A breakout above ₹1,362.35 with high trading volumes would confirm the pattern and indicate sustained buying interest.
- Accumulation Phase: Signs of accumulation, such as increased institutional activity or steady buying pressure, would signal growing investor confidence.
- Momentum Indicators: Tracking RSI (Relative Strength Index) and MACD (Moving Average Convergence Divergence) will help gauge whether the stock is gaining strength to break out.
Fundamental Strengths Supporting the Stock
- Strong Financial Performance: ICICI Bank has consistently delivered robust profitability, supported by improving asset quality and higher credit growth.
- Retail and Digital Banking: The bank’s focus on retail banking and digital transformation provides a competitive edge in acquiring and retaining customers.
- Low NPAs: The bank’s declining non-performing assets (NPAs) enhance investor confidence in its credit management practices.
- Sector Leadership: As a leader in India’s banking sector, ICICI Bank benefits from its extensive network and diverse product offerings.
Potential Challenges
- Economic Sensitivity: Banking performance is closely tied to macroeconomic conditions, including GDP growth, inflation, and interest rate cycles.
- Regulatory Risks: Changes in banking regulations or government policies could impact operations and profitability.
- Sector Competition: Intense competition from other private and public sector banks requires constant innovation and customer retention efforts.
Scenario Analysis
- Bullish Case:
- A breakout above ₹1,362.35 with strong volumes would confirm the Flat Base pattern.
- The stock could then target higher resistance levels at ₹1,400 and ₹1,450, offering potential for short-term gains.
- Bearish Case:
- If the stock fails to breach ₹1,362.35 and retraces, it could test support levels near ₹1,290.
- A sustained decline below ₹1,290 would invalidate the bullish setup and indicate further downside potential.
- Neutral Case:
- The stock may continue consolidating between ₹1,290 and ₹1,362.35, awaiting a market catalyst to determine the next move.
Investment Strategy
- For Swing Traders: Monitor the stock for a confirmed breakout above ₹1,362.35 with significant trading volumes. Enter positions upon confirmation and set a stop-loss near ₹1,290 to manage risks.
- For Long-Term Investors: Focus on ICICI Bank’s strong fundamentals and growth potential. Consider accumulating shares during this consolidation phase, as the long-term prospects for the banking sector remain positive.
Volume and Momentum Considerations
Volume is crucial for validating breakout patterns. For ICICI Bank:
- High Volume Breakout: A surge in trading volumes during a move above ₹1,362.35 would signal strong investor interest and confirm the bullish trend.
- Low Volume Breakout: A breakout without significant volume may lack sustainability and could lead to further consolidation.
Momentum indicators, such as RSI and MACD, can provide additional insights into the stock’s trajectory. A rising RSI and positive MACD crossover would signal building momentum.
Support and Resistance Levels
- Immediate Resistance: ₹1,362.35 (Breakout Price)
- Next Resistance Levels: ₹1,400 and ₹1,450
- Immediate Support: ₹1,290
- Next Support Levels: ₹1,250 and ₹1,200
A decisive move above ₹1,362.35 could lead to higher resistance levels, while failure to hold above ₹1,290 might lead to further downside.
Sectoral Outlook
The banking sector in India is poised for growth, supported by:
- Credit Demand: Increased demand for personal loans, home loans, and MSME (Micro, Small, and Medium Enterprises) credit is driving growth.
- Digital Adoption: Banks like ICICI are leveraging digital technologies to enhance efficiency and customer experience.
- Economic Recovery: As the Indian economy continues to recover, the banking sector is benefiting from higher credit growth and lower NPAs.
Gujarat Fluorochemicals Limited (FLUOROCHEM)
Gujarat Fluorochemicals Limited (GFL) is a leading player in the specialty chemicals sector, particularly in the production of fluoropolymers, refrigerants, and other chemical intermediates. With a strong global presence and a focus on high-growth industries such as renewable energy, electric vehicles (EVs), and electronics, the company is well-positioned to benefit from long-term market trends.
Technical Pattern Analysis
- Breakout Price: ₹4,534.75
- Pattern: Cup with Handle
- CMP: ₹4,352.55
- Change: ₹-5.3 (-0.1%)
The Cup with Handle pattern is a bullish formation that indicates consolidation before a potential breakout. The “cup” reflects a period of accumulation after a decline, while the “handle” signals temporary consolidation before a breakout attempt.
For Gujarat Fluorochemicals, the breakout price at ₹4,534.75 serves as a critical resistance level. Despite a minor decline of 0.1%, the stock’s CMP of ₹4,352.55 keeps it within range for a breakout. The handle formation suggests a healthy pause as the stock builds momentum for the next upward move.
Current Market Position
The stock is trading slightly below its breakout price, consolidating within a tight range. Key observations include:
- Close to Resistance: The CMP is near the breakout price, indicating that the stock could soon test this critical level.
- Minor Decline: The slight decline of 0.1% reflects subdued market activity, typical during consolidation phases in the handle pattern.
- Potential for Breakout: The setup suggests that a decisive move above ₹4,534.75, supported by strong volumes, could trigger a bullish rally.
Key Indicators and Signals
- Volume Trends: A breakout above ₹4,534.75 with high trading volumes would validate the Cup with Handle pattern and indicate strong investor confidence.
- Momentum Indicators: Monitoring RSI (Relative Strength Index) and MACD (Moving Average Convergence Divergence) will provide additional insights into the stock’s momentum.
- Support Levels: If the breakout fails, the stock could test immediate support levels near ₹4,300.
Fundamental Strengths Supporting the Stock
- Diverse Applications: Gujarat Fluorochemicals serves high-growth sectors like EVs, semiconductors, and renewable energy, ensuring steady demand for its products.
- Export-Oriented Business: With a significant share of revenue from exports, the company benefits from global demand for specialty chemicals.
- Technological Edge: GFL’s focus on research and development enables it to produce high-performance materials that cater to advanced industries.
- Sustainability Initiatives: The company’s commitment to producing eco-friendly products aligns with global trends, enhancing its market appeal.
Potential Challenges
- Raw Material Volatility: Fluctuations in raw material prices could impact margins, especially in a competitive market.
- Regulatory Risks: Stricter environmental regulations could lead to increased compliance costs or operational restrictions.
- Global Economic Uncertainty: The specialty chemicals sector is sensitive to global economic trends, which could impact export demand.
Scenario Analysis
- Bullish Case:
- A breakout above ₹4,534.75, supported by strong volumes, would confirm the Cup with Handle pattern.
- The stock could then target higher resistance levels at ₹4,700 and ₹5,000, offering significant upside potential.
- Bearish Case:
- If the stock fails to break out and retraces, it may test support levels near ₹4,300.
- A sustained decline below ₹4,300 could invalidate the bullish setup and indicate further downside potential.
- Neutral Case:
- The stock may continue consolidating between ₹4,300 and ₹4,534.75, awaiting a market catalyst to trigger its next significant move.
Investment Strategy
- For Swing Traders: Monitor the stock closely for a breakout above ₹4,534.75 with high trading volumes. Enter positions upon confirmation and set a stop-loss near ₹4,300 to manage risks.
- For Long-Term Investors: Focus on Gujarat Fluorochemicals’ strong fundamentals and growth potential in high-demand sectors. Accumulating shares during consolidation phases could yield long-term gains.
Volume and Momentum Considerations
Volume plays a critical role in validating breakout patterns. For Gujarat Fluorochemicals:
- High Volume Breakout: A surge in trading volumes above ₹4,534.75 would confirm strong buying interest and validate the bullish trend.
- Low Volume Breakout: A breakout without significant volume may lack sustainability and could lead to a pullback or extended consolidation.
Momentum indicators, such as RSI and MACD, can help gauge the strength of the stock’s movement. A rising RSI and positive MACD crossover near the breakout level would signal building momentum.
Support and Resistance Levels
- Immediate Resistance: ₹4,534.75 (Breakout Price)
- Next Resistance Levels: ₹4,700 and ₹5,000
- Immediate Support: ₹4,300
- Next Support Levels: ₹4,200 and ₹4,000
A decisive move above ₹4,534.75 could open the path to higher resistance levels, while failure to hold above ₹4,300 might lead to further downside or consolidation.
Sectoral Outlook
The specialty chemicals industry is poised for growth, driven by:
- High-Demand Applications: Rising demand for fluoropolymers and refrigerants in industries like EVs, semiconductors, and renewable energy supports long-term growth.
- Export Growth: Increasing global demand for high-quality specialty chemicals offers significant opportunities for Indian exporters like Gujarat Fluorochemicals.
- Sustainability Trends: The shift toward eco-friendly products and sustainable manufacturing practices is driving innovation and market share gains.
Apollo Hospitals Enterprise Limited (APOLLOHOSP)
Apollo Hospitals Enterprise Limited is a leading healthcare provider in India, recognized for its expansive network of hospitals, clinics, and pharmacies. The company’s strong focus on healthcare services, medical technology, and digital initiatives makes it a prominent player in the growing healthcare sector. Apollo’s commitment to quality and innovation has earned it a reputation as a trusted brand in healthcare delivery.
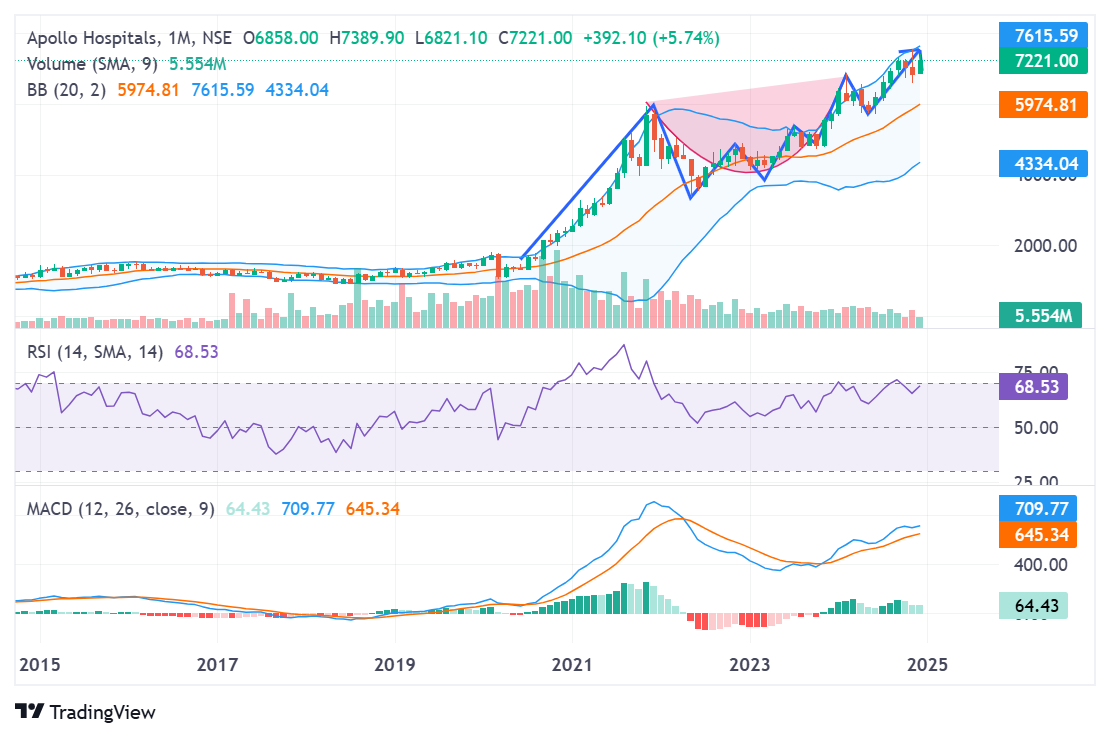
Technical Pattern Analysis
- Breakout Price: ₹7,545
- Pattern: Flat Base
- CMP: ₹7,240.00
- Change: ₹-25.1 (-0.3%)
The Flat Base pattern is a bullish consolidation pattern characterized by price stability within a narrow range. This pattern often emerges after an extended uptrend, signaling that the stock is gathering momentum for its next move.
For Apollo Hospitals, the breakout price of ₹7,545 serves as a critical resistance level. The CMP of ₹7,240.00 reflects a slight decline of 0.3%, indicative of continued consolidation. The pattern suggests stability, and a decisive move above ₹7,545, supported by strong trading volumes, could trigger significant bullish momentum.
Current Market Position
Apollo Hospitals is consolidating below its breakout price, indicating a phase of indecision. Key observations include:
- Narrow Trading Range: The stock is trading in a tight range, which reflects a balance between buyers and sellers.
- Modest Decline: The small 0.3% dip indicates subdued market activity, typical in a Flat Base pattern.
- Awaiting Breakout: The pattern suggests that the stock is building strength to potentially breach the ₹7,545 level.
Key Indicators and Signals
- Volume Analysis: Increased trading volumes during a breakout above ₹7,545 would validate the pattern and indicate strong investor interest.
- Momentum Indicators: RSI (Relative Strength Index) and MACD (Moving Average Convergence Divergence) can provide additional confirmation of momentum building toward a breakout.
- Support Levels: If the breakout fails, the stock could retest support levels near ₹7,000.
Fundamental Strengths Supporting the Stock
- Strong Market Position: Apollo Hospitals is a leader in India’s private healthcare sector, benefiting from its extensive network and trusted brand.
- Diversified Revenue Streams: The company’s operations span hospitals, pharmacies, and diagnostic services, ensuring stable and diversified revenue.
- Digital Transformation: Initiatives like Apollo 24/7 (telemedicine platform) and digital health services enhance customer engagement and operational efficiency.
- Sector Growth: Rising healthcare awareness, increasing lifestyle diseases, and government focus on healthcare infrastructure support long-term growth.
Potential Challenges
- High Operating Costs: The healthcare sector is capital-intensive, with high fixed costs for hospital operations and medical equipment.
- Economic Sensitivity: Demand for private healthcare services can be impacted by broader economic conditions and affordability.
- Regulatory Risks: Changes in healthcare regulations, pricing controls, or government policies could affect margins.
Scenario Analysis
- Bullish Case:
- A breakout above ₹7,545, supported by strong trading volumes, would confirm the Flat Base pattern.
- The stock could then target higher resistance levels at ₹7,800 and ₹8,000, offering potential for short-term gains.
- Bearish Case:
- If the stock fails to breach ₹7,545, it could retrace to test support levels near ₹7,000.
- A sustained decline below ₹7,000 would invalidate the bullish setup and signal further downside potential.
- Neutral Case:
- The stock may continue trading between ₹7,000 and ₹7,545, awaiting a catalyst to determine its next significant move.
Investment Strategy
- For Swing Traders: Monitor the stock for a confirmed breakout above ₹7,545 with significant trading volumes. Enter positions upon confirmation and set a stop-loss near ₹7,000 to manage risks.
- For Long-Term Investors: Focus on Apollo Hospitals’ strong fundamentals and growth potential in India’s healthcare sector. Accumulating shares during this consolidation phase could yield long-term gains.
Volume and Momentum Considerations
Volume plays a crucial role in validating breakout patterns. For Apollo Hospitals:
- High Volume Breakout: A surge in trading volumes during a move above ₹7,545 would confirm strong investor confidence and validate the bullish trend.
- Low Volume Breakout: A breakout without significant volume may lack sustainability and could lead to further consolidation or pullback.
Momentum indicators like RSI and MACD can provide additional insights into the stock’s trajectory. A rising RSI and positive MACD crossover near the breakout level would indicate building momentum.
Support and Resistance Levels
- Immediate Resistance: ₹7,545 (Breakout Price)
- Next Resistance Levels: ₹7,800 and ₹8,000
- Immediate Support: ₹7,000
- Next Support Levels: ₹6,800 and ₹6,500
A decisive move above ₹7,545 could open the path to higher resistance levels, while failure to hold above ₹7,000 might lead to further downside.
Sectoral Outlook
The healthcare sector is poised for robust growth, driven by:
- Increasing Healthcare Awareness: Rising awareness about preventive healthcare and diagnostics supports long-term demand.
- Government Focus on Healthcare: Initiatives like Ayushman Bharat and increased healthcare spending are boosting the private sector’s role in providing quality healthcare services.
- Digital Healthcare Growth: The rapid adoption of telemedicine, online consultations, and remote diagnostics is creating new opportunities for companies like Apollo Hospitals.
Key Insights
- Cup with Handle Patterns Dominate: Many stocks, such as JUBLFOOD, REDINGTON, and SUDARSCHEM, display this pattern, signaling potential bullish setups. Investors should monitor breakout levels closely for confirmation.
- Flat Base Patterns Reflect Consolidation: Stocks like INDIACEM, ICICIBANK, and APOLLOHOSP are consolidating, waiting for catalysts to break resistance levels.
- Sectoral Momentum Varies: While stocks in consumer goods and chemicals show promise, financials and healthcare stocks appear to require further triggers to gain momentum.
- Volume Is Key: A common thread in all patterns is the importance of trading volume. A breakout supported by high volume increases the likelihood of sustained upward trends.
Conclusion
This analysis highlights the importance of recognizing breakout levels and chart patterns to identify potential investment opportunities. Stocks like JUBLFOOD and JINDRILL show promising setups, while others, such as APOLLOHOSP and DRREDDY, are consolidating and may require further catalysts.
Investors should approach these stocks with a mix of technical analysis and fundamental insights, ensuring they monitor market conditions and trading volumes. By aligning strategies with breakout signals and chart patterns, traders can capitalize on opportunities while managing risks effectively.
Summary Table: Breakout Analysis
| Stock Name | Breakout Price | Pattern | CMP | Change | Key Insight |
| Jubilant FoodWorks | ₹713.9 | Cup with Handle | ₹704.15 | +₹12.5 (1.8%) | Close to breakout; positive momentum suggests potential upward movement. |
| India Cements | ₹385 | Flat Base | ₹372.45 | +₹6.2 (1.7%) | Consolidating; slow accumulation indicates potential for breakout. |
| Redington | ₹215.9 | Cup with Handle | ₹208.73 | +₹2.8 (1.4%) | Handle consolidation; watch for strong volume breakout. |
| Sarda Energy | ₹500.95 | Cup with Handle | ₹477.80 | +₹4.2 (0.9%) | Subdued momentum; needs strong volume to break resistance. |
| Dr. Reddy’s | ₹1,421.49 | Consolidation | ₹1,350.90 | +₹9.6 (0.7%) | Balancing buyers and sellers; wait for decisive breakout signal. |
| Sudarshan Chemical | ₹1,174 | Cup with Handle | ₹1,131.95 | +₹7.1 (0.6%) | Consolidating below resistance; breakout could trigger strong upward trend. |
| Apollo Tyres | ₹557 | Cup with Handle | ₹534.80 | +₹2.7 (0.5%) | Consolidation phase; breakout above ₹557 could lead to bullish momentum. |
| Jindal Stainless | ₹763.95 | Cup with Handle | ₹730.05 | +₹2.0 (0.3%) | Handle consolidation; watch for breakout with strong volume. |
| ICICI Bank | ₹1,362.35 | Flat Base | ₹1,297.25 | +₹0.5 (0.0%) | Narrow range; needs market catalysts to test breakout level. |
| Gujarat Fluorochemicals | ₹4,534.75 | Cup with Handle | ₹4,352.55 | -₹5.3 (-0.1%) | Minor decline; still within breakout range; volume confirmation is critical. |
| Apollo Hospitals | ₹7,545 | Flat Base | ₹7,240.00 | -₹25.1 (-0.3%) | Consolidating; breakout could signal bullish momentum, pending volume surge. |
ALSO READ: Top 30 Golden Crossovers: Everything You Need To Know