
The recent price action of BSE (Bombay Stock Exchange) suggests that the stock might have formed a bottom and could be gearing up for a potential rebound. Analyzing the chart along with key technical indicators such as Bollinger Bands, Relative Strength Index (RSI), and the Moving Average Convergence Divergence (MACD), we can draw significant insights into the stock’s possible future direction.
1. Price Action and Pattern Formation
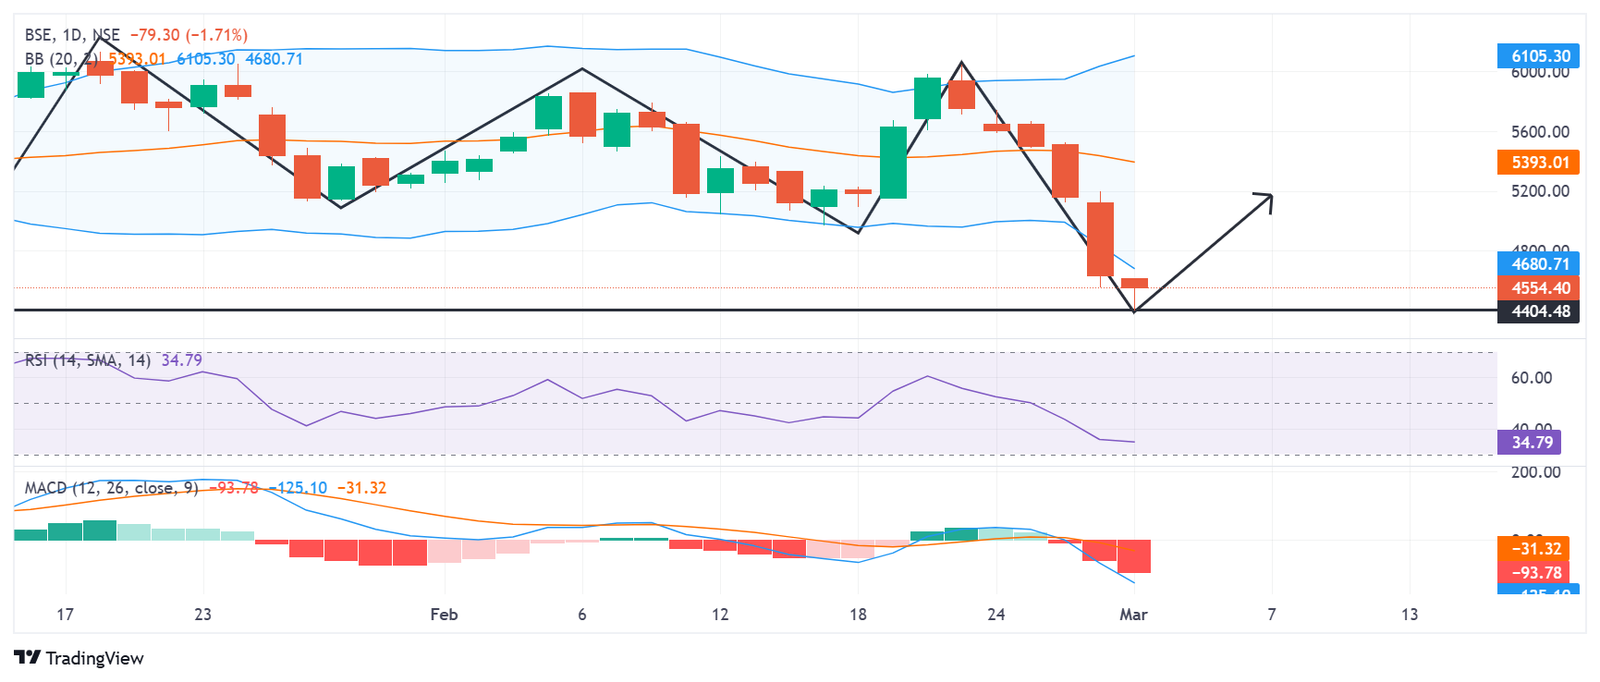
Examining the price structure on the daily chart, we notice that BSE has been in a pronounced downtrend with multiple lower highs and lower lows. However, the recent price movement has formed a potential double-bottom or reversal pattern around the 4404.48 level. This is a critical support zone, as seen from the price rebounding after testing this level multiple times. If this support holds, the likelihood of a price reversal increases significantly.
The downward price movement has been characterized by strong red candles, suggesting intense selling pressure. However, the recent stabilization and the formation of a potential reversal candle near support indicate that bearish momentum could be weakening. This could be a sign of buyers stepping in at this level to accumulate the stock.
2. Bollinger Bands Indicating an Oversold Condition
The Bollinger Bands provide further confirmation that BSE might be at a turning point. The price has reached the lower Bollinger Band, which often signals an oversold condition. Historically, when a stock touches or breaches the lower band, a mean reversion tendency is observed, leading to a bounce back towards the midline (the 20-day moving average). The price is currently far from the upper band, suggesting a reversion could be due soon.
A breakout above the midline resistance near 4680.71 would confirm the start of a potential bullish reversal. Until then, traders should watch for signs of a continuation in selling pressure or further consolidation around the current levels.
3. RSI Showing Signs of Reversal
The Relative Strength Index (RSI), a momentum oscillator that measures the speed and change of price movements, is currently at 34.79, hovering near the oversold threshold of 30. This level suggests that BSE has been under heavy selling pressure, but is now approaching an area where a reversal is likely.
If the RSI turns upwards and crosses the 40-50 level, it would be a strong confirmation of growing bullish momentum. A bullish divergence, where the RSI forms higher lows while the price makes lower lows, would also support a trend reversal hypothesis.
4. MACD Indicating a Potential Shift in Momentum
The Moving Average Convergence Divergence (MACD) indicator is another key tool confirming the likelihood of a bottom. The MACD histogram is deep in negative territory, with the MACD line (-93.78) below the signal line (-31.32), showing strong bearish momentum.
However, one of the earliest signals of a trend reversal would be a crossover where the MACD line crosses above the signal line. If this occurs in the coming sessions, it would serve as a confirmation of an upcoming bullish trend. The histogram also seems to be slowing down its downward momentum, indicating a potential stabilization before a move higher.
5. Support and Resistance Levels
The key levels to watch for BSE are:
- Support: The 4404.48 level is crucial. A decisive break below this level could result in further downside. However, if this support holds, it would act as a strong foundation for an upward move.
- Resistance: The first resistance is around 4554.40, followed by the next major resistance near 4680.71. If the price manages to close above these levels, it would confirm a bullish reversal.
- Long-Term Resistance: The next major resistance above these levels is at 5393.01, which is the mid-Bollinger Band and a psychological barrier.
A breach of these resistance levels, along with confirmation from indicators, could signify a trend reversal in the making.
6. Possible Trading Strategy
Given the current market conditions and the technical indicators discussed, a potential trading approach could be:
- Long Entry: If the price confirms support at 4404.48 and breaks above 4554.40, traders could consider entering long positions.
- Stop Loss: A stop-loss below 4400 would be ideal to limit downside risk.
- Target Levels: The first target would be 4680.71, followed by 5393.01 if the momentum sustains.
- Risk Management: Traders should monitor the RSI and MACD crossovers, as well as price action, to adjust positions accordingly.
Conclusion
BSE appears to be at a crucial juncture, with strong indications of a potential bottom forming. The price action, combined with indicators like RSI, MACD, and Bollinger Bands, suggests that the stock is oversold and might be due for a rebound. However, confirmation through a breakout of resistance levels is required before a full-fledged bullish reversal can be expected.
Traders and investors should keep a close watch on the upcoming sessions for a clear signal. If the bottom holds and key resistance levels are broken, BSE could embark on a recovery rally in the short to medium term. Until then, careful risk management and strategic position sizing are essential.
ALSO READ: Bikaji Foods International Stock Surges 20%: A Detailed Analysis