NLC India Ltd., a significant player in the power generation and lignite mining sector, has recently exhibited promising technical signs of a bullish breakout. With strong institutional interest, rising volumes, favorable momentum indicators, and renewed buying at key moving average supports, the stock appears to be gearing up for a significant uptrend. This article dissects the technical, fundamental, and strategic indicators surrounding this breakout and evaluates whether investors should consider this mid-cap power stock for short- to medium-term opportunities.
Technical Overview:
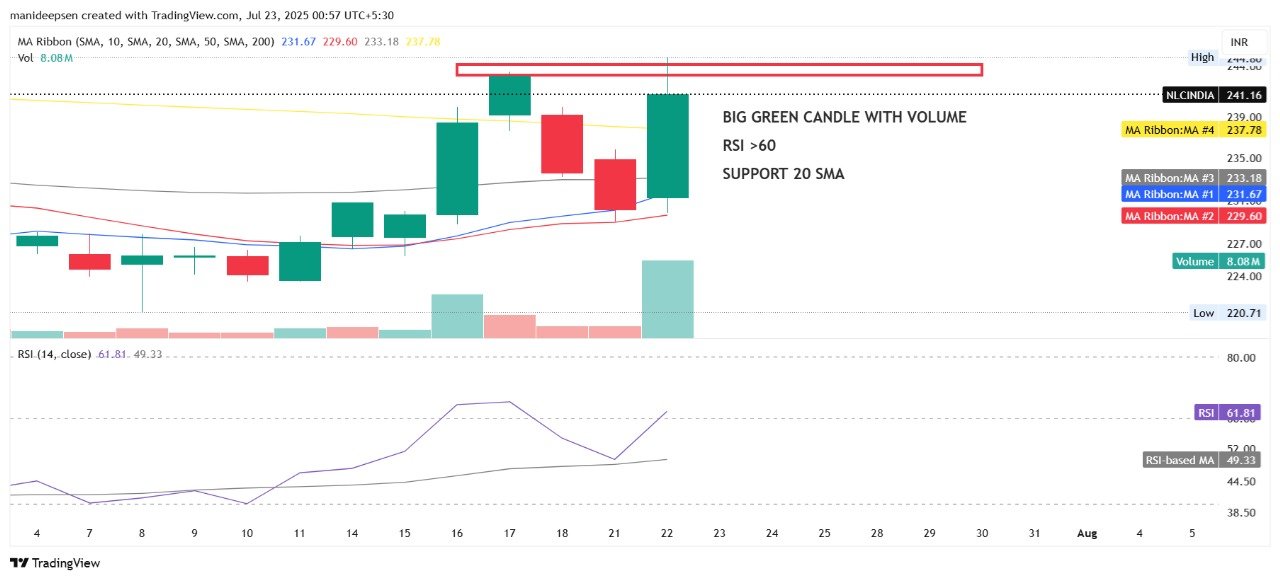
1. Big Green Candle with Volume Spike
The chart clearly displays a large bullish green candle forming on July 22, 2025. This candle comes with a volume of 8.08 million, which is over 4.1 times its 5-day average. A significant increase in delivery volume (2.6 times higher) shows strong participation from institutional and long-term investors rather than just intraday trading activity.
This price movement—an increase of 4.81% closing at ₹241.16—suggests renewed buying interest, especially as the stock reclaims previous resistance levels.
2. Support at 20-Day SMA
NLC India’s price has bounced precisely from the 20-Day Simple Moving Average (SMA) support line. The 20 SMA acts as a dynamic support during short-term trends and indicates that the uptrend is well-supported technically.
The chart displays:
- SMA(20): ₹231.67
- SMA(50): ₹229.60
- SMA(200): ₹237.78
These support levels further confirm that the price is respecting historical zones where demand has emerged.
3. SuperTrend Turns Bullish After 55 Days
The SuperTrend indicator—used to capture trend shifts—has turned to “Buy” at ₹224.35 after 55 days. This is particularly significant as SuperTrend signals are generally considered reliable over swing trading time frames.
A switch from a prolonged bearish signal to a bullish one suggests a high-probability breakout and trend reversal.
4. Crossing Upper Bollinger Band
The stock has closed above the Upper Bollinger Band by 0.9%, indicating strong bullish pressure and possibly the start of a new trend.
Bollinger Band breakouts often signal that volatility is increasing in the direction of the breakout. This breakout, accompanied by volume, confirms market acceptance of higher price levels.
5. RSI (Relative Strength Index) Above 60
The RSI stands at 61.81, breaching the neutral 50-zone and firmly moving toward overbought. Momentum traders watch for RSI above 60 as a sign that the bulls have taken charge.
It’s also worth noting that RSI has bounced from a prior dip around 49, showing renewed buying interest and strength.
Fundamental Snapshot:
- Sector: Power
- Industry: Power Generation/Distribution
- Market Cap: ₹33,446 Cr
- Enterprise Value: ₹55,518 Cr
- P/E (TTM): 12.76
- Industry P/E: 21.29
- Dividend Yield: 1.24%
- Book Value/Share: ₹135.02
- Price to Book: 1.79
- PEG Ratio: 1.04
Valuation Insight: The current P/E ratio of 12.76 is significantly lower than the industry average of 21.29, making NLC India a relatively undervalued power sector play. With a healthy PEG ratio of 1.04, the stock’s earnings growth matches its price level, making it appealing to GARP (Growth at Reasonable Price) investors.
Business Model and Sector Dynamics:
NLC India’s diversified energy portfolio includes:
- Lignite Mining: One of the few integrated companies involved in lignite excavation.
- Thermal Power Generation: Utilizes its lignite resources to fuel power plants.
- Renewable Energy: Expanding presence in solar and wind energy.
NLC India is crucial in supporting India’s push toward energy security while transitioning toward cleaner sources. With rising energy demand, especially in the southern region, NLC is well-placed for long-term relevance.
Performance Comparison:
| Period | NLC India | Nifty 50 | Nifty Energy |
|---|---|---|---|
| 1 Day | +4.81% | -0.12% | -0.14% |
| 3 Months | -1.96% | +3.70% | +4.87% |
| 1 Year | -10.38% | +2.25% | -13.70% |
Despite recent underperformance, the stock’s current bullish move indicates a potential reversal.
Key Bullish Triggers:
- Volume Expansion: Breakout with high delivery.
- Support Reclaim: Bounced from key SMAs.
- Momentum Indicators: RSI and SuperTrend confirm bullish reversal.
- Valuation: Undervalued relative to peers with improving fundamentals.
- Technical Formation: The candle formation indicates a breakout above a consolidation zone.
Risks & Considerations:
- Volatility: A quick move after a long consolidation may lead to pullbacks.
- Sector Headwinds: Regulatory changes and fuel supply constraints may affect margins.
- Resistance Zone: ₹241–₹245 is a minor supply zone marked on the chart. A close above ₹245 with volume is essential for follow-through.
Outlook:
If the stock holds above ₹237.78 (200-day SMA), it is well-positioned to test and potentially break above ₹245 in the coming sessions. Given the support from technical indicators, and improved investor sentiment, the stock may aim for a medium-term target of ₹260–₹275.
Suggested Strategy:
For Traders:
- Entry: Around ₹237–₹241
- Stop-Loss: ₹229
- Target 1: ₹255
- Target 2: ₹270
For Investors:
- Consider staggered entry for long-term exposure to India’s power sector.
- Monitor earnings trajectory and power tariff reforms.
Conclusion:
NLC India Ltd is showing all signs of a bullish revival. From reclaiming key moving averages to RSI entering bullish territory and volumes surging alongside breakout candles, this stock is now back on the radar of momentum traders and swing investors.
While caution is needed around resistance levels, the overall setup favors a continuation of the uptrend. With strong fundamentals, improving technicals, and sector relevance, NLC India stock presents a compelling opportunity in the power generation space.
Investors should keep a close eye on ₹245. A breakout above this with volume could open the door to a fresh leg of rally.
ALSO READ: Eternal Ltd Breaks Out with Bullish Momentum