
Every chart tells a story, and the BEL (Bharat Electronics Limited) chart screams momentum, psychology, and opportunity. When traders dissect the waves, calculate Fibonacci extensions, and track RSI swings, they don’t just see candles. They see human behavior compressed into bars, moving in patterns that repeat because fear and greed never change. Let’s dive into this BEL chart and unfold what the price action wants to tell us.
The Wave Count: A Classic Elliott Setup
The chart marks out a clear Elliott Wave structure. Wave 1 started the upward journey, pushing the stock into a defined trend channel. Wave 2 retraced neatly, respecting the trendline support. Then came Wave 3, the most powerful move, lasting 81 bars across 123 days, and adding nearly 190 points (78.92%). That kind of magnitude fits perfectly with Elliott’s theory—third waves always carry the strongest conviction.
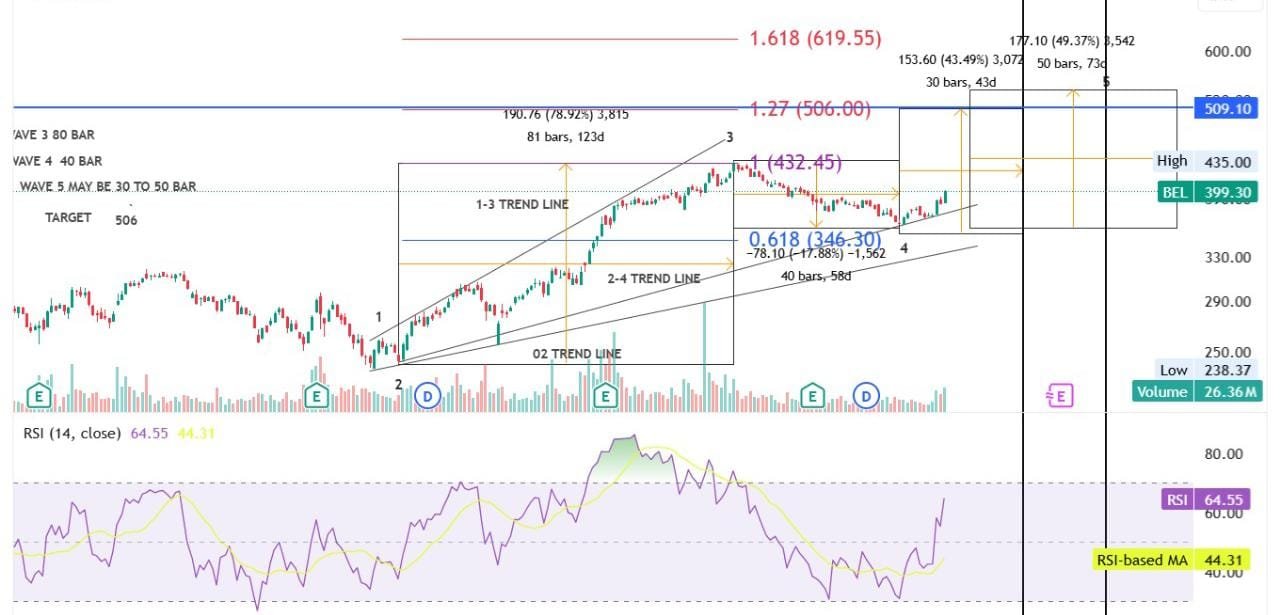
Wave 4 then cooled off the rally. It stretched for 40 bars over 58 days, correcting down to the 0.618 Fibonacci retracement at 346.30. Traders saw that level as a psychological cushion, and the price respected it beautifully. With the correction completed, BEL now gears up for Wave 5, which according to Elliott rules, often spans 30–50 bars. That means the next two months could witness another breakout surge.
The Targets: Fibonacci Extensions Point Higher
Every serious trader watches Fibonacci extensions for targets, and BEL’s chart places two key levels in play:
-
1.27 extension at 506.00 – This level stands out as the most immediate target for Wave 5. The symmetry of Wave 1 and Wave 5 often aligns around this zone.
-
1.618 extension at 619.55 – The long-shot target that excites bulls. If momentum carries through, this becomes the next stop on the highway of price action.
The current price of 399.30 suggests a healthy upside window. From here, a clean breakout toward 509.10 (marked resistance) promises nearly 27% gains. Traders watching volume spikes know such moves rarely happen quietly.
Trendlines: Support and Strength
BEL has carved three guiding trendlines:
-
0–2 trendline anchors the base. As long as candles stay above this, long-term strength remains intact.
-
1–3 trendline acts as a resistance slope. Wave 5 usually attempts to kiss this line before exhaustion.
-
2–4 trendline currently works as support. The recent bounce near this line proves buyers remain committed.
These lines don’t just decorate the chart. They signal zones where institutions place their bets. When price hugs the 2–4 line and bounces, it means smart money quietly accumulates.
RSI Story: Momentum Reset and Rebuild
The Relative Strength Index (RSI) adds another dimension to this setup. It recently touched 64.55, with an RSI-based moving average at 44.31.
Here’s the takeaway:
-
During Wave 3, RSI overheated, marking exhaustion.
-
Wave 4 cooled it down, dropping closer to the mid-40s.
-
Now, RSI builds strength again, signaling renewed buying momentum.
As long as RSI pushes toward 70 without sharp divergences, bulls remain in control. But traders should watch for any bearish divergence once BEL approaches 506.
Volume: The Silent Witness
Charts without volume look incomplete, but here volume speaks clearly. BEL’s correction in Wave 4 happened on shrinking volume, a classic bullish sign. Sellers lacked conviction, while buyers quietly prepared.
Now, the recent bounce carries a tick-up in volume, confirming accumulation. If volume expands during the next breakout above 435, expect fireworks. Without volume, breakouts fail. With it, price tears through resistance like paper.
The Psychological Game: Support and Resistance
Markets move because traders anchor emotions to round numbers. BEL’s chart shows this psychology:
-
High: 435.00 – This zone becomes the immediate battlefront. If BEL conquers it, short-term sellers lose ground.
-
Target: 506.00 – A magnet that attracts buyers once momentum starts. Traders often front-run such levels, pushing prices there faster.
-
Support: 346.30 – As long as BEL holds above this Fibonacci retracement, the bullish thesis remains safe.
These levels act like invisible fences. Break one, and price races to the next.
Time Cycles: Bars and Days Matter
Technical analysis often ignores time, but Elliott emphasized both price and duration. BEL’s chart respects this.
-
Wave 3 lasted 123 days
-
Wave 4 lasted 58 days
-
Wave 5 projection: 30–50 bars
That means traders could expect the current rally to mature between 1.5 and 2.5 months. The alignment of time cycles with price projections increases conviction in the target.
Strategy for Traders
BEL now sits at 399.30, wedged between support and breakout. Traders can design strategies around this chart:
-
Aggressive entry – Buy near current levels with a stop below 346.30. Aim for 506 first, then trail for 619.
-
Conservative entry – Wait for a breakout above 435 with volume confirmation. Ride the momentum toward 509.
-
Swing approach – Accumulate during dips near the 2–4 trendline and scale out as price nears the Fibonacci levels.
Risk management matters here. If BEL breaks below 346, the wave structure collapses, and bulls must exit.
The Bigger Picture: BEL Beyond Charts
BEL doesn’t trade in a vacuum. It belongs to the defense and electronics sector, one of India’s most strategically vital industries. Government contracts, defense spending, and global export opportunities influence its fundamentals. When fundamentals align with bullish charts, trends often sustain longer than expected.
Wave 5 could ride not just technicals, but also headlines. Any order wins or policy announcements could accelerate the move toward 509 and beyond.
Why This Chart Excites Traders
BEL’s chart excites because it combines everything traders crave:
-
A clean Elliott Wave progression
-
Fibonacci levels aligning perfectly
-
RSI momentum building from a cooled-off base
-
Volume starting to support the breakout
-
A clear risk-reward profile
This setup doesn’t come often. Many charts confuse with noise, but BEL whispers clarity for those willing to listen.
The Road Ahead
As BEL moves forward, every candle will test trader psychology. Breakouts challenge patience. Pullbacks test conviction. But the structure remains bullish until proven otherwise.
The immediate road leads to 435, then 506. Beyond that, the dreamers eye 619, where the 1.618 extension lies. Can BEL get there? The answer lies in whether Wave 5 lives up to its Elliott destiny.
One thing remains clear: BEL has ignited interest, and the next 50 bars could script a story worth trading.
Also Read – The dark side of star fund managers: overhyped, underperforming


