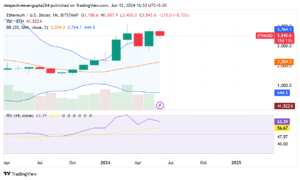
This article provides an in-depth analysis of itcoin (BTCUSD) and Ethereum (ETHUSD) price trends
As of the latest market analysis, both Bitcoin (BTCUSD) and Ethereum (ETHUSD) have shown significant price movements that merit a closer examination. This article provides an in-depth analysis of these price trends, the factors influencing them, and the potential future trajectories based on current technical indicators and market conditions.
Bitcoin Price Analysis
Current Price Movement:
Bitcoin’s price recently bounced bearishly after approaching the $65,485 support line. This bearish bounce led the price to move above the $67,000 barrier, influenced by stochastic positivity.

SOURCE: TREADING VIEW
The stochastic oscillator, a momentum indicator, suggests that Bitcoin might experience short-term price fluctuations due to overbought or oversold conditions.
Technical Indicators:
Support and Resistance Levels: The immediate support level is at $65,485, while the resistance level is around $67,080. The trading range is expected to be between $65,800 and $68,500.
Exponential Moving Average (EMA50): The EMA50, which represents the average price over the past 50 periods, is exerting negative pressure.
This indicates a continuation of the bearish trend, unless there is a significant reversal.
Stochastic Oscillator:
The stochastic oscillator shows positive momentum, suggesting that there might be a short-term bullish correction. However, this positivity could be temporary if the underlying bearish pressure remains dominant.
Bearish Scenario:
Should Bitcoin resume its bearish bias, the initial target would be to test the $65,485 support level. A break below this support could push the price further down to the $60,330 area, representing a significant downside risk.
Bullish Scenario:
Conversely, if Bitcoin consolidates above the $67,080 level, it could invalidate the bearish scenario.
This consolidation would lead to an attempt to regain the main bullish track, potentially driving the price higher in the near term.
Trading Strategy:
Given the current setup, traders might consider short positions targeting the $65,485 support level, with a stop-loss above $67,080 to mitigate risk.
Long positions could be considered if the price consolidates above $67,080, aiming for the $68,500 resistance level.
Ethereum Price Analysis
Current Price Movement:
Ethereum has shown additional negative trades, reaching the thresholds of the $3,400 barrier.
Currently, there is some bullish bias, influenced by stochastic positivity.

This suggests that Ethereum might experience a short-term bullish correction before resuming its bearish trend.
Technical Indicators:
Support and Resistance Levels: The immediate support level is at $3,360.31, while the resistance level is around $3,641.82.
The trading range is expected to be between $3,360.30 and $3,600.00.
Exponential Moving Average (EMA50): The EMA50 is exerting negative pressure on Ethereum, supporting the continuation of the bearish trend unless a significant reversal occurs.
Stochastic Oscillator:
Similar to Bitcoin, the stochastic oscillator for Ethereum indicates positive momentum. This suggests a potential short-term bullish correction.
However, the overall bearish trend might persist due to the negative pressure from the EMA50.
Bearish Scenario:
If Ethereum resumes its negative trades, the next main target would be $3,360.31.
A break below this support level could lead to further declines, increasing the downside risk.
Bullish Scenario:
Breaching the $3,641.82 resistance level would stop the expected decline, potentially leading to a resumption of the main bullish track. This would indicate a significant reversal and provide an opportunity for higher price movements.
Trading Strategy:
Traders might consider short positions targeting the $3,360.31 support level, with a stop-loss above $3,641.82 to manage risk. Long positions could be considered if the price breaks above $3,641.82, aiming for the $3,600 resistance level.
Market Factors Influencing Bitcoin and Ethereum
Several external factors can influence the price movements of Bitcoin and Ethereum, including market sentiment, macroeconomic conditions, regulatory developments, and technological advancements.
Here are some key factors to consider:
1. Market Sentiment:
Investor sentiment plays a crucial role in the cryptocurrency market.
Positive news, such as institutional adoption or favorable regulatory developments, can drive prices higher, while negative news can lead to sharp declines.
2. Macroeconomic Conditions:
Global economic conditions, including inflation rates, interest rates, and monetary policies, can impact the demand for cryptocurrencies.
For example, high inflation can drive investors to seek alternative assets like Bitcoin and Ethereum as a hedge.
3. Regulatory Developments:
Regulatory developments in major markets, such as the United States and the European Union, can significantly impact cryptocurrency prices.
Clear regulatory guidelines can boost investor confidence, while restrictive regulations can dampen market sentiment.
4. Technological Advancements:
Advancements in blockchain technology and the development of new applications can enhance the utility and value of cryptocurrencies.
For example, Ethereum’s transition to Ethereum 2.0, which aims to improve scalability and security, can positively influence its price.
In summary, both Bitcoin and Ethereum are currently experiencing bearish trends, influenced by technical indicators and market conditions.
However, short-term bullish corrections are possible due to stochastic positivity.
Traders should carefully monitor key support and resistance levels and consider external market factors when making trading decisions.
Bitcoin is expected to test the $65,485 support level, with potential downside targets at $60,330 if the bearish trend continues.
Conversely, a consolidation above $67,080 could lead to a resumption of the bullish track.
Similarly, Ethereum is expected to test the $3,360.31 support level, with potential downside risks.
Breaching the $3,641.82 resistance level could lead to a bullish reversal.
By understanding these price dynamics and staying informed about market factors, traders and investors can better navigate the volatile cryptocurrency market and make informed decisions.
As always, it is crucial to conduct thorough research and use risk management strategies when trading cryptocurrencies.
ALSO READ: How Restaking is Revolutionizing Crypto Investments in 2024


