Ethereum (ETH) is currently trading around $2,493, with price oscillations between the upper and lower Bollinger Bands. The 20-day Simple Moving Average (SMA), seen in the middle of the Bollinger Bands, is around $2,500, serving as a short-term reference for traders. This moving average is a key point as Ethereum has been fluctuating above and below it, signaling indecision and a lack of clear directional momentum.
When the price hovers near the moving average, it often indicates a neutral trend, where neither bulls nor bears dominate. For a strong upward or downward move, Ethereum would need a decisive breakout from this SMA level, either towards the upper band (around $2,519) or the lower band (around $2,481).
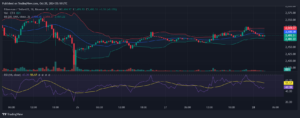
Bollinger Bands Analysis
The Bollinger Bands provide an insight into Ethereum’s volatility. The bands have started to narrow slightly, suggesting reduced volatility compared to previous sessions. This narrowing typically points to a consolidation phase, which could precede a breakout in either direction.
If Ethereum breaks above the upper band at $2,519, it could indicate a bullish momentum with potential for further gains. Conversely, a breakdown below the lower band at $2,481 might suggest bearish momentum, possibly leading to additional losses. Traders often use these bands to identify entry and exit points, especially during low volatility periods like this one.
RSI Analysis
The Relative Strength Index (RSI), a momentum oscillator, currently sits at 47.39, just below the neutral 50 mark. This reading indicates a balance between buying and selling pressures, with a slight inclination towards bearish momentum. The RSI hasn’t reached overbought or oversold conditions, suggesting that Ethereum may continue trading within this range until a stronger trend emerges.
A move above 50 on the RSI could signal the start of a bullish trend, with increased buying interest. On the other hand, a dip below 40 would point to growing selling pressure, signaling potential weakness. Traders should monitor the RSI closely, as any break into extreme territories (above 70 or below 30) could prompt significant price moves.
Volume Profile
Volume data reveals moderate trading activity, with no significant volume spikes to indicate strong interest from buyers or sellers. Generally, higher volume near resistance or support levels strengthens the probability of a breakout. In this case, Ethereum’s volume suggests that traders are waiting for a clearer signal, contributing to the current range-bound movement.
A sudden increase in volume alongside a price move could indicate conviction from market participants, potentially leading to a more sustained trend. Low volume, however, implies that Ethereum may remain within this consolidation phase for the near term.
Price Structure and Potential Patterns
The price structure on this chart shows a series of minor lower highs and higher lows, indicating a symmetrical triangle pattern. This pattern often points to a period of consolidation before a breakout or breakdown. In the case of Ethereum, a break above the $2,519 upper boundary or below the $2,481 lower boundary could signify the next directional move.
This pattern can be favorable for breakout traders, as it often leads to sharp price movements once the consolidation phase concludes. A breakout above the triangle would likely trigger bullish momentum, while a breakdown could result in further declines.
Key Support and Resistance Levels
Ethereum has shown consistent support near the $2,481 level, a price point that has provided stability during minor downtrends. This support level is crucial, as it indicates the point where buyers typically re-enter the market, preventing deeper declines. If Ethereum were to break below this support, it could suggest bearish sentiment with potential for further downside.
On the resistance side, $2,519 serves as a key hurdle. Ethereum has tested this resistance level several times but failed to maintain gains above it. A successful breakout above this resistance could indicate renewed buying interest, with potential upside targets extending to subsequent resistance levels above $2,550.
Moving Average Convergence Divergence (MACD)
Although the MACD is not shown explicitly on this chart, its calculation can add further insight into Ethereum’s momentum. Given the current price movements near the moving average, the MACD line is likely close to its signal line, with little separation. This narrow alignment suggests a lack of strong momentum in either direction.
If the MACD line crosses above the signal line, it could suggest bullish momentum, while a cross below would indicate bearish sentiment. Watching for divergence between the MACD and the price action could also help identify potential trend reversals.
Conclusion and Key Takeaways
Ethereum’s price is currently consolidating between $2,481 support and $2,519 resistance, with price trading close to the middle Bollinger Band. The RSI near 50 and moderate trading volume indicate a neutral stance among traders, as they wait for a clear direction.
A breakout above $2,519 would favor bulls, potentially leading to a retest of higher resistance levels. Conversely, a break below $2,481 could open the door for bearish continuation. Traders should monitor the volume closely, as a volume spike could confirm the breakout or breakdown.
Until Ethereum decisively breaks out of this range, it is likely to remain in a state of consolidation, reflecting market indecision.