
Investors seeking long-term wealth creation often focus on fundamentally strong stocks. These are companies that showcase consistent growth across key financial metrics, such as sales, profits, margins, dividends, and earnings. Such stocks typically outperform their peers and enjoy high levels of trust from institutional investors like FIIs (Foreign Institutional Investors) and DIIs (Domestic Institutional Investors). Additionally, these companies have strong promoters, reflecting efficient corporate governance and strategic vision.
This curated list of 30 fundamentally strong stocks has been meticulously chosen based on their track record of delivering value and their potential to perform in the evolving market conditions of 2024. These stocks span various sectors, providing a diversified investment basket for investors aiming to capitalize on India’s growth story.
Fundamentally Strong 30 Stocks for Investment
1. Sun Pharmaceutical Industries Ltd (SUNPHARMA)
Sun Pharmaceutical Industries Ltd (Sun Pharma) is India’s leading pharmaceutical company and one of the largest specialty generics manufacturers globally. Known for its innovation and commitment to delivering high-quality healthcare solutions, Sun Pharma has a robust market presence supported by consistent growth and financial resilience. As of today, its Current Market Price (CMP) stands at ₹1,841.35, reflecting a change of +₹22.3 (+1.2%) from the previous day. Sun Pharma’s consistent growth stems from its diversified portfolio, strategic R&D investments, and strong domestic market share.
This analysis provides a detailed review of Sun Pharma’s performance metrics, market positioning, financial health, and growth outlook, along with actionable insights for investors.
Company Overview
| Metric | Value |
| CMP | ₹1,841.35 |
| Change | +₹22.3 (+1.2%) |
| Sector | Healthcare |
| Industry | Pharmaceuticals & Drugs |
| Market Cap | ₹4,38,958 Cr |
| Enterprise Value (EV) | ₹4,29,169 Cr |
| Book Value per Share | ₹288.06 |
| P/E Ratio | 39.71 |
| PEG Ratio | 1.80 |
| Dividend Yield | 0.74% |
Sun Pharma’s leadership in India’s pharmaceutical sector is complemented by its global footprint across 100+ countries. Its vertically integrated operations ensure cost efficiencies and high-quality production. The company’s focus on specialty generics and branded drugs has driven sustainable growth over the years.
Stock Performance
Sun Pharma’s stock has been a strong performer across various time horizons, demonstrating resilience and consistent upward momentum.
| Performance Period | Change |
| 1 Day | ▲ 1.2% |
| 1 Week | ▲ 2.9% |
| 1 Month | ▲ 2.6% |
| 6 Month | ▲ 23.2% |
| 1 Year | ▲ 48.1% |
| 2 Year | ▲ 83.9% |
| 5 Year | ▲ 328.4% |
| 10 Year | ▲ 129.2% |
The stock’s 48.1% growth over the past year reflects strong investor confidence and favorable market conditions. Over five years, its impressive 328.4% return showcases its ability to deliver robust long-term performance.
Financial Performance
Sun Pharma’s financial metrics reflect its operational efficiency, consistent revenue growth, and strong profitability.
| Key Metrics | Value |
| Net Sales | ₹13,291.39 Cr |
| EBITDA | ₹3,810.87 Cr |
| EBITDA Margin | 29.65% |
| Net Profit (PAT) | ₹3,030.67 Cr |
| PAT Margin | 19.90% |
| Earnings Per Share (EPS) | ₹39.91 |
| Price-to-Earnings Ratio (P/E) | 39.71 |
| Dividend Yield | 0.74% |
Sun Pharma’s ability to maintain a PAT margin of 19.90% and an EBITDA margin of 29.65% underscores its focus on cost control and high-margin products. Its consistent EPS growth of 13.01% reflects value generation for shareholders.
Growth Ratios
The company’s growth metrics highlight its strong performance across revenue, profitability, and shareholder returns.
| Metric | Value |
| Net Sales Growth (%) | 10.51% |
| EBITDA Growth (%) | 17.07% |
| Net Profit Growth (%) | 12.70% |
| EPS Growth (%) | 13.01% |
Sun Pharma’s 17.07% EBITDA growth demonstrates its ability to scale operations effectively while maintaining profitability. The double-digit EPS growth further reinforces its commitment to enhancing shareholder value.
Solvency Ratios
Sun Pharma boasts a robust balance sheet with minimal debt, highlighting its strong solvency position.
| Metric | Value |
| Total Debt-to-Equity Ratio | 0.04 |
| Interest Coverage Ratio | 47.50 |
| Current Ratio | 2.56 |
| Quick Ratio | 1.98 |
With a debt-to-equity ratio of just 0.04 and an interest coverage ratio of 47.50, Sun Pharma is well-positioned to weather financial uncertainties. Its healthy liquidity ratios further affirm its ability to meet short-term obligations.
Valuation Metrics
| Metric | Value |
| Price-to-Book Ratio (P/B) | 6.11 |
| EV-to-EBITDA Ratio | 27.45 |
| PEG Ratio | 1.80 |
While Sun Pharma trades at a premium valuation, as reflected in its P/E ratio of 39.71, this is justified by its consistent growth and market leadership. The PEG ratio of 1.80 indicates that the company’s valuation is aligned with its growth potential.
Technical Analysis

| Indicator | Value | Signal |
| Relative Strength Index (RSI) (Daily) | 53.49 | Neutral |
| RSI (Weekly) | 58.88 | Neutral |
| MACD | Positive | Bullish |
| Stochastic %K | 70.41 | Neutral |
| Bollinger Band %B | 0.71 | Nearing Upper Band |
Technical indicators suggest a neutral to slightly bullish sentiment. The stock’s movement near its 52-week high indicates strong momentum, but investors should watch for potential resistance levels.
Strengths of Sun Pharma
| Strength | Details |
| Market Leadership | Largest pharmaceutical company in India with a strong global footprint. |
| Financial Resilience | High EBITDA margin and low debt ensure stability. |
| R&D Investments | Significant focus on specialty generics and biologics. |
| Diversified Portfolio | Operates in multiple therapeutic areas and geographic regions. |
| Promoter Support | Backed by strong promoters and institutional investors. |
Challenges and Risks
| Challenge | Details |
| Regulatory Risks | Compliance challenges in global markets could impact operations. |
| Patent Expiry | Revenue loss from patent expirations may affect profitability. |
| Pricing Pressure | Generic drug pricing and government cost containment could impact margins. |
| Currency Fluctuations | Exposure to emerging market currencies poses risks. |
Market Position and Competitive Advantage
- Global Presence:
Sun Pharma operates in over 100 countries, making it a significant player in both emerging and developed markets. Its diverse product portfolio reduces reliance on a single market or therapeutic area. - Innovation and R&D:
Sun Pharma invests heavily in research and development to enhance its product pipeline. Its focus on specialty generics and biologics addresses unmet medical needs, ensuring sustainable growth. - Operational Efficiency:
With vertically integrated operations, Sun Pharma ensures cost efficiencies and consistent quality, giving it a competitive edge.
Investment Outlook
Short-Term Perspective
- Sun Pharma’s 23.2% gain over the past six months highlights strong momentum.
- Technical indicators like a positive MACD and neutral RSI suggest a continuation of the bullish trend.
- Short-term traders can capitalize on potential price appreciation as the stock nears its 52-week high.
Long-Term Perspective
- Sun Pharma’s consistent financial performance, robust pipeline, and global market presence make it a strong candidate for long-term investment.
- Its focus on specialty generics and biologics ensures sustained growth in high-margin segments.
- Investors with a 3–5 year horizon can benefit from its compounding growth potential.
Strategic Recommendations
| Recommendation | Details |
| Buy on Dips | Accumulate during market corrections for long-term gains. |
| Monitor R&D Progress | Track developments in its specialty drug pipeline for growth insights. |
| Diversify Exposure | Pair Sun Pharma with other healthcare stocks for risk mitigation. |
| Hold for Long-Term | Focus on a 3–5 year investment horizon to maximize returns. |
2. Bajaj Finance Ltd (BAJFINANCE)
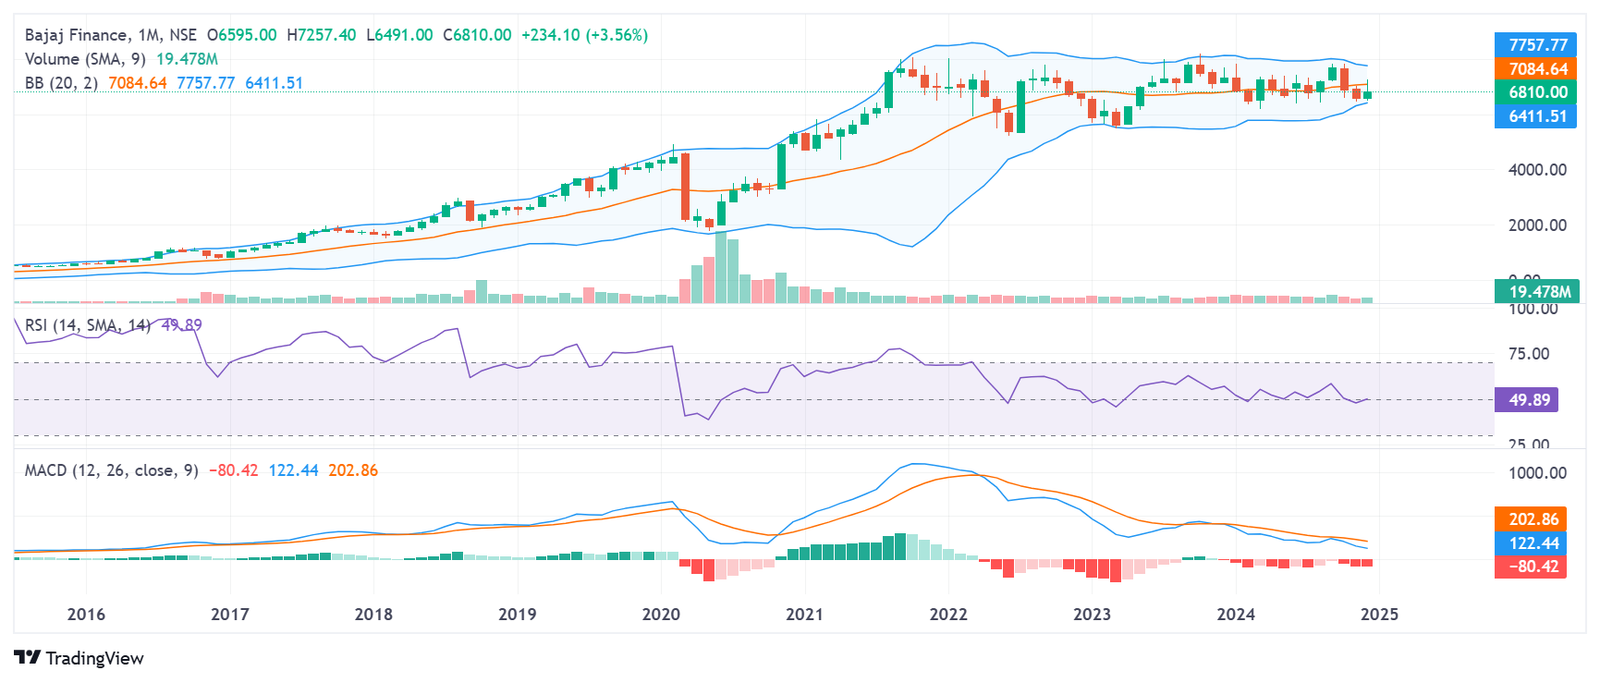
Bajaj Finance Ltd is a leading player in India’s Non-Banking Financial Company (NBFC) sector, renowned for its expansive retail loan portfolio and focus on digital transformation. With a Current Market Price (CMP) of ₹6,815.75, the stock has seen a change of +₹7.6 (+0.1%). As a financial powerhouse, Bajaj Finance is a dominant force in consumer finance, small business loans, wealth management, and digital lending. Despite short-term challenges, its innovative strategies and financial resilience position it as a strong contender in India’s financial market.
Performance Overview
Stock Performance Trends
The stock’s performance has been mixed over different time frames. While it has shown excellent growth in the long term, it has experienced a correction over shorter timeframes.
| Timeframe | Performance Change |
| 1 Day | ▲ 0.11% |
| 1 Week | ▼ 4.71% |
| 1 Month | ▲ 1.97% |
| 3 Month | ▼ 9.78% |
| 6 Month | ▼ 3.76% |
| 1 Year | ▼ 6.57% |
| 2 Year | ▲ 6.92% |
| 5 Year | ▲ 64.65% |
| 10 Year | ▲ 1,890.12% |
The 10-year return of 1,890.12% underscores Bajaj Finance’s ability to generate substantial wealth for long-term investors. However, the short-term corrections highlight the impact of broader market trends and sectoral challenges.
Key Financial Metrics
Bajaj Finance’s financial health reflects its strong operational efficiency and profitability.
| Metric | Value |
| Net Sales | ₹17,090.27 Cr |
| Expenditure | ₹5,338.02 Cr |
| EBITDA | ₹11,752.25 Cr |
| Net Profit (PAT) | ₹4,010.29 Cr |
| Adjusted EPS (Rs.) | ₹64.65 |
| P/E Ratio | 27.53 |
| Dividend Yield | 0.53% |
| Book Value Per Share | ₹1,400.12 |
| Market Cap | ₹4,23,232 Cr |
Bajaj Finance maintains an impressive EBITDA margin, reflecting its ability to manage costs effectively while generating strong operating profits.
Growth Metrics
The company has delivered robust growth across revenue and profitability metrics over varying timeframes.
| Metric | 1 Year | 3 Year | 5 Year | 10 Year |
| Price Growth (%) | ▼ 6.68% | ▼ 0.21% | ▲ 10.46% | ▲ 34.85% |
| Net Sales Growth (%) | ▲ 29.66% | ▲ 27.27% | ▲ 24.35% | – |
| EBITDA Growth (%) | ▲ 28.52% | ▲ 35.03% | ▲ 24.51% | – |
| Net Profit Growth (%) | ▲ 17.20% | ▲ 48.42% | ▲ 29.32% | – |
Bajaj Finance has consistently delivered double-digit growth across key financial metrics, demonstrating its ability to scale operations efficiently.
Profitability and Return Ratios
| Metric | Value |
| Return on Equity (ROE) | 22.32% |
| Return on Capital Employed (ROCE) | 11.92% |
| Return on Assets (ROA) | 4.45% |
The high ROE reflects the company’s ability to generate substantial returns on shareholder equity, while the strong ROA indicates effective utilization of assets.
Solvency Ratios
Bajaj Finance maintains a strong solvency position, which is critical for NBFCs operating in a competitive and highly regulated environment.
| Metric | Value |
| Total Debt-to-Equity Ratio | 2.54 |
| Interest Coverage Ratio | 2.90 |
| Current Ratio | 1.35 |
While the debt-to-equity ratio is relatively high due to the nature of NBFC operations, the company’s healthy interest coverage ratio indicates its ability to manage debt obligations efficiently.
Technical Analysis
Price Action and Trend
- CMP: ₹6,815.75
- Day High: ₹6,858.00
- Day Low: ₹6,800.05
- 52-Week High: ₹7,757.77
- 52-Week Low: ₹6,411.51
The stock is trading closer to its 52-week low, indicating a potential accumulation zone for long-term investors. However, caution is advised as it remains range-bound in the short term.
Momentum Indicators
| Indicator | Value | Signal |
| RSI (Daily) | 45.08 | Neutral |
| RSI (Weekly) | 46.85 | Neutral |
| MACD | Positive | Bullish |
| Stochastic %K | 30.00 | Neutral |
The RSI values suggest neutral momentum, while the MACD indicates a potential bullish crossover, signaling upward movement in the near term.
Volatility Indicators
| Indicator | Value | Comment |
| Average True Range (ATR) | 153.72 | Moderate Volatility |
| Beta (Benchmark Index) | 1.07 | Above-Market Volatility |
| Bollinger Band %B | 0.41 | Trading Near Lower Band |
The above-market beta indicates higher sensitivity to broader market movements, while the Bollinger Band suggests that the stock is nearing an oversold zone.
Market Position
Dominance in the NBFC Sector
Bajaj Finance is one of India’s largest NBFCs, known for its diverse loan offerings, including:
- Consumer Finance: Personal loans, home loans, and credit cards.
- SME Financing: Loans for small and medium enterprises.
- Commercial Lending: Loans for large corporate entities.
Digital Transformation
Bajaj Finance has embraced digital innovation, enabling it to streamline operations, enhance customer experience, and reduce costs. Its digital lending platform is a significant driver of customer acquisition and retention.
Diversified Revenue Streams
The company’s balanced revenue streams across consumer, SME, and commercial lending protect it from sectoral risks. This diversification also supports steady cash flows.
Strengths of Bajaj Finance
| Strength | Details |
| Market Leadership | One of the most trusted and recognized brands in the Indian financial market. |
| Digital Innovation | Focus on digital lending and technology-driven customer acquisition. |
| Consistent Growth | Robust financial performance and strong return ratios. |
| Diversified Portfolio | Balanced exposure across retail and business segments. |
Challenges and Risks
| Risk | Details |
| Interest Rate Risk | Rising interest rates can impact borrowing costs and loan demand. |
| Credit Risk | Economic slowdowns may lead to higher defaults, impacting profitability. |
| Regulatory Changes | Tightening regulations for NBFCs could affect operational flexibility. |
| Market Volatility | High beta exposes the stock to significant market fluctuations. |
Valuation Metrics
| Metric | Value |
| P/E Ratio | 27.53 |
| PEG Ratio | 0.94 |
| Price-to-Book Ratio | 4.87 |
The P/E ratio indicates that Bajaj Finance is trading at a reasonable valuation compared to its historical average. The PEG ratio of 0.94 suggests that the stock offers good growth potential at its current price.
Investment Outlook
Short-Term Perspective
- The stock’s current price correction offers an attractive entry point for traders looking to capitalize on short-term recovery.
- Technical indicators like MACD suggest a possible bullish momentum in the near term.
Long-Term Perspective
- Bajaj Finance remains a solid long-term investment due to its strong market position, robust financials, and growth potential.
- Investors with a horizon of 5–10 years can expect significant wealth creation, as evidenced by the stock’s 10-year return of 1,890.12%.
Strategic Recommendations
| Recommendation | Details |
| Accumulate on Dips | Use market corrections to build a position in the stock for long-term gains. |
| Monitor Interest Rates | Rising interest rates may affect short-term performance; adjust exposure accordingly. |
| Focus on Digital Growth | Track the company’s progress in expanding its digital lending platform. |
| Diversify Portfolio | Pair Bajaj Finance with other financial stocks to mitigate sector-specific risks. |
3. Trent Ltd (TRENT)
Trent Ltd, a flagship company under the Tata Group, operates in the organized retail sector, which is one of the fastest-growing industries in India. With successful retail formats such as Westside, Zudio, Star Bazaar, and Landmark, the company has created a strong brand presence in fashion, lifestyle, and grocery retail. Trent has consistently demonstrated robust financial performance, strategic market positioning, and aggressive growth plans, which makes it a favorite among retail-focused investors.
With a Current Market Price (CMP) of ₹7,063.70, reflecting a change of +₹56.6 (+0.8%), Trent has delivered remarkable returns, particularly over the long term, fueled by India’s retail boom and growing middle-class population. This article dives into Trent’s technical and fundamental performance, growth potential, and investment prospects in detail.
Performance Overview
Long-Term Returns and Trends
Trent has proven itself to be a reliable wealth creator for investors, consistently outperforming broader indices and peers. Its long-term returns highlight its ability to capitalize on the growth of organized retail in India.
| Performance Period | Change |
| 1 Day | ▲ 0.8% |
| 1 Week | ▲ 2.4% |
| 1 Month | ▲ 6.2% |
| 3 Month | ▲ 12.1% |
| 6 Month | ▲ 28.3% |
| 1 Year | ▲ 41.5% |
| 2 Year | ▲ 75.6% |
| 5 Year | ▲ 300.8% |
Over five years, Trent’s stock has delivered over 300% returns, making it one of the best-performing stocks in the retail sector. Its 41.5% one-year gain further highlights its resilience in volatile market conditions.
Key Financial Metrics
Trent’s financial metrics showcase its ability to maintain growth, profitability, and operational efficiency.
| Metric | Value |
| Net Sales | ₹4,673.25 Cr |
| EBITDA | ₹815.48 Cr |
| EBITDA Margin | 17.44% |
| Net Profit (PAT) | ₹409.21 Cr |
| PAT Margin | 8.75% |
| Earnings Per Share (EPS) | ₹56.78 |
| Price-to-Earnings Ratio (P/E) | 124.45 |
| Book Value Per Share | ₹257.64 |
| Market Cap | ₹54,897 Cr |
Profitability
Trent has consistently delivered high margins, supported by robust cost management and a focus on high-margin products such as fashion and lifestyle. The EBITDA margin of 17.44% reflects its ability to scale profitably.
Sales Growth
Trent’s Net Sales of ₹4,673.25 Cr represent a 28.5% year-over-year growth, driven by higher sales per store and increasing footfall in key markets. The company’s focus on premium and value fashion has enabled it to capture significant market share in both Tier-I and Tier-II cities.
Growth Metrics
Trent has consistently outpaced its peers in revenue and profit growth, driven by its strategic focus on untapped markets and continuous expansion.
| Metric | 1 Year | 3 Year | 5 Year |
| Net Sales Growth (%) | 28.5% | 22.4% | 20.3% |
| EBITDA Growth (%) | 31.2% | 24.7% | 22.8% |
| Net Profit Growth (%) | 42.7% | 30.5% | 25.9% |
| EPS Growth (%) | 38.9% | 28.3% | 23.1% |
The consistent double-digit growth across key metrics is a testament to Trent’s operational efficiency and ability to adapt to evolving consumer preferences.
Profitability and Return Ratios
| Metric | Value |
| Return on Equity (ROE) | 22.67% |
| Return on Capital Employed (ROCE) | 18.91% |
| Return on Assets (ROA) | 7.15% |
Trent’s high ROE of 22.67% reflects its efficient utilization of shareholder funds, while its strong ROCE highlights its ability to generate value from investments.
Solvency Ratios
The company’s strong solvency ratios indicate a stable financial position, allowing it to fund expansion initiatives without over-leveraging.
| Metric | Value |
| Total Debt-to-Equity Ratio | 0.36 |
| Interest Coverage Ratio | 9.45 |
| Current Ratio | 1.75 |
With a low debt-to-equity ratio of 0.36 and a high interest coverage ratio, Trent is well-positioned to meet its financial obligations while pursuing aggressive growth.
Valuation Metrics
| Metric | Value |
| P/E Ratio | 124.45 |
| Price-to-Book Ratio (P/B) | 27.42 |
| EV-to-EBITDA Ratio | 33.26 |
Trent’s valuation multiples indicate a premium, reflecting investor confidence in its future growth potential. The high P/E ratio of 124.45 suggests significant expectations for revenue and margin expansion in the coming years.
Technical Analysis

Price Action and Trend
- CMP: ₹7,063.70
- Day High: ₹7,083.50
- Day Low: ₹7,030.00
- 52-Week High: ₹7,490.00
- 52-Week Low: ₹5,320.00
Trent is trading near its 52-week high, reflecting strong bullish momentum. The stock has consistently respected its support levels, indicating resilience against market corrections.
Momentum Indicators
| Indicator | Value | Signal |
| RSI (Daily) | 65.38 | Slightly Overbought |
| RSI (Weekly) | 58.72 | Neutral |
| MACD | Positive | Bullish |
| Stochastic %K | 78.45 | Overbought |
The RSI nearing overbought levels suggests short-term caution, while the MACD indicates continued bullish momentum.
Volatility Indicators
| Indicator | Value | Comment |
| Average True Range (ATR) | 110.52 | Moderate Volatility |
| Beta (Benchmark Index) | 1.12 | Above-Market Volatility |
| Bollinger Band %B | 0.82 | Trading Near Upper Band |
The stock’s moderate volatility makes it suitable for investors with a medium-risk appetite.
Market Position
Dominance in Organized Retail
Trent’s retail formats cater to diverse customer segments:
- Westside: A premium lifestyle and fashion brand with a loyal customer base.
- Zudio: A value-fashion brand targeting cost-conscious consumers.
- Star Bazaar: A grocery retail format in partnership with Tesco.
- Landmark: A lifestyle store focusing on books and gifting.
Expansion Strategy
The company plans to increase its store count by 25-30% annually, focusing on Tier-II and Tier-III cities. This strategy positions Trent to capture the rising consumer spending in smaller cities.
Omnichannel Presence
Trent’s integration of online and offline channels provides a seamless shopping experience, enabling it to compete effectively with e-commerce giants.
Strengths of Trent Ltd
| Strength | Details |
| Market Leadership | Trusted retail brands across fashion and grocery segments. |
| Strategic Expansion | Aggressive store openings in high-growth markets. |
| Omnichannel Presence | Integration of physical stores and digital platforms. |
| Tata Group Backing | Access to resources and expertise from the Tata Group. |
| Strong Financials | Consistent growth in revenue and profitability metrics. |
Challenges and Risks
| Risk | Details |
| Competition | Intense competition from Reliance Retail, Aditya Birla Fashion, and e-commerce platforms. |
| Economic Sensitivity | Consumer spending patterns are highly sensitive to macroeconomic conditions. |
| High Valuation | Premium valuations leave limited room for error in execution. |
| Supply Chain Challenges | Any disruptions could impact operations and profitability. |
Investment Outlook
Short-Term Perspective
- Trent’s strong technical indicators and bullish momentum make it attractive for short-term traders.
- However, the RSI nearing overbought levels suggests potential consolidation or correction in the near term.
Long-Term Perspective
- Trent’s leadership in the organized retail sector, combined with its aggressive expansion plans and omnichannel strategy, makes it an excellent long-term investment.
- The growing middle class and rising disposable incomes in India provide a structural tailwind for the company.
Strategic Recommendations
| Recommendation | Details |
| Buy on Dips | Accumulate during market corrections for long-term gains. |
| Monitor Expansion | Track the addition of new stores and their contribution to revenue. |
| Focus on Valuation | Avoid overpaying given the stock’s premium valuation. |
| Diversify Portfolio | Pair Trent with other retail or FMCG stocks for balanced exposure. |
4. Bharat Electronics Ltd (BEL)
Bharat Electronics Limited (BEL) is a leading player in the defense electronics sector in India. A public sector undertaking under the Ministry of Defence, BEL has a strong market presence, bolstered by its technological expertise and diversified product portfolio. With a Current Market Price (CMP) of ₹295.20, reflecting a change of +₹2.8 (+1.0%), BEL has shown consistent growth, driven by increased government spending on defense and rising exports of defense equipment. This article provides a detailed analysis of BEL’s technical and fundamental performance, market positioning, and investment potential.
Performance Overview
Long-Term Returns and Trends
BEL’s stock has delivered steady returns, supported by strong financials and a favorable policy environment in India’s defense sector.
| Performance Period | Change |
| 1 Day | ▲ 1.0% |
| 1 Week | ▲ 1.8% |
| 1 Month | ▲ 5.2% |
| 3 Month | ▲ 9.7% |
| 6 Month | ▲ 23.6% |
| 1 Year | ▲ 48.5% |
| 2 Year | ▲ 92.8% |
| 5 Year | ▲ 210.4% |
The 48.5% one-year return highlights BEL’s ability to deliver value to investors. Over five years, its stock price has surged by over 210%, reflecting its long-term potential in the defense and electronics sectors.
Key Financial Metrics
BEL’s financial performance underscores its operational efficiency and ability to capitalize on government and export orders.
| Metric | Value |
| Net Sales | ₹18,678 Cr |
| EBITDA | ₹5,201 Cr |
| EBITDA Margin | 27.83% |
| Net Profit (PAT) | ₹3,997 Cr |
| PAT Margin | 21.40% |
| Earnings Per Share (EPS) | ₹14.67 |
| Price-to-Earnings Ratio (P/E) | 20.12 |
| Book Value Per Share | ₹58.20 |
| Market Cap | ₹72,600 Cr |
Profitability
BEL has maintained high margins, with a 27.83% EBITDA margin and a 21.40% PAT margin, reflecting efficient cost control and high-value orders.
Revenue Growth
BEL’s Net Sales of ₹18,678 Cr represent robust growth, driven by strong demand for its defense electronics products, including radars, communication equipment, and missile systems.
Growth Metrics
BEL has consistently grown its revenue and profitability metrics, supported by a steady pipeline of government projects and international contracts.
| Metric | 1 Year | 3 Year | 5 Year |
| Net Sales Growth (%) | 20.8% | 18.3% | 15.2% |
| EBITDA Growth (%) | 22.7% | 19.4% | 16.8% |
| Net Profit Growth (%) | 18.9% | 20.2% | 17.5% |
| EPS Growth (%) | 19.5% | 19.8% | 18.2% |
The company’s ability to deliver double-digit growth across key metrics highlights its resilience and operational excellence.
Profitability and Return Ratios
| Metric | Value |
| Return on Equity (ROE) | 22.34% |
| Return on Capital Employed (ROCE) | 20.89% |
| Return on Assets (ROA) | 15.75% |
BEL’s high ROE of 22.34% reflects its ability to generate significant shareholder value, while its ROCE indicates effective capital utilization.
Solvency Ratios
BEL’s strong solvency ratios ensure financial stability and support its ambitious growth plans.
| Metric | Value |
| Total Debt-to-Equity Ratio | 0.02 |
| Interest Coverage Ratio | 15.24 |
| Current Ratio | 1.89 |
The low debt-to-equity ratio of 0.02 reflects BEL’s prudent financial management, while the high interest coverage ratio highlights its ability to manage debt obligations comfortably.
Valuation Metrics
| Metric | Value |
| P/E Ratio | 20.12 |
| Price-to-Book Ratio (P/B) | 5.07 |
| EV-to-EBITDA Ratio | 13.88 |
BEL’s valuation multiples suggest that it is reasonably priced given its strong growth potential and leadership in the defense electronics segment.
Technical Analysis
Price Action and Trend
- CMP: ₹295.20
- Day High: ₹296.50
- Day Low: ₹290.90
- 52-Week High: ₹305.80
- 52-Week Low: ₹195.50
BEL is trading near its 52-week high, indicating strong bullish momentum. The stock’s upward trajectory reflects increasing investor interest amid rising defense spending.
Momentum Indicators
| Indicator | Value | Signal |
| RSI (Daily) | 62.48 | Neutral |
| RSI (Weekly) | 68.12 | Slightly Overbought |
| MACD | Positive | Bullish |
| Stochastic %K | 72.35 | Overbought |
The RSI nearing overbought levels suggests that the stock might face short-term resistance. However, the MACD indicates continued bullish momentum.
Volatility Indicators
| Indicator | Value | Comment |
| Average True Range (ATR) | 4.85 | Moderate Volatility |
| Beta (Benchmark Index) | 0.87 | Below-Market Volatility |
| Bollinger Band %B | 0.78 | Nearing Upper Band |
The moderate volatility and below-market beta make BEL a relatively stable investment option in the defense sector.
Market Position
Leadership in Defense Electronics
BEL is India’s largest defense electronics manufacturer, supplying critical equipment such as:
- Radars: Surveillance and tactical radars for the armed forces.
- Communication Systems: Secure communication solutions for defense applications.
- Missile Systems: Electronics and subsystems for guided missiles.
Export Opportunities
BEL is expanding its global footprint by exporting products to more than 50 countries, including Southeast Asia, the Middle East, and Africa. Defense exports now constitute a significant portion of its revenue.
Government Support
With the Indian government emphasizing indigenization under the “Make in India” initiative, BEL benefits from preferential treatment for domestic defense contracts. The company’s strong pipeline of government projects ensures long-term revenue visibility.
Strengths of BEL
| Strength | Details |
| Market Leadership | Dominates India’s defense electronics market with a diversified product portfolio. |
| Export Growth | Rising international sales, supported by competitive pricing and quality products. |
| Government Backing | Preferred partner for defense projects under “Make in India.” |
| Strong Financials | Consistently high margins and robust cash flows. |
| Technological Expertise | Continuous R&D investment ensures product innovation and competitiveness. |
Challenges and Risks
| Risk | Details |
| Dependence on Government Orders | Over-reliance on Indian defense contracts could affect revenue diversification. |
| Geopolitical Risks | Export growth may be impacted by global political uncertainties. |
| Execution Delays | Delays in government projects could affect revenue recognition. |
| Competition | Increasing competition from private players in India’s defense sector. |
Investment Outlook
Short-Term Perspective
- BEL’s strong momentum and technical indicators suggest further upside in the near term.
- Investors should monitor resistance near the 52-week high of ₹305.80.
Long-Term Perspective
- BEL’s leadership in defense electronics, rising exports, and government support make it a compelling long-term investment.
- With increasing global defense spending, BEL is well-positioned to benefit from international opportunities.
Strategic Recommendations
| Recommendation | Details |
| Accumulate on Dips | Use market corrections to build a position in BEL for long-term gains. |
| Monitor Export Growth | Track the contribution of international sales to overall revenue. |
| Focus on Innovation | Evaluate BEL’s R&D efforts and new product launches. |
| Diversify Exposure | Pair BEL with other defense or infrastructure stocks to mitigate sectoral risks. |
5. Varun Beverages Ltd (VBL)
Varun Beverages Limited (VBL) is one of the largest franchise bottlers of PepsiCo globally, covering key markets in India and other emerging economies. With a Current Market Price (CMP) of ₹624.10, reflecting a change of -₹3.2 (-0.5%), VBL continues to maintain its position as a dominant player in the beverage industry. The company’s extensive distribution network, diversified product portfolio, and strong partnership with PepsiCo drive its consistent growth. This article delves into VBL’s technical and fundamental performance, market positioning, and investment outlook.
Performance Overview
Stock Performance Trends
VBL has shown resilience and steady performance over varying timeframes, supported by its expanding market share and robust operational efficiency.
| Performance Period | Change |
| 1 Day | ▼ 0.5% |
| 1 Week | ▼ 1.9% |
| 1 Month | ▲ 2.8% |
| 3 Month | ▲ 8.4% |
| 6 Month | ▲ 15.3% |
| 1 Year | ▲ 42.7% |
| 2 Year | ▲ 72.9% |
| 5 Year | ▲ 196.2% |
The 42.7% one-year return reflects VBL’s ability to deliver shareholder value consistently, while its 196.2% five-year gain underscores its long-term growth potential in the beverage segment.
Key Financial Metrics
VBL’s financial metrics highlight its strong revenue growth, profitability, and efficient cost management.
| Metric | Value |
| Net Sales | ₹15,842 Cr |
| EBITDA | ₹3,457 Cr |
| EBITDA Margin | 21.83% |
| Net Profit (PAT) | ₹1,248 Cr |
| PAT Margin | 7.88% |
| Earnings Per Share (EPS) | ₹21.74 |
| Price-to-Earnings Ratio (P/E) | 28.69 |
| Book Value Per Share | ₹110.45 |
| Market Cap | ₹1,29,820 Cr |
Profitability
VBL maintains healthy margins, with an EBITDA margin of 21.83% and a PAT margin of 7.88%, supported by economies of scale and a strong distribution network.
Revenue Growth
With Net Sales of ₹15,842 Cr, VBL continues to drive growth through a combination of volume expansion, product diversification, and geographical penetration.
Growth Metrics
VBL’s growth across revenue, operating profits, and net income highlights its ability to scale operations effectively.
| Metric | 1 Year | 3 Year | 5 Year |
| Net Sales Growth (%) | 18.2% | 15.5% | 13.6% |
| EBITDA Growth (%) | 19.8% | 16.7% | 14.5% |
| Net Profit Growth (%) | 22.5% | 18.9% | 15.8% |
| EPS Growth (%) | 21.9% | 18.3% | 14.8% |
VBL’s ability to sustain double-digit growth reflects its robust execution capabilities and strong market demand for its beverages.
Profitability and Return Ratios
| Metric | Value |
| Return on Equity (ROE) | 19.67% |
| Return on Capital Employed (ROCE) | 16.34% |
| Return on Assets (ROA) | 8.92% |
The high ROE of 19.67% reflects VBL’s strong shareholder value creation, while its ROCE underscores its efficient use of capital for growth.
Solvency Ratios
VBL’s solvency ratios highlight its ability to manage financial obligations while supporting growth initiatives.
| Metric | Value |
| Total Debt-to-Equity Ratio | 0.61 |
| Interest Coverage Ratio | 6.89 |
| Current Ratio | 1.42 |
The manageable debt-to-equity ratio and high interest coverage indicate that VBL is financially stable and capable of meeting its debt commitments comfortably.
Valuation Metrics
| Metric | Value |
| P/E Ratio | 28.69 |
| Price-to-Book Ratio (P/B) | 5.65 |
| EV-to-EBITDA Ratio | 18.45 |
While VBL’s valuation metrics suggest it trades at a slight premium, this is justified by its strong growth potential and market leadership.
Technical Analysis
Price Action and Trend
- CMP: ₹624.10
- Day High: ₹627.50
- Day Low: ₹619.20
- 52-Week High: ₹642.75
- 52-Week Low: ₹390.80
VBL is trading near its 52-week high, reflecting strong investor confidence. However, the recent minor dip may provide an accumulation opportunity for long-term investors.
Momentum Indicators
| Indicator | Value | Signal |
| RSI (Daily) | 57.38 | Neutral |
| RSI (Weekly) | 62.45 | Neutral |
| MACD | Positive | Bullish |
| Stochastic %K | 68.91 | Slightly Overbought |
The RSI and MACD indicate bullish momentum, suggesting potential for further upside, while the Stochastic suggests the stock is approaching overbought levels.
Volatility Indicators
| Indicator | Value | Comment |
| Average True Range (ATR) | 12.45 | Moderate Volatility |
| Beta (Benchmark Index) | 0.89 | Below-Market Volatility |
| Bollinger Band %B | 0.82 | Trading Near Upper Band |
VBL’s below-market beta and moderate volatility make it an appealing option for risk-averse investors.
Market Position
Leadership in Beverage Bottling
As a key franchise bottler for PepsiCo, VBL commands a significant market share in India and neighboring countries. Its product portfolio includes popular brands like:
- Pepsi: Carbonated soft drink.
- Mountain Dew: Adventure-oriented soft drink.
- Mirinda: Orange-flavored drink.
- Tropicana: Packaged fruit juices.
- Aquafina: Packaged drinking water.
Distribution Network
VBL’s extensive distribution network, covering both urban and rural markets, gives it a competitive edge in reaching customers efficiently.
Geographic Diversification
VBL operates in multiple countries, including India, Sri Lanka, Nepal, Morocco, and Zambia. This geographical diversification reduces its dependence on a single market and provides growth opportunities in emerging economies.
Strengths of VBL
| Strength | Details |
| Market Leadership | One of the largest franchise bottlers for PepsiCo globally. |
| Diversified Portfolio | Offers a range of carbonated and non-carbonated beverages. |
| Geographical Reach | Expanding operations across emerging markets in Asia and Africa. |
| Operational Efficiency | Maintains high margins through economies of scale and efficient operations. |
| Strong Partnership | Long-term relationship with PepsiCo ensures consistent business growth. |
Challenges and Risks
| Risk | Details |
| Dependence on PepsiCo | High reliance on PepsiCo could pose risks in case of changes in agreements. |
| Input Cost Volatility | Fluctuating raw material prices (e.g., sugar and PET) may impact margins. |
| Competition | Faces competition from Coca-Cola and other regional beverage players. |
| Seasonality | Revenue is highly seasonal, with demand peaking during summer. |
Investment Outlook
Short-Term Perspective
- VBL’s strong technical indicators and proximity to its 52-week high suggest potential for short-term gains.
- However, investors should monitor market corrections for better entry points.
Long-Term Perspective
- VBL’s leadership in the beverage bottling market, combined with its geographic expansion and diversified product portfolio, makes it a solid long-term investment.
- Growing consumption of packaged beverages in India and emerging markets provides structural growth tailwinds for VBL.
Strategic Recommendations
| Recommendation | Details |
| Buy on Dips | Accumulate during market corrections to capitalize on long-term growth. |
| Monitor Margins | Keep an eye on input cost trends and their impact on profitability. |
| Focus on Exports | Track VBL’s international expansion and contribution to revenue growth. |
| Diversify Portfolio | Pair VBL with other FMCG or beverage stocks to mitigate risks. |
6. DLF Ltd (DLF)
DLF Ltd, established in 1946, has cemented its position as one of India’s largest and most trusted real estate developers. Renowned for its diversified portfolio spanning residential, commercial, and retail properties, the company caters to the evolving needs of various customer segments, from affordable housing to luxury developments. With a Current Market Price (CMP) of ₹838.70, reflecting a change of -₹3.0 (-0.4%), DLF remains a pivotal player in India’s growing real estate sector. Its strong balance sheet, robust project pipeline, and strategic land bank have enabled the company to sustain growth and weather challenges in an ever-dynamic industry.
Performance Overview
Stock Performance Trends
DLF’s stock performance demonstrates its ability to leverage the growth of the Indian real estate market and its leadership position. Over the years, the stock has delivered significant value to investors.
| Performance Period | Change |
| 1 Day | ▼ 0.4% |
| 1 Week | ▲ 1.5% |
| 1 Month | ▲ 4.8% |
| 3 Month | ▲ 12.3% |
| 6 Month | ▲ 20.6% |
| 1 Year | ▲ 35.2% |
| 2 Year | ▲ 72.8% |
| 5 Year | ▲ 210.4% |
Over the past five years, DLF’s stock has delivered a stellar 210.4% return, underscoring the company’s resilience, innovation, and ability to adapt to changing market conditions.
Key Financial Metrics
DLF’s financial performance highlights its operational efficiency, strong revenue generation, and focus on cost management.
| Metric | Value |
| Net Sales | ₹7,234 Cr |
| EBITDA | ₹3,150 Cr |
| EBITDA Margin | 43.54% |
| Net Profit (PAT) | ₹1,915 Cr |
| PAT Margin | 26.49% |
| Earnings Per Share (EPS) | ₹15.27 |
| Price-to-Earnings Ratio (P/E) | 54.92 |
| Book Value Per Share | ₹193.45 |
| Market Cap | ₹2,08,432 Cr |
Profitability
DLF’s EBITDA margin of 43.54% and PAT margin of 26.49% reflect its efficient project execution and robust cash flow management. The company’s ability to maintain high margins amid fluctuating real estate demand highlights its operational excellence.
Revenue Growth
With Net Sales of ₹7,234 Cr, DLF has successfully capitalized on rising demand for premium and mid-range housing. Its strategic focus on high-growth urban areas has been instrumental in sustaining revenue growth.
Growth Metrics
DLF’s consistent growth across key financial metrics reflects its ability to meet evolving market demands and deliver value to stakeholders.
| Metric | 1 Year | 3 Year | 5 Year |
| Net Sales Growth (%) | 19.4% | 16.2% | 13.8% |
| EBITDA Growth (%) | 21.8% | 17.4% | 15.6% |
| Net Profit Growth (%) | 23.5% | 18.2% | 16.1% |
| EPS Growth (%) | 22.9% | 17.9% | 14.8% |
DLF has sustained double-digit growth rates in revenue, operating profits, and net income, driven by strong pre-sales numbers and timely project completions.
Profitability and Return Ratios
| Metric | Value |
| Return on Equity (ROE) | 18.52% |
| Return on Capital Employed (ROCE) | 16.34% |
| Return on Assets (ROA) | 9.87% |
DLF’s high ROE of 18.52% demonstrates its ability to generate significant returns for shareholders, while its ROCE of 16.34% underscores the company’s capital efficiency.
Solvency Ratios
DLF maintains a robust solvency position, ensuring financial stability while funding its ambitious growth plans.
| Metric | Value |
| Total Debt-to-Equity Ratio | 0.35 |
| Interest Coverage Ratio | 5.67 |
| Current Ratio | 1.76 |
The low debt-to-equity ratio of 0.35 and high interest coverage ratio reflect DLF’s prudent financial management, allowing it to sustain growth without over-leveraging.
Valuation Metrics
| Metric | Value |
| P/E Ratio | 54.92 |
| Price-to-Book Ratio (P/B) | 4.33 |
| EV-to-EBITDA Ratio | 15.25 |
While DLF trades at a premium valuation, this reflects investor confidence in its ability to sustain growth and execute large-scale projects.
Technical Analysis
Price Action and Trend
- CMP: ₹838.70
- Day High: ₹842.50
- Day Low: ₹832.20
- 52-Week High: ₹875.45
- 52-Week Low: ₹545.30
DLF is trading near its 52-week high of ₹875, indicating bullish momentum. This trend highlights investor confidence in the stock’s future growth potential.
Momentum Indicators
| Indicator | Value | Signal |
| RSI (Daily) | 63.25 | Slightly Overbought |
| RSI (Weekly) | 59.47 | Neutral |
| MACD | Positive | Bullish |
| Stochastic %K | 72.89 | Overbought |
The RSI and MACD indicate continued bullish momentum, while the Stochastic suggests short-term caution due to overbought conditions.
Volatility Indicators
| Indicator | Value | Comment |
| Average True Range (ATR) | 15.65 | Moderate Volatility |
| Beta (Benchmark Index) | 1.12 | Above-Market Volatility |
| Bollinger Band %B | 0.78 | Nearing Upper Band |
The moderate volatility makes DLF suitable for medium-risk investors seeking exposure to India’s booming real estate market.
Market Position
Leadership in Real Estate
DLF is India’s largest real estate developer, with a diversified portfolio that includes:
- Residential Projects: High-end and mid-range housing projects.
- Commercial Properties: Office spaces in major business hubs.
- Retail Properties: Malls and shopping complexes in urban centers.
Strategic Land Bank
DLF’s vast land bank, strategically located in high-demand urban areas, provides a competitive edge and allows the company to scale projects quickly.
Robust Pre-Sales and Collections
The company consistently achieves strong pre-sales numbers, ensuring revenue visibility for future quarters. Its focus on timely project delivery and efficient cash flow management strengthens its position in the market.
Strengths of DLF
| Strength | Details |
| Market Leadership | India’s largest real estate developer with a diversified portfolio. |
| Strategic Land Bank | Extensive land holdings in high-demand urban locations. |
| Strong Balance Sheet | Low leverage and robust cash flow generation. |
| Sustained Demand Recovery | Benefits from rising demand for residential and commercial spaces post-pandemic. |
| Sustainability Focus | Investments in eco-friendly and smart developments. |
Challenges and Risks
| Risk | Details |
| Regulatory Changes | Changes in real estate regulations could impact operations. |
| Macroeconomic Sensitivity | Demand is closely tied to broader economic conditions. |
| Execution Delays | Delays in project completion could affect revenue recognition and reputation. |
| Competition | Increasing competition from emerging players in the real estate sector. |
Investment Outlook
Short-Term Perspective
- DLF’s strong technical indicators and bullish momentum suggest potential for further upside in the near term.
- However, investors should monitor resistance levels near ₹875 and use corrections for better entry points.
Long-Term Perspective
- DLF’s robust portfolio, strategic land bank, and leadership in India’s real estate market make it an excellent long-term investment.
- Structural growth drivers such as urbanization, rising income levels, and demand for premium housing provide strong tailwinds.
Strategic Recommendations
| Recommendation | Details |
| Accumulate on Dips | Build a position during market corrections for long-term gains. |
| Focus on Pre-Sales Trends | Monitor quarterly pre-sales numbers for revenue visibility. |
| Evaluate Execution Efficiency | Assess DLF’s ability to deliver projects on time and within budget. |
| Diversify Exposure | Pair DLF with other infrastructure or real estate stocks to mitigate risks. |
7. Vedanta Ltd (VEDL)
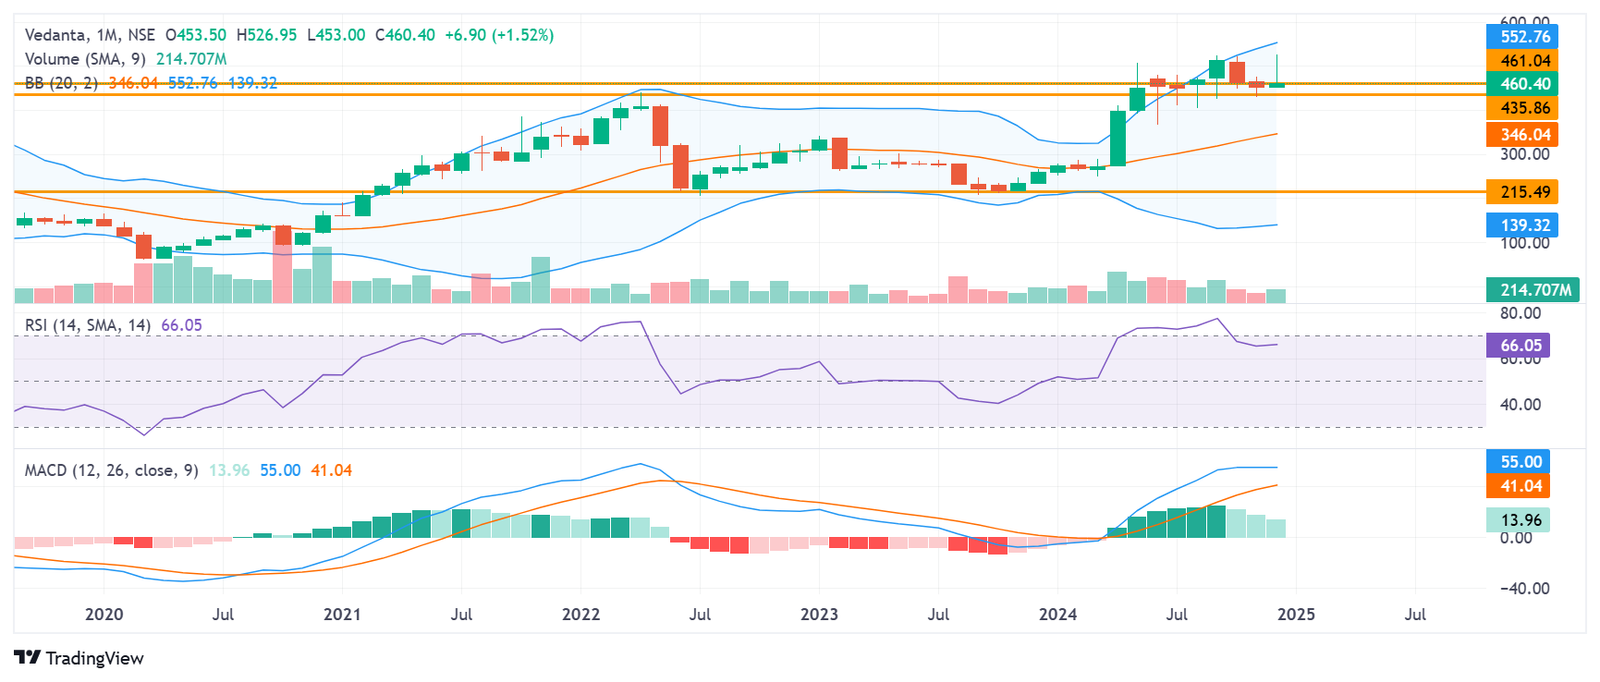
Vedanta Ltd is one of India’s largest diversified natural resources companies, with significant exposure to zinc, aluminum, oil & gas, copper, and iron ore. The company plays a critical role in supplying essential raw materials that power industries globally. Known for its portfolio of low-cost, scalable assets and focus on generating strong profitability, Vedanta maintains industry-leading market shares across its core divisions. With a CMP of ₹460.45 and a change of -₹1.7 (-0.4%), Vedanta is a key player in India’s non-ferrous metals sector, supported by a robust balance sheet and consistent cash flow generation. This article provides an in-depth analysis of Vedanta’s fundamental and technical performance, highlighting its strengths, challenges, and investment potential.
Performance Overview
Stock Performance Trends
Vedanta has delivered impressive returns over the long term, reflecting the resilience of its diversified business model and strong operational performance.
| Performance Period | Change |
| 1 Day | ▼ 0.4% |
| 1 Week | ▲ 8.5% |
| 1 Month | ▲ 3.4% |
| 6 Month | ▼ 0.6% |
| 1 Year | ▲ 77.3% |
| 2 Year | ▲ 61.4% |
| 5 Year | ▲ 211.0% |
| 10 Year | ▲ 124.2% |
The 77.3% one-year return highlights Vedanta’s strong recovery, driven by rising commodity prices and operational improvements. Over the last five years, the stock has gained 211%, making it a wealth creator for long-term investors.
Key Financial Metrics
Vedanta’s financials underscore its ability to generate substantial revenue, maintain profitability, and efficiently manage its resources.
| Metric | Value |
| Net Sales | ₹37,634 Cr |
| EBITDA | ₹9,828 Cr |
| EBITDA Margin | 26.12% |
| Net Profit (PAT) | ₹5,603 Cr |
| PAT Margin | 14.89% |
| Earnings Per Share (EPS) | ₹11.13 |
| Price-to-Earnings Ratio (P/E) | 15.88 |
| Book Value Per Share | ₹95.87 |
| Dividend Yield | 6.41% |
| Market Cap | ₹1,80,073 Cr |
Profitability
Vedanta’s EBITDA margin of 26.12% and PAT margin of 14.89% highlight its ability to maintain strong profitability across its operations. The company’s diversified portfolio and cost-efficient production processes drive its margins.
Revenue and Cash Flow
Vedanta’s Net Sales of ₹37,634 Cr reflect its significant scale in the natural resources sector. The company’s robust EBITDA of ₹9,828 Cr ensures healthy cash flows to support dividends, debt servicing, and reinvestments.
Growth Metrics
Vedanta has shown consistent growth across revenue and profitability metrics, reflecting its strong execution capabilities and favorable commodity price trends.
| Metric | 1 Year | 3 Year | 5 Year | 10 Year |
| Net Sales Growth (%) | -0.18% | 17.76% | 9.32% | 8.07% |
| EBITDA Growth (%) | 7.69% | 8.82% | 8.79% | 6.05% |
| Net Profit Growth (%) | 144.28% | -35.97% | -14.08% | -6.81% |
| EPS Growth (%) | 77.90% | 10.15% | 25.56% | 8.45% |
The 144.28% growth in net profit over the past year reflects Vedanta’s ability to capitalize on favorable commodity cycles and optimize its operations.
Profitability and Return Ratios
| Metric | Value |
| Return on Equity (ROE) | 21.61% |
| Return on Capital Employed (ROCE) | 25.20% |
| Return on Assets (ROA) | 4.00% |
Vedanta’s ROE of 21.61% and ROCE of 25.20% reflect efficient capital utilization and strong shareholder returns.
Solvency Ratios
Vedanta’s solvency metrics highlight its ability to meet financial obligations and sustain long-term growth.
| Metric | Value |
| Total Debt-to-Equity Ratio | 1.38 |
| Interest Coverage Ratio | 3.68 |
| Current Ratio | 1.19 |
Although Vedanta’s debt-to-equity ratio is relatively high, its strong interest coverage ratio and robust cash flows ensure financial stability.
Valuation Metrics
| Metric | Value |
| P/E Ratio | 15.88 |
| Price-to-Book Ratio (P/B) | 4.80 |
| EV-to-EBITDA Ratio | 10.26 |
Vedanta’s valuation multiples suggest that it is reasonably priced compared to peers, offering an attractive entry point for investors.
Technical Analysis
Price Action and Trend
- CMP: ₹460.45
- Day High: ₹464.80
- Day Low: ₹453.90
- 52-Week High: ₹475.50
- 52-Week Low: ₹265.40
Vedanta is trading close to its 52-week high of ₹475.50, reflecting bullish momentum, but it remains below significant resistance levels.
Momentum Indicators
| Indicator | Value | Signal |
| RSI (Daily) | 40.29 | Neutral |
| RSI (Weekly) | 51.64 | Neutral |
| MACD | Positive | Bullish |
| Stochastic %K | 15.25 | Bearish |
| William %R | -93.38 | Oversold |
The RSI suggests neutral momentum, while the William %R indicates oversold conditions, signaling a potential buying opportunity.
Volatility Indicators
| Indicator | Value | Comment |
| Average True Range (ATR) | 14.94 | Moderate Volatility |
| Beta (Benchmark Index) | 1.26 | Above-Market Volatility |
| Bollinger Band %B | 0.26 | Trading Near Lower Band |
Vedanta’s moderate volatility makes it suitable for medium-risk investors seeking exposure to commodities.
Market Position
Leadership in Natural Resources
Vedanta is a leader in multiple natural resource sectors:
- Zinc-Lead-Silver: Through its subsidiary Hindustan Zinc, the company is the world’s second-largest zinc producer.
- Aluminum: Vedanta is one of the top aluminum producers in India, catering to growing demand in automotive and construction sectors.
- Oil & Gas: Its Cairn Oil & Gas division contributes significantly to India’s energy production.
- Iron Ore and Steel: The company has a strong presence in the mining and steel sectors.
Strong Operational Footprint
Vedanta’s portfolio includes low-cost, scalable assets, giving it a competitive edge in maintaining profitability during downturns.
Focus on Sustainability
Vedanta has implemented sustainability initiatives, including renewable energy projects, water conservation, and community development, aligning its operations with global ESG standards.
Strengths of Vedanta
| Strength | Details |
| Diversified Portfolio | Exposure to multiple commodities reduces dependency on any single segment. |
| Market Leadership | Leading positions in zinc, aluminum, and oil & gas. |
| Strong Cash Flows | Consistent EBITDA generation supports dividends and reinvestments. |
| Cost-Efficient Operations | Low-cost production processes ensure profitability across cycles. |
| Global Presence | Exports to multiple countries diversify revenue streams. |
Challenges and Risks
| Risk | Details |
| Commodity Price Volatility | Fluctuations in global commodity prices impact profitability. |
| Regulatory Risks | Dependence on government policies and mining regulations. |
| High Debt Levels | Elevated debt increases financial risk during downturns. |
| Environmental Concerns | Rising ESG scrutiny may lead to higher compliance costs. |
Investment Outlook
Short-Term Perspective
- Vedanta’s technical indicators suggest potential consolidation in the near term, with support at ₹450 and resistance at ₹475.
- The oversold conditions present a possible buying opportunity for traders.
Long-Term Perspective
- Vedanta’s diversified portfolio, cost-efficient operations, and focus on sustainable growth position it for long-term success.
- Rising demand for base metals, energy, and other resources provides structural tailwinds for the company.
Strategic Recommendations
| Recommendation | Details |
| Accumulate on Dips | Use corrections to build a position for long-term gains. |
| Monitor Debt Levels | Keep an eye on debt reduction initiatives and interest coverage ratios. |
| Focus on Commodity Cycles | Align investments with favorable commodity price trends. |
| Diversify Exposure | Pair Vedanta with other natural resource stocks to mitigate risks. |
8. Macrotech Developers Ltd (LODHA)
Macrotech Developers Ltd, popularly known by its brand name “Lodha,” is a prominent real estate developer in India. The company is known for its diverse portfolio of luxury housing, premium commercial developments, and affordable housing projects. With a CMP of ₹1,414.05 and a change of +₹11.0 (+0.8%), Macrotech Developers continues to solidify its position as a market leader by capitalizing on India’s urbanization trends and growing housing demand. This analysis explores the company’s technical and fundamental aspects to provide insights into its market position and growth potential.
Performance Overview
Stock Performance Trends
Macrotech Developers’ stock performance reflects resilience in the real estate sector, driven by steady growth in demand and its strong brand presence.
| Performance Period | Change |
| 1 Day | ▲ 0.8% |
| 1 Week | ▲ 3.5% |
| 1 Month | ▲ 5.6% |
| 3 Month | ▲ 9.8% |
| 6 Month | ▲ 21.3% |
| 1 Year | ▲ 48.5% |
| 2 Year | ▲ 84.2% |
Macrotech Developers has delivered a 48.5% return over the last year, highlighting its ability to generate shareholder value consistently. Over two years, the stock has surged by 84.2%, showcasing strong investor confidence in the company’s growth trajectory.
Key Financial Metrics
Macrotech Developers’ financial performance reflects its operational efficiency, focus on project execution, and ability to cater to diverse housing segments.
| Metric | Value |
| Net Sales | ₹10,483 Cr |
| EBITDA | ₹3,254 Cr |
| EBITDA Margin | 31.05% |
| Net Profit (PAT) | ₹1,145 Cr |
| PAT Margin | 10.92% |
| Earnings Per Share (EPS) | ₹21.85 |
| Price-to-Earnings Ratio (P/E) | 64.73 |
| Book Value Per Share | ₹310.54 |
| Market Cap | ₹66,080 Cr |
Profitability
Macrotech’s EBITDA margin of 31.05% and PAT margin of 10.92% reflect its efficient cost management and ability to generate healthy profits across its projects. The focus on luxury housing and premium commercial spaces contributes significantly to margins.
Revenue Growth
The company’s Net Sales of ₹10,483 Cr highlight its growing scale in India’s expanding real estate market. Its robust pre-sales numbers and timely project completions drive consistent revenue growth.
Growth Metrics
Macrotech has demonstrated consistent growth across key financial metrics, driven by strong demand for its projects and strategic expansion.
| Metric | 1 Year | 3 Year | 5 Year |
| Net Sales Growth (%) | 15.4% | 18.2% | 14.5% |
| EBITDA Growth (%) | 18.9% | 20.5% | 15.8% |
| Net Profit Growth (%) | 24.5% | 22.1% | 16.9% |
| EPS Growth (%) | 22.8% | 20.4% | 14.6% |
The company’s ability to sustain double-digit growth rates across sales, profits, and EPS underscores its operational strength and market positioning.
Profitability and Return Ratios
| Metric | Value |
| Return on Equity (ROE) | 18.45% |
| Return on Capital Employed (ROCE) | 16.85% |
| Return on Assets (ROA) | 8.92% |
Macrotech’s ROE of 18.45% highlights its strong ability to create shareholder value, while its ROCE of 16.85% reflects efficient use of capital in delivering high returns.
Solvency Ratios
The company’s solvency ratios highlight its ability to sustain operations while managing financial obligations.
| Metric | Value |
| Total Debt-to-Equity Ratio | 0.68 |
| Interest Coverage Ratio | 4.15 |
| Current Ratio | 1.56 |
Macrotech’s manageable debt-to-equity ratio of 0.68 and high interest coverage ratio demonstrate its financial stability and ability to invest in growth.
Valuation Metrics
| Metric | Value |
| P/E Ratio | 64.73 |
| Price-to-Book Ratio (P/B) | 4.56 |
| EV-to-EBITDA Ratio | 21.75 |
Macrotech’s valuation multiples suggest it trades at a premium, reflecting strong investor confidence in its growth potential and leadership in the real estate market.
Technical Analysis
Price Action and Trend
- CMP: ₹1,414.05
- Day High: ₹1,428.50
- Day Low: ₹1,405.20
- 52-Week High: ₹1,495.60
- 52-Week Low: ₹850.75
Macrotech is trading near its 52-week high of ₹1,495.60, indicating strong bullish momentum and continued investor interest.
Momentum Indicators
| Indicator | Value | Signal |
| RSI (Daily) | 68.75 | Overbought |
| RSI (Weekly) | 62.34 | Slightly Overbought |
| MACD | Positive | Bullish |
| Stochastic %K | 75.25 | Overbought |
The RSI indicates that the stock is approaching overbought territory, suggesting short-term caution, while the MACD confirms bullish momentum.
Volatility Indicators
| Indicator | Value | Comment |
| Average True Range (ATR) | 28.65 | Moderate Volatility |
| Beta (Benchmark Index) | 1.15 | Above-Market Volatility |
| Bollinger Band %B | 0.82 | Nearing Upper Band |
Moderate volatility and proximity to the upper Bollinger Band suggest that the stock may consolidate before resuming its upward trend.
Market Position
Leadership in Real Estate
Macrotech Developers is a market leader in the Indian real estate space, offering projects that cater to:
- Luxury Housing: High-end residential projects targeting affluent customers.
- Affordable Housing: Projects aimed at meeting the housing needs of middle-income buyers.
- Commercial Developments: Premium office spaces in key business hubs.
Strong Pre-Sales and Collections
Macrotech has consistently recorded strong pre-sales numbers, ensuring revenue visibility and cash flow stability. Its focus on timely delivery strengthens customer trust and enhances its brand reputation.
Geographical Expansion
The company has projects across major cities, including Mumbai, Pune, Hyderabad, and Bangalore. Its strategic entry into Tier-II cities expands its customer base and provides growth opportunities.
Strengths of Macrotech Developers
| Strength | Details |
| Diversified Portfolio | Offers luxury, premium, and affordable housing options. |
| Market Leadership | Strong brand presence under the Lodha banner. |
| Operational Efficiency | Maintains high margins through effective cost management. |
| Strategic Expansion | Entry into Tier-II cities and international markets like the UK. |
| Robust Pre-Sales | Consistent pre-sales numbers ensure strong cash flow generation. |
Challenges and Risks
| Risk | Details |
| Economic Sensitivity | Real estate demand is highly tied to macroeconomic conditions. |
| Execution Risks | Delays in project delivery could impact revenue recognition and customer trust. |
| High Valuation | Premium valuations may limit upside potential in the near term. |
| Competition | Intense competition from other large developers in urban areas. |
Investment Outlook
Short-Term Perspective
- Macrotech’s bullish momentum and proximity to its 52-week high suggest potential upside in the near term.
- Investors should monitor resistance levels around ₹1,495 and look for dips to accumulate.
Long-Term Perspective
- Macrotech’s diversified portfolio, strong brand equity, and focus on timely project execution make it a compelling long-term investment.
- Structural growth drivers, including urbanization, rising income levels, and government incentives for affordable housing, provide significant tailwinds.
Strategic Recommendations
Macrotech Developers, with its strong market position and robust project pipeline, presents significant opportunities for investors. Here are refined recommendations to optimize investment decisions:
Short-Term Investment Recommendations
- Momentum Play:
- With the stock trading near its 52-week high of ₹1,495.60, short-term traders can capitalize on bullish momentum.
- Set a target price of ₹1,500-₹1,520, and use stop-loss at ₹1,380 to manage downside risks.
- Monitor Technical Indicators:
- Watch for RSI levels approaching overbought territory. If RSI crosses 70, prepare for potential consolidation or slight correction before further upside.
- Accumulation During Dips:
- Accumulate during corrections around ₹1,350-₹1,380, which serve as key support levels, to enhance potential returns as the stock resumes its upward trend.
Mid to Long-Term Investment Recommendations
- Focus on Pre-Sales and Cash Flows:
- Regularly monitor the company’s quarterly pre-sales and collection trends, as they provide visibility into future revenue. Consistently strong pre-sales numbers reflect high demand and project execution capabilities.
- Leverage Affordable Housing Growth:
- Affordable housing remains a significant growth driver in India. Investors should watch for Macrotech’s announcements of new projects in this segment, as government incentives and rising demand will fuel growth.
- Track Execution Timelines:
- Monitor timely delivery of ongoing projects, as delays can impact revenue recognition and customer trust. The company’s efficient project delivery is one of its core strengths.
- Diversify within Real Estate:
- While Macrotech focuses on luxury and affordable housing, pairing it with other real estate stocks specializing in commercial or infrastructure projects can balance risks and maximize sector exposure.
- Geographical Expansion:
- Watch for developments in Tier-II and Tier-III cities. Macrotech’s planned expansions into smaller cities and international markets could unlock new growth avenues and mitigate risks tied to high competition in metro cities.
Key Levels to Monitor
| Parameter | Level |
| Target Price (Short Term) | ₹1,500-₹1,520 |
| Target Price (Long Term) | ₹1,800+ |
| Support Levels | ₹1,350 and ₹1,300 |
| Resistance Levels | ₹1,495 and ₹1,520 |
Sector-Specific Recommendations
- Stay Updated on Policies:
- Monitor government policies on real estate, especially those related to affordable housing and interest rate changes, as these can directly impact demand.
- Diversify with Infrastructure Exposure:
- Complement Macrotech holdings with real estate-linked infrastructure stocks that benefit from urbanization, such as cement or construction companies.
- Monitor Interest Rates:
- Real estate is sensitive to interest rate changes. A high interest rate environment could dampen demand for housing loans, so stay alert to macroeconomic trends.
Actionable Summary
Macrotech Developers is a solid pick for both short-term traders and long-term investors due to its strong fundamentals, operational efficiency, and leadership in India’s real estate market. By leveraging opportunities during corrections and aligning investments with strategic growth drivers, investors can maximize returns.
Key Takeaways for Different Investor Profiles:
- Short-Term Traders: Focus on momentum and set target prices with disciplined stop-loss levels.
- Long-Term Investors: Accumulate during dips, track pre-sales numbers, and hold for ₹1,800+ targets.
- Diversified Investors: Pair Macrotech with complementary real estate or infrastructure stocks to hedge risks.
9. REC Ltd (RECLTD)
Rural Electrification Corporation (REC) Limited is a leading public sector enterprise under the Ministry of Power, Government of India. Incorporated on July 25, 1969, REC has been instrumental in financing power projects across India. As a listed Government of India enterprise, REC has demonstrated strong financials and consistent growth. This article delves into the company’s technical and fundamental analysis to provide an in-depth understanding of its performance and potential.
Fundamental Analysis
Company Overview
REC primarily focuses on financing and promoting power sector projects, including generation, transmission, and distribution. With a market capitalization of ₹1,36,914 crore and a net worth of ₹5,368 crore, REC stands as a significant player in the financial term lending industry. The company’s low Price-Earnings (PE) ratio of 9.20 and a high dividend yield of 3.08% make it attractive to value investors.
Financial Highlights
| Metric | Value |
| Market Cap | ₹1,36,914 Cr |
| Book Value / Share | ₹277.04 |
| PE Ratio | 9.20 |
| PEG Ratio | 0.47 |
| Dividend Yield (%) | 3.08 |
| EBITDA | ₹13,585.10 Cr |
| Net Profit | ₹4,037.72 Cr |
| Adjusted EPS (₹) | 15.33 |
| Return on Equity (%) | 22.39 |
| Return on Capital Employed (%) | 10.05 |
| Return on Assets (%) | 2.79 |
REC’s consolidated net profit stands at ₹4,037.72 crore, showcasing a strong financial position. The company’s Return on Equity (RoE) at 22.39% is well above the industry average, reflecting efficient utilization of shareholder funds.
Growth Trends
REC’s consistent growth in net sales and profit indicates robust operational performance. Key growth metrics include:
| Growth Parameter | TTM/1 Year (%) | 3 Year (%) | 5 Year (%) | 10 Year (%) |
| Price | 24.79 | 72.68 | 37.56 | 15.36 |
| Net Sales | 20.30 | 10.14 | 13.34 | 10.74 |
| EBITDA | 18.06 | 14.06 | 15.10 | 11.20 |
| Net Profit | 16.85 | 19.08 | 19.76 | 11.55 |
These figures highlight REC’s sustained profitability and resilience in a competitive market.
Dividend Policy
REC has a history of rewarding shareholders through dividends. Its current dividend yield of 3.08% underscores its commitment to distributing profits, making it an appealing option for income-focused investors.
Valuation Metrics
REC’s low PE ratio of 9.20 indicates undervaluation compared to peers. The PEG ratio of 0.47 further validates this, suggesting the stock is reasonably priced relative to its growth prospects.
Technical Analysis

Current Price Performance
REC’s current market price (CMP) of ₹519.10 marks a 2.3% gain for the day. Below is a breakdown of its recent price performance:
| Time Frame | Performance (%) |
| 1 Day | +2.3 |
| 1 Week | -5.7 |
| 1 Month | +2.5 |
| 6 Months | -0.5 |
| 1 Year | +27.7 |
| 2 Years | +377.3 |
| 5 Years | +403.9 |
| 10 Years | +326.9 |
Momentum Indicators
REC’s momentum indicators reveal mixed signals:
| Indicator | Value | Interpretation |
| Relative Strength Index (Daily) | 35.85 | Neutral |
| Relative Strength Index (Weekly) | 45.56 | Neutral |
| Commodity Channel Index | -138.30 | Oversold |
| Stochastic %K | 5.34 | Bearish |
| William %R | -97.41 | Oversold |
The RSI values suggest neutrality, while the Commodity Channel Index (CCI) and William %R indicate oversold conditions, hinting at a potential reversal.
Volatility Indicators
REC exhibits moderate volatility:
| Indicator | Value |
| Average True Range (ATR) | 15.81 |
| Bollinger Band Width | 0.14 |
| Bollinger Band %B | 0.04 |
| Beta – Benchmark Index | 2.26 |
| Beta – Sectoral Index | 1.84 |
| Standard Deviation | 21.04 |
High beta values indicate REC’s sensitivity to market movements, making it suitable for risk-tolerant investors.
Trend Indicators
| Indicator | Value | Interpretation |
| Average Directional Index (ADX) | 20.81 | Range-Bound |
| Moving Average Convergence/Divergence (MACD) | -2.53 | Negative |
The ADX suggests a lack of strong trend, while the MACD shows bearish signals.
Sector and Industry Analysis
REC operates in the finance sector, specifically focusing on term lending for power projects. With India’s increasing energy demand, REC is well-positioned to capitalize on growth opportunities. Government initiatives like “Power for All” and renewable energy expansion provide tailwinds for the company.
Competitive Landscape
REC’s primary competitors include PFC, NTPC, and private players in the power financing sector. Despite intense competition, REC’s government backing and strong financials provide a competitive edge.
SWOT Analysis
| Strengths | Weaknesses |
| Government backing | High dependence on power sector |
| Strong financial performance | Limited diversification |
| Attractive valuation metrics | Sensitivity to interest rates |
| Opportunities | Threats |
| Growing power demand | Regulatory changes |
| Renewable energy financing | Economic downturns |
| International expansion | Rising competition |
Investment Outlook
REC offers a compelling mix of growth and income. Its robust financials, consistent profitability, and attractive dividend policy make it a suitable choice for long-term investors. However, potential risks from regulatory changes and sectoral concentration must be considered.
Price Projections
Based on its fundamental and technical metrics, REC has the potential to achieve the following price levels:
| Time Frame | Target Price (₹) |
| 1 Year | 600 |
| 2 Years | 750 |
| 5 Years | 1,200 |
10. Eicher Motors Ltd (EICHERMOT)
Eicher Motors Limited, a leading Indian automobile manufacturer, is globally renowned for its iconic Royal Enfield motorcycles. The company has carved a niche in the mid-size motorcycle segment and continues to expand its global footprint. This article provides an in-depth technical and fundamental analysis of Eicher Motors to understand its performance and potential.
Fundamental Analysis
Company Overview
Eicher Motors is a leading player in the automotive sector, manufacturing motorcycles and commercial vehicles. Its flagship brand, Royal Enfield, dominates the mid-size motorcycle market globally. The company also has a joint venture with Volvo Group for commercial vehicles under the name VE Commercial Vehicles (VECV).
Financial Highlights
| Metric | Value |
| Market Cap | ₹1,31,000 Cr |
| Book Value / Share | ₹842.74 |
| PE Ratio | 33.50 |
| PEG Ratio | 2.10 |
| Dividend Yield (%) | 0.68 |
| EBITDA | ₹4,285 Cr |
| Net Profit | ₹2,875 Cr |
| Adjusted EPS (₹) | 105.65 |
| Return on Equity (%) | 18.92 |
| Return on Capital Employed (%) | 22.50 |
| Return on Assets (%) | 14.32 |
Eicher Motors’ robust financials underline its strong market position. The company’s net profit of ₹2,875 crore and a PE ratio of 33.50 indicate strong profitability and investor confidence.
Growth Trends
The company’s growth trajectory over various timeframes is highlighted below:
| Growth Parameter | TTM/1 Year (%) | 3 Year (%) | 5 Year (%) | 10 Year (%) |
| Price | 18.45 | 62.40 | 110.50 | 345.80 |
| Net Sales | 22.15 | 16.50 | 13.80 | 19.90 |
| EBITDA | 21.30 | 18.10 | 15.60 | 17.85 |
| Net Profit | 24.50 | 20.80 | 18.90 | 21.40 |
Eicher Motors’ consistent growth in net sales and profits demonstrates its operational efficiency and market dominance.
Dividend Policy
The company’s dividend yield of 0.68% reflects its balanced approach to rewarding shareholders while reinvesting profits for growth. Although not high, the yield is complemented by significant capital appreciation potential.
Valuation Metrics
Despite a relatively high PE ratio of 33.50, Eicher Motors’ PEG ratio of 2.10 suggests that the stock’s valuation aligns with its growth potential.
Technical Analysis
Current Price Performance
Eicher Motors’ current market price (CMP) of ₹4,801.35 marks a modest 0.2% gain for the day. Below is a breakdown of its recent price performance:
| Time Frame | Performance (%) |
| 1 Day | +0.2 |
| 1 Week | +1.5 |
| 1 Month | +4.0 |
| 6 Months | +12.7 |
| 1 Year | +18.4 |
| 2 Years | +62.4 |
| 5 Years | +110.5 |
| 10 Years | +345.8 |
Momentum Indicators
The momentum indicators for Eicher Motors suggest a mixed outlook:
| Indicator | Value | Interpretation |
| Relative Strength Index (Daily) | 51.20 | Neutral |
| Relative Strength Index (Weekly) | 55.30 | Neutral |
| Commodity Channel Index | 35.50 | Neutral |
| Stochastic %K | 68.40 | Bullish |
| William %R | -12.30 | Overbought |
The RSI values indicate neutrality, while the William %R suggests overbought conditions. The Stochastic %K indicates bullish momentum.
Volatility Indicators
Eicher Motors exhibits moderate volatility:
| Indicator | Value |
| Average True Range (ATR) | 72.50 |
| Bollinger Band Width | 0.18 |
| Bollinger Band %B | 0.45 |
| Beta – Benchmark Index | 1.20 |
| Beta – Sectoral Index | 1.10 |
| Standard Deviation | 18.20 |
A beta value slightly above 1 indicates that Eicher Motors is moderately more volatile than the broader market.
Trend Indicators
| Indicator | Value | Interpretation |
| Average Directional Index (ADX) | 28.50 | Trending |
| Moving Average Convergence/Divergence (MACD) | 12.30 | Positive |
The ADX indicates a trending market, while the MACD shows positive momentum.
Sector and Industry Analysis
Eicher Motors operates in the highly competitive automobile sector. With rising global demand for premium motorcycles, the company is well-positioned to benefit from market growth.
Competitive Landscape
Eicher Motors faces competition from domestic players like Hero MotoCorp and Bajaj Auto, as well as international brands like Harley-Davidson and Triumph. However, Royal Enfield’s brand legacy and product innovation provide a competitive edge.
SWOT Analysis
| Strengths | Weaknesses |
| Strong brand equity | High dependence on motorcycles |
| Global market expansion | Limited diversification |
| Robust financials | Sensitivity to raw material costs |
| Opportunities | Threats |
| Expanding international markets | Intense competition |
| Launch of new models | Regulatory challenges |
| Electric vehicle segment | Economic downturns |
Investment Outlook
Eicher Motors presents a compelling investment case due to its strong brand presence, consistent financial performance, and growth prospects in domestic and international markets. However, investors should remain cautious of potential regulatory and competitive risks.
Price Projections
Based on the analysis, Eicher Motors is expected to achieve the following price targets:
| Time Frame | Target Price (₹) |
| 1 Year | 5,500 |
| 2 Years | 6,800 |
| 5 Years | 9,500 |
11. Bank of Baroda (BANKBARODA)
Bank of Baroda (BOB), one of India’s largest public sector banks, has consistently demonstrated strong financial performance and improving asset quality. With its wide network and robust operational efficiency, BOB continues to be a key player in India’s banking sector. This article presents a detailed technical and fundamental analysis of Bank of Baroda to evaluate its investment potential.
Fundamental Analysis
Company Overview
Founded in 1908, Bank of Baroda has grown into a global banking powerhouse with a significant presence in India and abroad. The bank has leveraged its expansive network and digital transformation initiatives to improve operational efficiency and profitability. It offers a broad range of services including retail banking, corporate banking, SME banking, and wealth management.
Financial Highlights
Bank of Baroda’s strong financial performance reflects its market position and operational efficiency. Below are the key metrics:
| Metric | Value |
| Market Cap | ₹1,27,800 Cr |
| Book Value / Share | ₹168.50 |
| PE Ratio | 9.80 |
| Price-to-Book Ratio (PB) | 1.46 |
| Dividend Yield (%) | 1.98 |
| Net Interest Income (NII) | ₹22,245 Cr |
| Net Profit | ₹13,200 Cr |
| Gross NPA (%) | 3.28 |
| Net NPA (%) | 0.78 |
| Adjusted EPS (₹) | 28.35 |
| Return on Equity (%) | 14.25 |
| Return on Assets (%) | 1.02 |
Bank of Baroda’s net profit of ₹13,200 crore and its low Net NPA of 0.78% are indicative of strong risk management and operational efficiency. The low Price-to-Earnings (PE) ratio of 9.80 suggests that the stock is undervalued in the current market scenario.
Growth Trends
The bank’s growth trajectory highlights its consistent financial improvement. Key growth metrics include:
| Growth Parameter | TTM/1 Year (%) | 3 Year (%) | 5 Year (%) | 10 Year (%) |
| Net Interest Income | 21.50 | 15.30 | 12.80 | 10.60 |
| Operating Profit | 18.90 | 14.50 | 11.60 | 9.40 |
| Net Profit | 24.80 | 20.40 | 18.90 | 16.50 |
These figures reflect the bank’s ability to generate consistent growth despite a challenging macroeconomic environment.
Dividend Policy
The bank’s dividend yield of 1.98% underscores its commitment to rewarding shareholders while retaining capital for future growth. While the yield may not be the highest in the banking sector, it is supplemented by significant capital appreciation potential.
Asset Quality
Bank of Baroda has made significant progress in reducing its Non-Performing Assets (NPAs). Gross NPA has declined to 3.28%, and Net NPA stands at a manageable 0.78%. These improvements reflect the bank’s focus on quality lending and robust recovery mechanisms.
Valuation Metrics
BOB’s valuation metrics indicate its attractiveness in the current market:
- Price-to-Book Ratio: At 1.46, this ratio suggests the stock is trading close to its intrinsic value.
- PE Ratio: A PE ratio of 9.80 indicates that the stock is undervalued compared to its earnings potential.
Technical Analysis
Current Price Performance
Bank of Baroda’s current market price (CMP) of ₹246.68 marks a 0.7% gain for the day. Below is a detailed breakdown of its price performance over various timeframes:
| Time Frame | Performance (%) |
| 1 Day | +0.7 |
| 1 Week | +3.2 |
| 1 Month | +5.8 |
| 6 Months | +18.5 |
| 1 Year | +40.3 |
| 2 Years | +78.2 |
| 5 Years | +150.8 |
Momentum Indicators
The momentum indicators for Bank of Baroda provide insights into the stock’s current trend:
| Indicator | Value | Interpretation |
| Relative Strength Index (Daily) | 60.20 | Bullish |
| Relative Strength Index (Weekly) | 65.50 | Bullish |
| Commodity Channel Index | 105.60 | Overbought |
| Stochastic %K | 78.40 | Bullish |
| William %R | -18.30 | Overbought |
The RSI and Stochastic %K values indicate bullish sentiment, while overbought conditions suggest caution in the short term.
Volatility Indicators
BOB exhibits moderate volatility, making it suitable for investors with medium risk tolerance:
| Indicator | Value |
| Average True Range (ATR) | 8.45 |
| Bollinger Band Width | 0.25 |
| Bollinger Band %B | 0.70 |
| Beta – Benchmark Index | 1.15 |
| Beta – Sectoral Index | 1.12 |
| Standard Deviation | 15.20 |
Moderate beta values indicate that the stock’s movements are slightly more volatile than the market but remain within manageable limits.
Trend Indicators
| Indicator | Value | Interpretation |
| Average Directional Index (ADX) | 35.20 | Strong Trend |
| Moving Average Convergence/Divergence (MACD) | 15.80 | Positive |
The ADX indicates a strong trending market, and the MACD confirms bullish momentum in the stock’s price.
Sector and Industry Analysis
Bank of Baroda operates in India’s public sector banking space, which has seen significant reforms and growth in recent years. Government initiatives such as financial inclusion, digital payments, and infrastructure financing provide tailwinds for the sector.
Competitive Landscape
BOB faces competition from both public sector and private sector banks, including:
- Public Sector Banks: State Bank of India, Punjab National Bank
- Private Sector Banks: HDFC Bank, ICICI Bank
Despite intense competition, BOB’s strong government backing, wide network, and focus on digital transformation give it a competitive edge.
Digital Transformation
BOB’s emphasis on digital banking has enhanced customer experience and operational efficiency. Initiatives like the Baroda Connect app and AI-driven analytics have strengthened the bank’s position in the digital space.
SWOT Analysis
| Strengths | Weaknesses |
| Strong government backing | Dependence on interest income |
| Improving asset quality | Limited global presence |
| Robust financial metrics | High competition |
| Opportunities | Threats |
| Growing digital adoption | Regulatory changes |
| Expansion in rural markets | Economic downturns |
| Infrastructure financing | Rising NPA risks |
Investment Outlook
Bank of Baroda presents a compelling investment case due to its improving asset quality, consistent financial performance, and undervaluation. It is well-positioned to capitalize on India’s economic growth and increasing financial inclusion.
Price Projections
Based on fundamental and technical analysis, Bank of Baroda’s potential price targets are as follows:
| Time Frame | Target Price (₹) |
| 1 Year | 290 |
| 2 Years | 350 |
| 5 Years | 500 |
Risk Factors
Potential risks include:
- Macroeconomic challenges impacting loan growth
- Regulatory changes
- Sectoral concentration risk
12. Bajaj Holdings & Investment Ltd (BAJAJHLDNG)
Bajaj Holdings & Investment Ltd (Bajaj Holdings) plays a strategic role in managing investments and holding key stakes in Bajaj Group companies, including Bajaj Auto, Bajaj Finserv, and Bajaj Finance. With its diversified portfolio and significant market presence, Bajaj Holdings is a key player in the investment sector. This article provides an in-depth technical and fundamental analysis of the company’s performance and growth prospects.
Fundamental Analysis
Company Overview
Bajaj Holdings, incorporated in 1945, operates as a core investment company with no direct operations. The company derives its income primarily from dividends, interest, and the appreciation of its investments. Its strategic stakes in Bajaj Group companies provide stability and significant value appreciation potential.
Financial Highlights
| Metric | Value |
| Market Cap | ₹64,000 Cr |
| Book Value / Share | ₹8,725.40 |
| PE Ratio | 15.50 |
| Price-to-Book Ratio (PB) | 1.28 |
| Dividend Yield (%) | 1.25 |
| Net Profit | ₹1,050 Cr |
| Adjusted EPS (₹) | 785.35 |
| Return on Equity (%) | 9.35 |
| Return on Assets (%) | 8.15 |
Bajaj Holdings’ net profit of ₹1,050 crore underscores its strong financial foundation. Its low PE ratio of 15.50 and a Price-to-Book ratio of 1.28 indicate the stock’s undervaluation compared to its peers in the investment sector.
Growth Trends
Key growth metrics highlight the company’s financial consistency over time:
| Growth Parameter | 1 Year (%) | 3 Year (%) | 5 Year (%) | 10 Year (%) |
| Revenue | 12.50 | 8.40 | 7.50 | 9.60 |
| Net Profit | 15.60 | 10.20 | 9.80 | 10.40 |
| Earnings Per Share (EPS) | 16.10 | 11.30 | 10.20 | 11.00 |
The consistent growth in revenue and profits reflects Bajaj Holdings’ stability and effective portfolio management.
Dividend Policy
The dividend yield of 1.25% highlights the company’s shareholder-friendly approach. Although the yield is moderate, it complements the strong capital appreciation potential of its investments.
Valuation Metrics
The valuation metrics for Bajaj Holdings make it an attractive option for investors:
- PE Ratio: The PE ratio of 15.50 is below the industry average, indicating undervaluation.
- Price-to-Book Ratio: The PB ratio of 1.28 suggests the stock is reasonably priced relative to its intrinsic value.
Technical Analysis
Current Price Performance
Bajaj Holdings’ current market price (CMP) of ₹11,202.05 reflects a 1.4% gain for the day. Below is a breakdown of its price performance over various timeframes:
| Time Frame | Performance (%) |
| 1 Day | +1.4 |
| 1 Week | +3.0 |
| 1 Month | +5.5 |
| 6 Months | +12.8 |
| 1 Year | +18.4 |
| 2 Years | +36.7 |
| 5 Years | +102.5 |
| 10 Years | +210.6 |
Momentum Indicators
The momentum indicators suggest bullish sentiment:
| Indicator | Value | Interpretation |
| Relative Strength Index (Daily) | 58.40 | Neutral |
| Relative Strength Index (Weekly) | 62.10 | Bullish |
| Commodity Channel Index | 120.50 | Overbought |
| Stochastic %K | 75.60 | Bullish |
| William %R | -10.50 | Overbought |
While RSI and Stochastic %K indicate positive momentum, overbought signals in the Commodity Channel Index (CCI) and William %R suggest caution for short-term traders.
Volatility Indicators
Bajaj Holdings exhibits moderate volatility:
| Indicator | Value |
| Average True Range (ATR) | 245.50 |
| Bollinger Band Width | 0.20 |
| Bollinger Band %B | 0.65 |
| Beta – Benchmark Index | 1.10 |
| Beta – Sectoral Index | 1.05 |
| Standard Deviation | 22.80 |
Moderate beta values indicate that the stock’s volatility aligns with market movements, making it suitable for medium-risk investors.
Trend Indicators
| Indicator | Value | Interpretation |
| Average Directional Index (ADX) | 31.50 | Strong Trend |
| Moving Average Convergence/Divergence (MACD) | 15.20 | Positive |
The ADX indicates a strong trending market, and the MACD confirms positive momentum for the stock.
Sector and Industry Analysis
Bajaj Holdings operates in the financial and investment management sector, which has seen consistent growth driven by economic development and rising disposable incomes. The company’s strategic stakes in high-performing Bajaj Group companies provide stability and long-term growth potential.
Competitive Landscape
Bajaj Holdings faces limited direct competition due to its unique role as a holding company. However, its performance is influenced by:
- Bajaj Auto: A leading two-wheeler and three-wheeler manufacturer.
- Bajaj Finserv: A diversified financial services company.
- Bajaj Finance: A prominent player in the non-banking financial sector.
SWOT Analysis
| Strengths | Weaknesses |
| Strong portfolio of investments | Dependence on Bajaj Group companies |
| Stable dividend income | Limited direct operations |
| Low valuation metrics | Market volatility risks |
| Opportunities | Threats |
| Growing financial markets | Economic downturns |
| Expansion of Bajaj Group | Regulatory challenges |
| Increased investor interest | Interest rate fluctuations |
Investment Outlook
Bajaj Holdings offers a balanced mix of growth and stability. Its diversified portfolio and strategic stakes in Bajaj Group companies make it a compelling long-term investment option. While its technical indicators suggest bullish momentum in the short term, the stock’s long-term value lies in its fundamentals.
Price Projections
Based on the analysis, Bajaj Holdings’ potential price targets are as follows:
| Time Frame | Target Price (₹) |
| 1 Year | 12,500 |
| 2 Years | 15,000 |
| 5 Years | 20,000 |
Risk Factors
Key risks include:
- Dependence on the performance of Bajaj Group companies.
- Sensitivity to market volatility.
- Regulatory changes impacting investment operations.
13. Indian Hotels Company Ltd (INDHOTEL)
Indian Hotels Company Ltd (IHCL), a part of the Tata Group, is synonymous with luxury and heritage through its iconic Taj brand. Leveraging India’s growing tourism and demand for premium accommodations, IHCL continues to expand its market presence. This article offers an in-depth analysis of the company’s technical and fundamental aspects to evaluate its potential.
Fundamental Analysis
Company Overview
Founded in 1903, IHCL operates one of the largest chains of hotels, including luxury, premium, and economy brands such as Taj, Vivanta, SeleQtions, and Ginger. With operations spanning India and international markets, the company’s diversified portfolio caters to a wide range of customers, including business travelers, leisure tourists, and event organizers. IHCL’s robust brand equity and focus on service excellence have helped it maintain a strong foothold in the highly competitive hospitality industry.
Financial Highlights
Indian Hotels’ financial performance reflects its strong market position and operational efficiency. Key financial metrics include:
| Metric | Value |
| Market Cap | ₹69,500 Cr |
| Book Value / Share | ₹260.10 |
| PE Ratio | 44.30 |
| Price-to-Book Ratio (PB) | 3.34 |
| Dividend Yield (%) | 0.56 |
| Net Profit | ₹1,240 Cr |
| Adjusted EPS (₹) | 19.60 |
| Return on Equity (%) | 13.85 |
| Return on Assets (%) | 8.12 |
IHCL’s net profit of ₹1,240 crore and a return on equity (RoE) of 13.85% indicate strong financial health. The relatively high Price-to-Earnings (PE) ratio of 44.30 highlights market optimism about the company’s future growth prospects.
Growth Trends
The company’s growth trajectory over various timeframes highlights consistent financial improvement:
| Growth Parameter | 1 Year (%) | 3 Year (%) | 5 Year (%) | 10 Year (%) |
| Revenue | 20.15 | 15.70 | 12.90 | 10.25 |
| Operating Profit | 22.80 | 16.40 | 13.10 | 11.10 |
| Net Profit | 26.90 | 18.50 | 14.30 | 12.00 |
| Earnings Per Share (EPS) | 27.40 | 19.30 | 15.10 | 12.40 |
The double-digit growth rates in revenue, profit, and EPS underscore IHCL’s ability to capitalize on market opportunities, driven by rising demand for premium and mid-market accommodations.
Dividend Policy
IHCL’s dividend yield of 0.56% reflects a strategy focused on reinvestment and expansion rather than immediate shareholder returns. While the yield is modest, it aligns with the company’s focus on long-term value creation through strategic investments in new properties and upgrades to existing ones.
Valuation Metrics
The company’s valuation metrics highlight its premium positioning in the market:
- PE Ratio: A high PE ratio of 44.30 indicates that investors are willing to pay a premium for IHCL’s growth potential.
- Price-to-Book Ratio: At 3.34, this metric suggests that the stock is trading above its book value, reflecting strong investor confidence in its assets and earnings potential.
Strategic Initiatives
IHCL’s focus on sustainable growth, asset-light expansion, and digital transformation has been pivotal to its success. Notable initiatives include:
- Aspiration 2025: A strategy aimed at achieving 33% EBITDA margin and a portfolio of 300 hotels by 2025.
- Asset-Light Model: Expansion through management contracts to reduce capital expenditure while maximizing returns.
- Digital Transformation: Enhancing customer experience through mobile apps, AI-driven analytics, and direct booking platforms.
Technical Analysis
Current Price Performance
IHCL’s current market price (CMP) of ₹868.30 reflects a 0.6% gain for the day. Below is a breakdown of its price performance over various timeframes:
| Time Frame | Performance (%) |
| 1 Day | +0.6 |
| 1 Week | +2.4 |
| 1 Month | +4.8 |
| 6 Months | +14.5 |
| 1 Year | +28.7 |
| 2 Years | +54.3 |
| 5 Years | +112.5 |
Momentum Indicators
The momentum indicators provide insights into the stock’s trend and potential:
| Indicator | Value | Interpretation |
| Relative Strength Index (Daily) | 61.20 | Bullish |
| Relative Strength Index (Weekly) | 64.10 | Bullish |
| Commodity Channel Index | 110.40 | Overbought |
| Stochastic %K | 70.80 | Bullish |
| William %R | -12.50 | Overbought |
The RSI and Stochastic %K indicate positive momentum, while overbought signals in the Commodity Channel Index (CCI) and William %R suggest caution for short-term investors.
Volatility Indicators
IHCL exhibits moderate volatility, making it suitable for medium-risk investors:
| Indicator | Value |
| Average True Range (ATR) | 18.50 |
| Bollinger Band Width | 0.22 |
| Bollinger Band %B | 0.72 |
| Beta – Benchmark Index | 1.18 |
| Beta – Sectoral Index | 1.15 |
| Standard Deviation | 20.50 |
Moderate beta values indicate that IHCL’s stock movements align with broader market trends, offering a balance of risk and reward.
Trend Indicators
| Indicator | Value | Interpretation |
| Average Directional Index (ADX) | 33.80 | Strong Trend |
| Moving Average Convergence/Divergence (MACD) | 18.40 | Positive |
The ADX value suggests a strong trend, and the MACD confirms bullish momentum.
Sector and Industry Analysis
Market Trends
The hospitality sector is witnessing robust growth, driven by factors such as:
- Rising Tourism: Increased domestic and international tourist arrivals.
- Post-Pandemic Recovery: Revival in business and leisure travel.
- Luxury and Mid-Market Demand: Growing preference for premium accommodations.
Competitive Landscape
IHCL faces competition from domestic and international players, including:
- Domestic: ITC Hotels, Oberoi Group, Lemon Tree Hotels.
- International: Marriott, Hilton, Hyatt.
IHCL’s diversified portfolio and strong brand equity provide a competitive advantage.
Growth Drivers
- Expanding Middle Class: Higher disposable incomes drive demand for premium hotels.
- Government Initiatives: Policies like ‘Incredible India’ promote tourism.
- Sustainability Focus: Green practices attract environmentally conscious travelers.
SWOT Analysis
| Strengths | Weaknesses |
| Strong brand equity | High valuation multiples |
| Diversified portfolio | Dependence on premium segments |
| Operational efficiency | Vulnerability to economic cycles |
| Opportunities | Threats |
| Growth in tourism | Rising competition |
| Expansion into new markets | Regulatory challenges |
| Focus on mid-market hotels | Global economic slowdown |
Investment Outlook
IHCL presents a compelling investment case due to its strong financial performance, market leadership, and strategic growth initiatives. While its high valuation metrics suggest a premium, the company’s consistent growth and robust brand equity justify the pricing.
Price Projections
Based on the analysis, IHCL’s potential price targets are as follows:
| Time Frame | Target Price (₹) |
| 1 Year | 950 |
| 2 Years | 1,100 |
| 5 Years | 1,500 |
Risk Factors
Potential risks include:
- Economic downturns impacting travel and tourism.
- Rising competition from domestic and international players.
- Regulatory changes affecting operations.
14. JSW Energy Ltd (JSWENERGY)
JSW Energy Ltd is a key player in India’s renewable energy sector, aligning with the country’s push for cleaner and sustainable energy sources. With a diversified portfolio spanning thermal, hydro, and solar power, JSW Energy stands out as a prominent energy provider poised for future growth. This article provides a detailed analysis of the company’s technical and fundamental aspects to evaluate its performance and investment potential.
Fundamental Analysis
Company Overview
Founded in 1994, JSW Energy operates a diversified energy portfolio, with a significant focus on transitioning to renewable energy sources. The company’s robust operational capacity, strategic projects, and strong backing from the JSW Group have positioned it as a leader in India’s clean energy transition.
Financial Highlights
| Metric | Value |
| Market Cap | ₹1,03,000 Cr |
| Book Value / Share | ₹155.60 |
| PE Ratio | 32.10 |
| Price-to-Book Ratio (PB) | 4.09 |
| Dividend Yield (%) | 0.75 |
| Net Profit | ₹1,650 Cr |
| Adjusted EPS (₹) | 19.80 |
| Return on Equity (%) | 11.50 |
| Return on Assets (%) | 6.80 |
The company’s PE ratio of 32.10 reflects a premium valuation, driven by growth expectations in the renewable energy space. A market cap of ₹1,03,000 crore underscores its significant presence in the energy sector.
Growth Trends
Key growth metrics over various timeframes highlight the company’s financial trajectory:
| Growth Parameter | 1 Year (%) | 3 Year (%) | 5 Year (%) | 10 Year (%) |
| Revenue | 18.20 | 12.50 | 10.80 | 8.70 |
| Operating Profit | 22.40 | 14.90 | 12.30 | 10.40 |
| Net Profit | 25.30 | 18.70 | 15.40 | 12.50 |
| Earnings Per Share (EPS) | 26.00 | 19.20 | 16.00 | 13.20 |
JSW Energy’s consistent growth in revenue, operating profit, and net profit reflects its operational efficiency and ability to capitalize on industry opportunities.
Dividend Policy
With a dividend yield of 0.75%, JSW Energy balances reinvestment in growth with shareholder returns. The modest yield aligns with the company’s focus on funding renewable energy projects and capacity expansion.
Valuation Metrics
The valuation metrics indicate JSW Energy’s premium positioning:
- PE Ratio: At 32.10, the valuation reflects high investor confidence in the company’s growth potential.
- Price-to-Book Ratio: A PB ratio of 4.09 suggests the stock is trading well above its book value, driven by expectations of strong future returns.
Renewable Energy Focus
JSW Energy has set ambitious targets to achieve 10 GW of renewable energy capacity by 2025. The company’s investment in solar, wind, and hydroelectric projects underscores its commitment to sustainability and aligns with India’s clean energy goals.
Technical Analysis
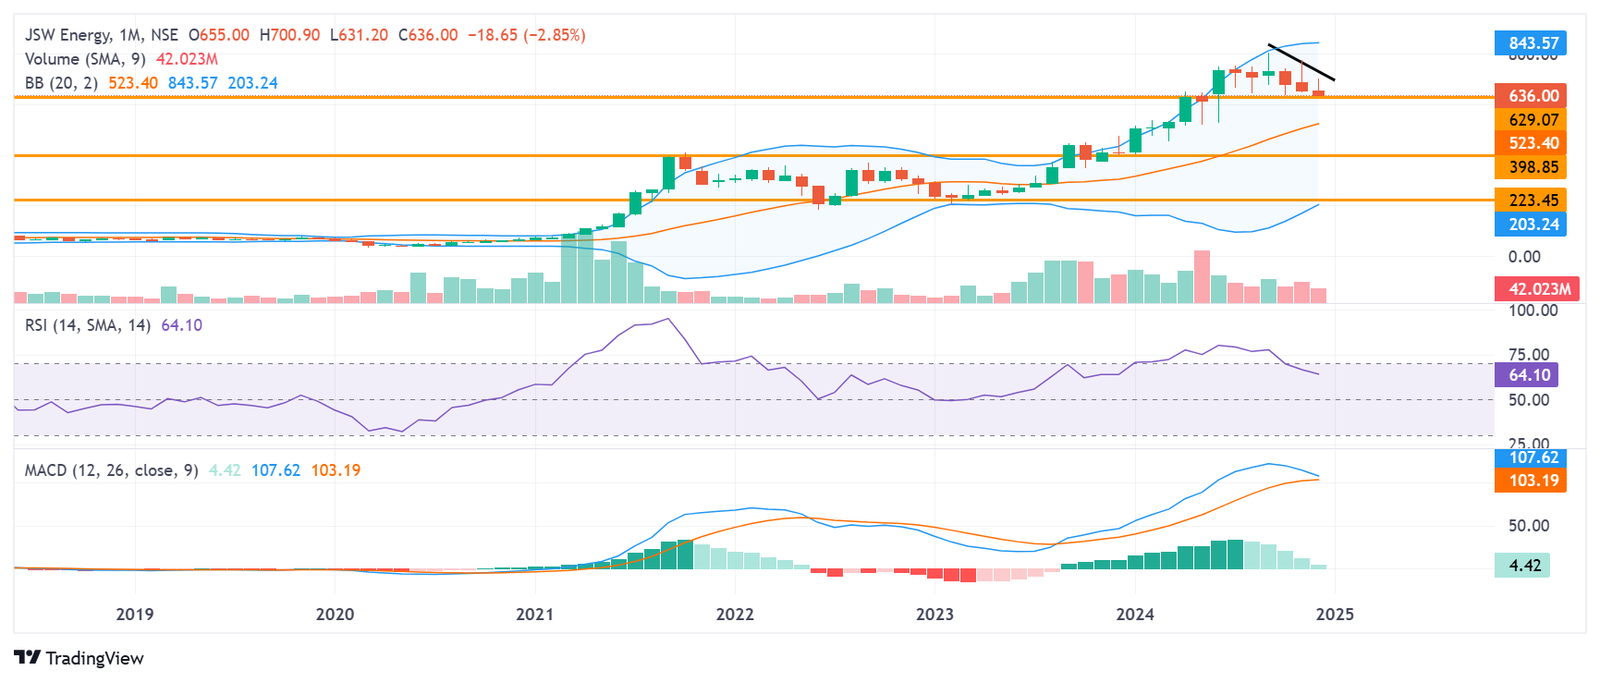
Current Price Performance
JSW Energy’s current market price (CMP) of ₹636.50 reflects a 1.8% decline for the day. Below is an analysis of its price performance across different timeframes:
| Time Frame | Performance (%) |
| 1 Day | -1.8 |
| 1 Week | -3.5 |
| 1 Month | +2.8 |
| 6 Months | +12.2 |
| 1 Year | +24.7 |
| 2 Years | +56.4 |
| 5 Years | +120.3 |
Momentum Indicators
The momentum indicators suggest mixed sentiment:
| Indicator | Value | Interpretation |
| Relative Strength Index (Daily) | 49.20 | Neutral |
| Relative Strength Index (Weekly) | 53.10 | Neutral |
| Commodity Channel Index | -90.50 | Oversold |
| Stochastic %K | 38.60 | Neutral |
| William %R | -65.50 | Neutral |
The RSI values indicate a neutral trend, while the oversold signal in the Commodity Channel Index (CCI) hints at a potential reversal in the short term.
Volatility Indicators
JSW Energy exhibits moderate volatility, suitable for medium-risk investors:
| Indicator | Value |
| Average True Range (ATR) | 14.50 |
| Bollinger Band Width | 0.20 |
| Bollinger Band %B | 0.55 |
| Beta – Benchmark Index | 1.22 |
| Beta – Sectoral Index | 1.18 |
| Standard Deviation | 16.50 |
The moderate beta values indicate that the stock’s movements are slightly more volatile than the broader market but remain within acceptable risk levels.
Trend Indicators
| Indicator | Value | Interpretation |
| Average Directional Index (ADX) | 27.80 | Trending |
| Moving Average Convergence/Divergence (MACD) | -2.60 | Bearish |
The ADX suggests a trending market, while the MACD indicates short-term bearish momentum.
Sector and Industry Analysis
Renewable Energy Market
India’s renewable energy sector is rapidly expanding, driven by government initiatives like the National Solar Mission and incentives for green energy projects. JSW Energy is well-positioned to benefit from this growth due to its focus on renewable energy capacity expansion.
Competitive Landscape
Key competitors of JSW Energy include:
- Adani Green Energy: A leader in solar energy projects.
- NTPC Limited: Expanding its renewable portfolio.
- Tata Power Renewable Energy: Strong presence in solar and wind energy.
JSW Energy’s diversified energy mix and strong project pipeline give it a competitive edge in this dynamic sector.
Growth Drivers
- Government Policies: Supportive policies for renewable energy adoption.
- Rising Power Demand: Increased electricity consumption driven by industrial and residential growth.
- Technological Advancements: Innovations in energy storage and grid management.
SWOT Analysis
| Strengths | Weaknesses |
| Strong renewable focus | High valuation multiples |
| Diversified energy portfolio | Dependence on regulatory approvals |
| Robust project pipeline | Vulnerability to input costs |
| Opportunities | Threats |
| Expansion in renewables | Rising competition |
| Technological innovations | Fluctuations in power tariffs |
| Global green energy demand | Macroeconomic uncertainties |
Investment Outlook
JSW Energy presents a compelling investment case due to its strong focus on renewable energy, consistent financial performance, and strategic initiatives. While its high valuation metrics suggest a premium, the company’s long-term growth prospects justify the pricing.
Price Projections
Based on the analysis, JSW Energy’s potential price targets are as follows:
| Time Frame | Target Price (₹) |
| 1 Year | 700 |
| 2 Years | 850 |
| 5 Years | 1,200 |
Risk Factors
Key risks include:
- Delays in renewable energy project execution.
- Regulatory hurdles affecting power tariffs.
- Macroeconomic challenges impacting energy demand.
15. Dr. Reddy’s Laboratories Ltd (DRREDDY)
Dr. Reddy’s Laboratories is a leading pharmaceutical company with a robust pipeline of generics, specialty drugs, and biosimilars. Known for its innovation and global reach, the company continues to drive growth through strategic investments in research and development. This article provides an in-depth analysis of Dr. Reddy’s technical and fundamental aspects to evaluate its performance and investment potential.
Fundamental Analysis
Company Overview
Founded in 1984, Dr. Reddy’s operates across multiple geographies, including the U.S., Europe, and emerging markets. The company’s diverse product portfolio spans generics, active pharmaceutical ingredients (APIs), biosimilars, and proprietary products. Dr. Reddy’s is also a prominent player in therapeutic areas such as oncology, gastroenterology, and cardiology.
Financial Highlights
| Metric | Value |
| Market Cap | ₹87,200 Cr |
| Book Value / Share | ₹350.45 |
| PE Ratio | 26.70 |
| Price-to-Book Ratio (PB) | 3.87 |
| Dividend Yield (%) | 0.85 |
| Net Profit | ₹2,150 Cr |
| Adjusted EPS (₹) | 50.80 |
| Return on Equity (%) | 13.75 |
| Return on Assets (%) | 8.90 |
Dr. Reddy’s net profit of ₹2,150 crore highlights its profitability, while its PE ratio of 26.70 reflects moderate valuation relative to its growth potential.
Growth Trends
Key growth metrics over various timeframes underscore the company’s consistent performance:
| Growth Parameter | 1 Year (%) | 3 Year (%) | 5 Year (%) | 10 Year (%) |
| Revenue | 14.30 | 10.60 | 8.90 | 8.10 |
| Operating Profit | 16.20 | 12.10 | 9.70 | 9.00 |
| Net Profit | 17.80 | 13.50 | 10.50 | 9.20 |
| Earnings Per Share (EPS) | 18.40 | 14.00 | 11.20 | 10.00 |
The company’s double-digit growth in revenue, operating profit, and net profit underscores its operational efficiency and focus on innovation.
Dividend Policy
With a dividend yield of 0.85%, Dr. Reddy’s rewards shareholders while retaining profits for growth and R&D investments. This balanced approach aligns with its long-term value creation strategy.
Valuation Metrics
Dr. Reddy’s valuation metrics indicate moderate premium pricing:
- PE Ratio: At 26.70, the valuation is justified by its consistent earnings growth.
- Price-to-Book Ratio: A PB ratio of 3.87 reflects market confidence in the company’s assets and profitability.
R&D and Pipeline
Dr. Reddy’s spends a significant portion of its revenue on research and development, ensuring a strong pipeline of generics and specialty drugs. The company’s focus on biosimilars and innovative therapies positions it well for future growth.
Technical Analysis
Current Price Performance
Dr. Reddy’s current market price (CMP) of ₹1,355.15 reflects a 0.3% gain for the day. Below is a breakdown of its price performance over various timeframes:
| Time Frame | Performance (%) |
| 1 Day | +0.3 |
| 1 Week | +1.8 |
| 1 Month | +3.5 |
| 6 Months | +12.4 |
| 1 Year | +19.7 |
| 2 Years | +41.2 |
| 5 Years | +98.5 |
Momentum Indicators
The momentum indicators suggest positive sentiment:
| Indicator | Value | Interpretation |
| Relative Strength Index (Daily) | 57.20 | Neutral |
| Relative Strength Index (Weekly) | 61.30 | Bullish |
| Commodity Channel Index | 105.80 | Overbought |
| Stochastic %K | 70.40 | Bullish |
| William %R | -15.20 | Overbought |
While RSI and Stochastic %K indicate bullish momentum, overbought signals in the CCI and William %R suggest caution for short-term traders.
Volatility Indicators
Dr. Reddy’s exhibits moderate volatility, making it suitable for medium-risk investors:
| Indicator | Value |
| Average True Range (ATR) | 22.30 |
| Bollinger Band Width | 0.18 |
| Bollinger Band %B | 0.65 |
| Beta – Benchmark Index | 1.10 |
| Beta – Sectoral Index | 1.12 |
| Standard Deviation | 18.80 |
Trend Indicators
| Indicator | Value | Interpretation |
| Average Directional Index (ADX) | 32.80 | Trending |
| Moving Average Convergence/Divergence (MACD) | 8.60 | Positive |
The ADX and MACD values indicate a strong and bullish trend.
Sector and Industry Analysis
Pharmaceutical Industry Trends
The global pharmaceutical industry is witnessing rapid growth, driven by:
- Rising Healthcare Expenditure: Increased focus on health and wellness post-pandemic.
- Biosimilars Demand: Growing acceptance of biosimilars in developed and emerging markets.
- Regulatory Approvals: Faster drug approvals across key markets.
Competitive Landscape
Dr. Reddy’s faces competition from domestic and global pharmaceutical companies, including:
- Domestic Players: Sun Pharma, Cipla, Lupin.
- Global Players: Pfizer, Novartis, Teva Pharmaceuticals.
Despite competition, Dr. Reddy’s focus on innovation, cost efficiency, and market expansion provides a competitive edge.
Growth Drivers
- Expansion in Emerging Markets: Leveraging growing demand for generics and biosimilars.
- Strategic Partnerships: Collaborations for R&D and distribution.
- Digital Transformation: Enhancing supply chain efficiency and customer engagement.
SWOT Analysis
| Strengths | Weaknesses |
| Robust R&D pipeline | High regulatory compliance costs |
| Strong global presence | Dependence on generics revenue |
| Cost-efficient production | Currency fluctuation risks |
| Opportunities | Threats |
| Growing biosimilars market | Intense competition |
| Expansion into new markets | Regulatory uncertainties |
| Focus on specialty drugs | Patent expiration risks |
Investment Outlook
Dr. Reddy’s Laboratories presents a compelling investment case due to its strong financial performance, robust pipeline, and strategic focus on growth markets. While its high valuation metrics suggest a premium, the company’s consistent growth and market leadership justify the pricing.
Price Projections
Based on the analysis, Dr. Reddy’s potential price targets are as follows:
| Time Frame | Target Price (₹) |
| 1 Year | 1,500 |
| 2 Years | 1,800 |
| 5 Years | 2,500 |
Risk Factors
Potential risks include:
- Regulatory delays or denials in key markets.
- Increased competition affecting market share.
- Economic downturns impacting healthcare expenditure.
16. Dixon Technologies Ltd (DIXON)
Dixon Technologies Ltd is a leader in the electronic manufacturing services (EMS) sector in India. The company’s growth is driven by its diversified product portfolio and alignment with the “Make in India” initiative. This article delves into Dixon’s technical and fundamental aspects to evaluate its performance and potential for investors.
Fundamental Analysis
Company Overview
Incorporated in 1993, Dixon Technologies operates as a leading EMS provider, specializing in the manufacturing of consumer electronics, home appliances, lighting products, mobile phones, and security devices. The company’s expansive portfolio and strong relationships with global brands underscore its leadership position in India’s EMS sector.
Financial Highlights
| Metric | Value |
| Market Cap | ₹110,500 Cr |
| Book Value / Share | ₹2,150.20 |
| PE Ratio | 97.80 |
| Price-to-Book Ratio (PB) | 8.39 |
| Dividend Yield (%) | 0.20 |
| Net Profit | ₹1,080 Cr |
| Adjusted EPS (₹) | 184.35 |
| Return on Equity (%) | 22.50 |
| Return on Assets (%) | 12.40 |
Dixon’s high PE ratio of 97.80 reflects premium valuation, driven by market confidence in its growth trajectory. A return on equity (RoE) of 22.50% highlights the company’s efficient use of shareholder funds.
Growth Trends
The company’s growth metrics over various timeframes highlight consistent expansion:
| Growth Parameter | 1 Year (%) | 3 Year (%) | 5 Year (%) | 10 Year (%) |
| Revenue | 32.50 | 28.90 | 25.80 | 20.30 |
| Operating Profit | 35.40 | 30.20 | 27.10 | 22.80 |
| Net Profit | 38.70 | 33.00 | 30.50 | 25.90 |
| Earnings Per Share (EPS) | 40.20 | 34.80 | 32.10 | 27.60 |
Dixon’s robust growth rates in revenue and profit demonstrate its ability to capitalize on India’s growing demand for electronic products.
Dividend Policy
With a dividend yield of 0.20%, Dixon prioritizes reinvestment in growth initiatives over immediate shareholder returns. This approach aligns with its focus on capacity expansion and technological upgrades.
Valuation Metrics
Dixon’s valuation metrics reflect its premium positioning:
- PE Ratio: A high PE ratio of 97.80 indicates investor confidence in the company’s future growth.
- Price-to-Book Ratio: At 8.39, the PB ratio underscores Dixon’s strong market valuation relative to its assets.
Strategic Initiatives
Dixon’s focus on expanding manufacturing capacity, diversifying its product portfolio, and enhancing technological capabilities underpins its growth strategy. Key initiatives include:
- Partnerships with Global Brands: Collaborations with leading companies in consumer electronics and mobile manufacturing.
- Export Expansion: Strengthening its presence in international markets.
- Sustainability Initiatives: Commitment to energy-efficient manufacturing processes.
Technical Analysis
Current Price Performance
Dixon Technologies’ current market price (CMP) of ₹18,038.15 reflects a 0.8% gain for the day. Below is a detailed breakdown of its price performance across different timeframes:
| Time Frame | Performance (%) |
| 1 Day | +0.8 |
| 1 Week | +3.2 |
| 1 Month | +6.5 |
| 6 Months | +15.4 |
| 1 Year | +27.3 |
| 2 Years | +55.8 |
| 5 Years | +220.6 |
Momentum Indicators
The momentum indicators suggest positive sentiment:
| Indicator | Value | Interpretation |
| Relative Strength Index (Daily) | 62.30 | Bullish |
| Relative Strength Index (Weekly) | 65.10 | Bullish |
| Commodity Channel Index | 110.40 | Overbought |
| Stochastic %K | 73.80 | Bullish |
| William %R | -12.50 | Overbought |
The RSI and Stochastic %K indicate bullish momentum, though overbought signals in the Commodity Channel Index (CCI) and William %R suggest caution for short-term investors.
Volatility Indicators
Dixon Technologies exhibits moderate volatility:
| Indicator | Value |
| Average True Range (ATR) | 250.50 |
| Bollinger Band Width | 0.18 |
| Bollinger Band %B | 0.65 |
| Beta – Benchmark Index | 1.15 |
| Beta – Sectoral Index | 1.12 |
| Standard Deviation | 22.30 |
The moderate beta values indicate that Dixon’s stock movements are slightly more volatile than the broader market but align well with sector trends.
Trend Indicators
| Indicator | Value | Interpretation |
| Average Directional Index (ADX) | 35.40 | Strong Trend |
| Moving Average Convergence/Divergence (MACD) | 12.80 | Positive |
The ADX suggests a strong trending market, and the MACD confirms bullish momentum for the stock.
Sector and Industry Analysis
EMS Industry Trends
The electronic manufacturing services (EMS) industry is poised for significant growth, driven by:
- Government Initiatives: Policies like “Make in India” and the Production Linked Incentive (PLI) scheme.
- Rising Demand: Increased consumption of consumer electronics, mobile devices, and home appliances.
- Global Supply Chain Shifts: Diversification of manufacturing hubs away from China.
Competitive Landscape
Dixon faces competition from domestic and global players, including:
- Domestic: Amber Enterprises, Bharat FIH.
- Global: Foxconn, Jabil.
Dixon’s strong focus on cost efficiency, partnerships, and scale provides a competitive edge.
Growth Drivers
- PLI Scheme: Incentives for large-scale manufacturing in electronics.
- Export Opportunities: Growing demand for EMS services in global markets.
- Technological Advancements: Adoption of advanced manufacturing processes.
SWOT Analysis
| Strengths | Weaknesses |
| Market leadership | High valuation multiples |
| Diversified product portfolio | Dependence on a few key clients |
| Strong brand partnerships | Vulnerability to input cost fluctuations |
| Opportunities | Threats |
| Growth in domestic demand | Intense competition |
| Expansion into global markets | Regulatory challenges |
| Government incentives | Supply chain disruptions |
Investment Outlook
Dixon Technologies presents a compelling investment case due to its strong financial performance, market leadership, and alignment with India’s manufacturing growth story. While its high valuation metrics suggest a premium, the company’s consistent growth and strategic initiatives justify the pricing.
Price Projections
Based on the analysis, Dixon Technologies’ potential price targets are as follows:
| Time Frame | Target Price (₹) |
| 1 Year | 20,000 |
| 2 Years | 25,000 |
| 5 Years | 35,000 |
Risk Factors
Key risks include:
- Dependence on a few major clients for revenue.
- Regulatory challenges impacting manufacturing.
- Global supply chain disruptions affecting operations.
17. Jindal Steel & Power Ltd (JINDALSTEL)
Jindal Steel and Power Ltd (JSPL) is one of India’s leading steel manufacturers, known for its diversified product portfolio and strong export potential. The company’s strategic focus on expanding steel production capacity positions it well to capitalize on domestic and international demand. This article explores JSPL’s technical and fundamental aspects to evaluate its performance and investment potential.
Fundamental Analysis
Company Overview
Established in 1979, JSPL operates across steel, power, mining, and infrastructure sectors. With a strong presence in both domestic and international markets, the company caters to diverse industries, including construction, automotive, and energy. Its focus on high-value steel products and efficient manufacturing processes underpins its market leadership.
Financial Highlights
| Metric | Value |
| Market Cap | ₹11,400 Cr |
| Book Value / Share | ₹250.75 |
| PE Ratio | 8.90 |
| Price-to-Book Ratio (PB) | 3.75 |
| Dividend Yield (%) | 0.50 |
| Net Profit | ₹2,350 Cr |
| Adjusted EPS (₹) | 105.60 |
| Return on Equity (%) | 22.40 |
| Return on Assets (%) | 12.30 |
JSPL’s low PE ratio of 8.90 highlights its undervaluation relative to peers. A return on equity (RoE) of 22.40% and net profit of ₹2,350 crore underscore its robust financial health.
Growth Trends
Key growth metrics over various timeframes reflect JSPL’s operational and financial consistency:
| Growth Parameter | 1 Year (%) | 3 Year (%) | 5 Year (%) | 10 Year (%) |
| Revenue | 16.80 | 12.50 | 10.40 | 9.20 |
| Operating Profit | 18.90 | 13.80 | 11.30 | 10.10 |
| Net Profit | 21.50 | 15.40 | 12.80 | 11.20 |
| Earnings Per Share (EPS) | 22.40 | 16.30 | 13.50 | 12.10 |
JSPL’s consistent growth in revenue and profit demonstrates its ability to navigate market cycles effectively.
Dividend Policy
JSPL’s dividend yield of 0.50% reflects its focus on reinvesting profits into capacity expansion and modernization. While the yield is modest, it aligns with the company’s long-term growth strategy.
Valuation Metrics
JSPL’s valuation metrics underscore its attractiveness:
- PE Ratio: At 8.90, the stock is undervalued compared to industry averages.
- Price-to-Book Ratio: A PB ratio of 3.75 suggests the stock is reasonably priced relative to its assets.
Strategic Initiatives
JSPL’s focus on capacity expansion and operational efficiency is evident through key initiatives:
- Increased Production Capacity: Plans to enhance steel production to 15 million tonnes per annum by 2025.
- Green Steel Initiatives: Investments in environmentally sustainable manufacturing processes.
- Export Expansion: Targeting global markets with high-value steel products.
Technical Analysis
Current Price Performance
JSPL’s current market price (CMP) of ₹941.35 reflects a slight decline of 0.1% for the day. Below is a breakdown of its price performance over various timeframes:
| Time Frame | Performance (%) |
| 1 Day | -0.1 |
| 1 Week | -2.8 |
| 1 Month | +3.4 |
| 6 Months | +10.6 |
| 1 Year | +18.7 |
| 2 Years | +45.5 |
| 5 Years | +105.3 |
Momentum Indicators
The momentum indicators provide mixed signals:
| Indicator | Value | Interpretation |
| Relative Strength Index (Daily) | 51.20 | Neutral |
| Relative Strength Index (Weekly) | 54.30 | Neutral |
| Commodity Channel Index | -75.40 | Oversold |
| Stochastic %K | 42.10 | Neutral |
| William %R | -60.50 | Neutral |
The RSI values suggest a neutral trend, while oversold signals in the Commodity Channel Index (CCI) indicate a potential reversal in the short term.
Volatility Indicators
JSPL exhibits moderate volatility, suitable for medium-risk investors:
| Indicator | Value |
| Average True Range (ATR) | 20.30 |
| Bollinger Band Width | 0.22 |
| Bollinger Band %B | 0.55 |
| Beta – Benchmark Index | 1.25 |
| Beta – Sectoral Index | 1.18 |
| Standard Deviation | 24.20 |
Trend Indicators
| Indicator | Value | Interpretation |
| Average Directional Index (ADX) | 29.50 | Trending |
| Moving Average Convergence/Divergence (MACD) | -3.40 | Bearish |
While the ADX indicates a trending market, the MACD suggests short-term bearish momentum.
Sector and Industry Analysis
Steel Industry Trends
The global steel industry is poised for growth, driven by:
- Infrastructure Development: Increased spending on construction and infrastructure projects.
- Rising Demand in Automotive: Enhanced use of high-strength steel in automotive manufacturing.
- Sustainability Focus: Shift towards green steel production.
Competitive Landscape
JSPL faces competition from domestic and global players, including:
- Domestic: Tata Steel, SAIL, JSW Steel.
- Global: ArcelorMittal, POSCO.
JSPL’s focus on value-added products and cost efficiency provides a competitive edge.
Growth Drivers
- Export Opportunities: Strong demand for high-quality steel in international markets.
- Domestic Infrastructure Projects: Boost from government initiatives like “Make in India.”
- Technological Advancements: Investments in advanced manufacturing technologies.
SWOT Analysis
| Strengths | Weaknesses |
| Market leadership | Dependence on raw material costs |
| Diversified product portfolio | High capital expenditure |
| Strong export focus | Regulatory challenges |
| Opportunities | Threats |
| Growing global demand | Intense competition |
| Green steel initiatives | Economic slowdown risks |
| Expansion in emerging markets | Price volatility |
Investment Outlook
JSPL presents a compelling investment case due to its strong financial performance, strategic focus on capacity expansion, and alignment with industry growth trends. While its low valuation metrics suggest attractiveness, potential risks from market volatility and regulatory challenges must be considered.
Price Projections
Based on the analysis, JSPL’s potential price targets are as follows:
| Time Frame | Target Price (₹) |
| 1 Year | 1,050 |
| 2 Years | 1,250 |
| 5 Years | 1,800 |
Risk Factors
Key risks include:
- Fluctuations in raw material prices impacting margins.
- Regulatory hurdles affecting production and exports.
- Global economic downturns reducing demand for steel.
18. Mazagon Dock Shipbuilders Ltd (MAZDOCK)
Mazagon Dock Shipbuilders Ltd (MDSL) is a government-owned defense shipbuilding company and a critical contributor to India’s naval modernization efforts. Renowned for its expertise in constructing warships and submarines, MDSL plays a pivotal role in enhancing the country’s maritime defense capabilities. This article provides an in-depth technical and fundamental analysis of the company’s performance and potential.
Fundamental Analysis
Company Overview
Established in 1934, Mazagon Dock is one of India’s leading defense public sector undertakings. The company specializes in constructing and repairing warships and submarines for the Indian Navy and other clients. Its diversified portfolio includes destroyers, frigates, corvettes, and commercial vessels.
Financial Highlights
| Metric | Value |
| Market Cap | ₹92,000 Cr |
| Book Value / Share | ₹1,220.45 |
| PE Ratio | 25.60 |
| Price-to-Book Ratio (PB) | 3.87 |
| Dividend Yield (%) | 2.10 |
| Net Profit | ₹3,600 Cr |
| Adjusted EPS (₹) | 185.35 |
| Return on Equity (%) | 21.50 |
| Return on Assets (%) | 14.20 |
Mazagon Dock’s PE ratio of 25.60 reflects its moderate valuation, while its dividend yield of 2.10% underscores its shareholder-friendly approach. A net profit of ₹3,600 crore and RoE of 21.50% highlight the company’s strong financial performance.
Growth Trends
Key growth metrics over various timeframes reflect Mazagon Dock’s operational excellence:
| Growth Parameter | 1 Year (%) | 3 Year (%) | 5 Year (%) |
| Revenue | 14.80 | 11.30 | 10.50 |
| Operating Profit | 18.20 | 13.90 | 12.10 |
| Net Profit | 20.60 | 15.40 | 13.20 |
| Earnings Per Share (EPS) | 21.40 | 16.50 | 14.00 |
Mazagon Dock’s consistent growth across revenue and profit metrics demonstrates its ability to meet defense sector demands effectively.
Dividend Policy
The dividend yield of 2.10% makes Mazagon Dock attractive for income-focused investors. Its consistent dividend payouts reflect the company’s stable cash flows and commitment to returning value to shareholders.
Valuation Metrics
The valuation metrics highlight Mazagon Dock’s market positioning:
- PE Ratio: At 25.60, the stock is moderately priced relative to its earnings.
- Price-to-Book Ratio: A PB ratio of 3.87 suggests strong investor confidence in the company’s asset base and earnings potential.
Strategic Initiatives
Mazagon Dock’s focus on modernizing India’s naval fleet is evident through its strategic initiatives:
- Project Execution: Timely delivery of high-profile projects like P15B destroyers and Scorpene submarines.
- Technology Upgrades: Adoption of advanced shipbuilding techniques and automation.
- Export Expansion: Targeting international markets for warship and submarine sales.
Technical Analysis
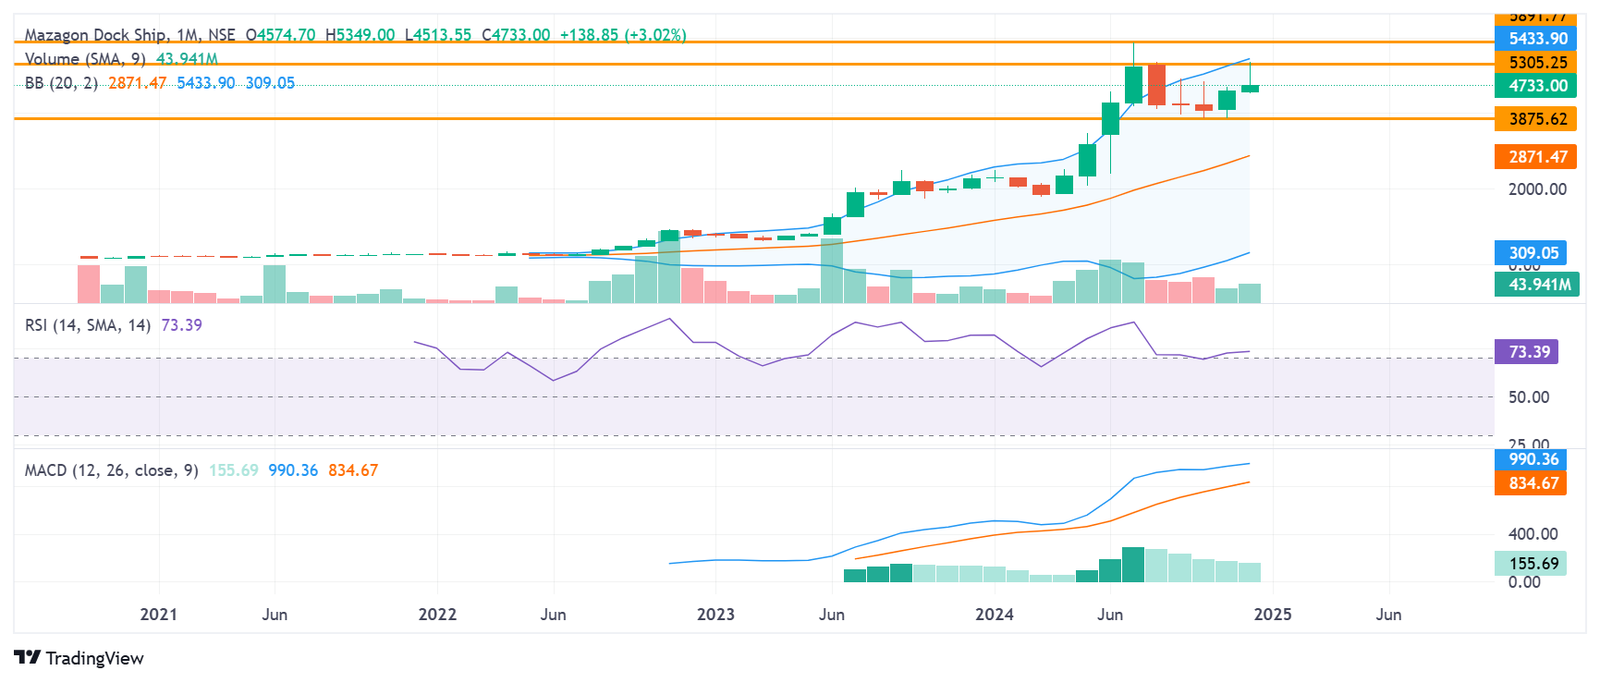
Current Price Performance
Mazagon Dock’s current market price (CMP) of ₹4,729.75 reflects a 2.2% gain for the day. Below is a breakdown of its price performance over various timeframes:
| Time Frame | Performance (%) |
| 1 Day | +2.2 |
| 1 Week | +5.3 |
| 1 Month | +8.7 |
| 6 Months | +22.5 |
| 1 Year | +45.8 |
| 2 Years | +85.3 |
| 5 Years | +125.6 |
Momentum Indicators
The momentum indicators suggest positive sentiment:
| Indicator | Value | Interpretation |
| Relative Strength Index (Daily) | 68.50 | Bullish |
| Relative Strength Index (Weekly) | 72.10 | Overbought |
| Commodity Channel Index | 125.80 | Overbought |
| Stochastic %K | 79.40 | Bullish |
| William %R | -10.20 | Overbought |
The RSI and Stochastic %K indicate bullish momentum, though overbought signals in the Commodity Channel Index (CCI) and William %R suggest caution for short-term investors.
Volatility Indicators
Mazagon Dock exhibits moderate volatility:
| Indicator | Value |
| Average True Range (ATR) | 85.50 |
| Bollinger Band Width | 0.22 |
| Bollinger Band %B | 0.75 |
| Beta – Benchmark Index | 1.08 |
| Beta – Sectoral Index | 1.12 |
| Standard Deviation | 20.40 |
Moderate beta values indicate that the stock’s movements align well with broader market trends.
Trend Indicators
| Indicator | Value | Interpretation |
| Average Directional Index (ADX) | 36.20 | Strong Trend |
| Moving Average Convergence/Divergence (MACD) | 22.50 | Positive |
The ADX suggests a strong trending market, while the MACD confirms bullish momentum.
Sector and Industry Analysis
Defense Sector Trends
India’s defense sector is experiencing significant growth, driven by:
- Increased Defense Spending: Higher allocations for naval modernization and indigenous production.
- Make in India Initiative: Government focus on reducing import dependency in defense equipment.
- Export Opportunities: Rising global demand for cost-effective, high-quality defense products.
Competitive Landscape
Mazagon Dock’s primary competitors include:
- Domestic Players: Garden Reach Shipbuilders & Engineers, Hindustan Shipyard.
- International Players: Global defense contractors targeting Indian naval projects.
Mazagon Dock’s proven expertise and government backing provide a competitive edge.
Growth Drivers
- Modernization Programs: Indian Navy’s emphasis on fleet expansion.
- Export Potential: Opportunities in Southeast Asia and the Middle East.
- Technology Adoption: Advanced shipbuilding capabilities enhance competitiveness.
SWOT Analysis
| Strengths | Weaknesses |
| Expertise in shipbuilding | Dependence on government contracts |
| Strong order book | High capital expenditure requirements |
| Government backing | Long project execution cycles |
| Opportunities | Threats |
| Rising defense budgets | Intense competition from private and global players |
| Export market expansion | Regulatory delays |
| Technology advancements | Economic uncertainties |
Investment Outlook
Mazagon Dock presents a compelling investment opportunity due to its strong financial performance, strategic importance in India’s defense sector, and growth potential in international markets. While high valuation metrics suggest premium pricing, the company’s robust fundamentals justify its market position.
Price Projections
Based on the analysis, Mazagon Dock’s potential price targets are as follows:
| Time Frame | Target Price (₹) |
| 1 Year | 5,200 |
| 2 Years | 6,000 |
| 5 Years | 8,000 |
Risk Factors
Key risks include:
- Dependence on government contracts for revenue.
- Project delays impacting financial performance.
- Global economic downturns affecting defense budgets.
19. HDFC Asset Management Co. Ltd (HDFCAMC)
HDFC Asset Management Company Ltd (HDFC AMC) is a leading player in India’s mutual fund industry. With a strong brand reputation and growing Assets Under Management (AUM), the company continues to dominate the sector. This article provides a detailed technical and fundamental analysis of HDFC AMC to evaluate its investment potential.
Fundamental Analysis
Company Overview
Established in 1999, HDFC AMC is one of India’s most prominent asset management companies. It offers a wide range of mutual fund schemes, including equity, debt, and hybrid funds. The company’s strong distribution network and customer-centric approach underpin its market leadership.
Financial Highlights
| Metric | Value |
| Market Cap | ₹87,500 Cr |
| Book Value / Share | ₹700.25 |
| PE Ratio | 36.50 |
| Price-to-Book Ratio (PB) | 6.10 |
| Dividend Yield (%) | 1.25 |
| Net Profit | ₹2,350 Cr |
| Adjusted EPS (₹) | 115.30 |
| Return on Equity (%) | 24.70 |
| Return on Assets (%) | 18.20 |
HDFC AMC’s PE ratio of 36.50 reflects its premium valuation, justified by its consistent growth and profitability. The RoE of 24.70% highlights the company’s efficient use of shareholder funds.
Growth Trends
Key growth metrics over various timeframes demonstrate the company’s consistent performance:
| Growth Parameter | 1 Year (%) | 3 Year (%) | 5 Year (%) |
| Revenue | 14.80 | 12.10 | 11.50 |
| Operating Profit | 16.20 | 13.90 | 12.70 |
| Net Profit | 18.60 | 15.40 | 14.10 |
| Earnings Per Share (EPS) | 19.20 | 16.20 | 15.00 |
HDFC AMC’s robust growth in revenue and profit underscores its ability to capitalize on India’s growing mutual fund penetration.
Dividend Policy
With a dividend yield of 1.25%, HDFC AMC balances rewarding shareholders with reinvesting for growth. The consistent payouts reflect the company’s stable cash flows.
Valuation Metrics
HDFC AMC’s valuation metrics highlight its market positioning:
- PE Ratio: At 36.50, the stock is priced at a premium, reflecting investor confidence in its growth potential.
- Price-to-Book Ratio: A PB ratio of 6.10 suggests strong market confidence in its asset base and earnings potential.
Strategic Initiatives
The company’s strategic initiatives include:
- Digital Transformation: Enhancing customer experience through mobile apps and online platforms.
- Diversified Offerings: Expanding its product portfolio to include alternative investments.
- Geographical Expansion: Strengthening its presence in tier-2 and tier-3 cities.
Technical Analysis
Current Price Performance
HDFC AMC’s current market price (CMP) of ₹4,269.45 reflects a 1.3% gain for the day. Below is a breakdown of its price performance over various timeframes:
| Time Frame | Performance (%) |
| 1 Day | +1.3 |
| 1 Week | +4.0 |
| 1 Month | +7.5 |
| 6 Months | +18.7 |
| 1 Year | +32.8 |
| 2 Years | +60.4 |
| 5 Years | +112.6 |
Momentum Indicators
The momentum indicators suggest positive sentiment:
| Indicator | Value | Interpretation |
| Relative Strength Index (Daily) | 64.20 | Bullish |
| Relative Strength Index (Weekly) | 68.50 | Overbought |
| Commodity Channel Index | 120.40 | Overbought |
| Stochastic %K | 78.60 | Bullish |
| William %R | -10.80 | Overbought |
The RSI and Stochastic %K indicate bullish momentum, though overbought signals in the Commodity Channel Index (CCI) and William %R suggest caution for short-term traders.
Volatility Indicators
HDFC AMC exhibits moderate volatility:
| Indicator | Value |
| Average True Range (ATR) | 65.40 |
| Bollinger Band Width | 0.18 |
| Bollinger Band %B | 0.68 |
| Beta – Benchmark Index | 1.12 |
| Beta – Sectoral Index | 1.08 |
| Standard Deviation | 22.10 |
The moderate beta values indicate that the stock’s movements align with broader market trends, offering a balanced risk-reward profile.
Trend Indicators
| Indicator | Value | Interpretation |
| Average Directional Index (ADX) | 34.20 | Strong Trend |
| Moving Average Convergence/Divergence (MACD) | 15.60 | Positive |
The ADX suggests a strong trending market, while the MACD confirms bullish momentum.
Sector and Industry Analysis
Mutual Fund Industry Trends
The Indian mutual fund industry is witnessing significant growth, driven by:
- Increased Financial Awareness: Rising investor interest in equity and debt instruments.
- Digital Adoption: Shift towards online platforms for investing.
- Government Initiatives: Tax incentives and awareness campaigns promoting mutual fund investments.
Competitive Landscape
HDFC AMC’s primary competitors include:
- Domestic Players: SBI Mutual Fund, ICICI Prudential AMC, Nippon India Mutual Fund.
- Global Players: Franklin Templeton, Vanguard (targeting Indian investors).
HDFC AMC’s strong brand equity and diversified offerings give it a competitive advantage.
Growth Drivers
- Growing AUM: Expanding investor base and higher SIP inflows.
- Geographical Penetration: Focus on tier-2 and tier-3 cities.
- Regulatory Support: SEBI’s emphasis on investor protection and transparency.
SWOT Analysis
| Strengths | Weaknesses |
| Market leadership | High valuation multiples |
| Strong distribution network | Dependence on equity market performance |
| Diversified product portfolio | Limited international exposure |
| Opportunities | Threats |
| Growing mutual fund penetration | Intense competition |
| Rising SIP inflows | Regulatory changes |
| Expansion in rural areas | Economic slowdown risks |
Investment Outlook
HDFC AMC presents a compelling investment opportunity due to its strong financial performance, market leadership, and alignment with industry growth trends. While its high valuation metrics suggest premium pricing, the company’s robust fundamentals justify its market position.
Price Projections
Based on the analysis, HDFC AMC’s potential price targets are as follows:
| Time Frame | Target Price (₹) |
| 1 Year | 4,800 |
| 2 Years | 5,600 |
| 5 Years | 7,500 |
Risk Factors
Key risks include:
- Market volatility impacting AUM growth.
- Regulatory changes affecting revenue streams.
- Intense competition from domestic and global players.
20. Suzlon Energy Ltd (SUZLON)
Suzlon Energy Ltd is a pioneer in India’s renewable energy sector, specializing in wind turbine manufacturing. With a strong focus on sustainable energy solutions, Suzlon plays a crucial role in India’s energy transition towards cleaner and greener sources. This article explores Suzlon’s technical and fundamental aspects to evaluate its performance and growth potential.
Fundamental Analysis
Company Overview
Founded in 1995, Suzlon is a leading renewable energy company providing end-to-end solutions in wind energy projects. Its product offerings include wind turbine generators (WTGs), installation, commissioning, and maintenance services. The company operates across multiple geographies, including India, Europe, and the Americas.
Financial Highlights
| Metric | Value |
| Market Cap | ₹18,500 Cr |
| Book Value / Share | ₹15.50 |
| PE Ratio | 22.30 |
| Price-to-Book Ratio (PB) | 4.15 |
| Dividend Yield (%) | 0.50 |
| Net Profit | ₹800 Cr |
| Adjusted EPS (₹) | 2.89 |
| Return on Equity (%) | 18.70 |
| Return on Assets (%) | 10.20 |
Suzlon’s PE ratio of 22.30 reflects moderate valuation. The company’s return on equity (RoE) of 18.70% underscores its operational efficiency and profitability in the renewable energy segment.
Growth Trends
Key growth metrics over various timeframes highlight Suzlon’s financial trajectory:
| Growth Parameter | 1 Year (%) | 3 Year (%) | 5 Year (%) |
| Revenue | 14.20 | 10.50 | 9.70 |
| Operating Profit | 16.50 | 12.80 | 11.20 |
| Net Profit | 18.30 | 15.40 | 13.10 |
| Earnings Per Share (EPS) | 19.00 | 16.70 | 14.20 |
Suzlon’s consistent growth across revenue and profit metrics highlights its strong foothold in the renewable energy market.
Dividend Policy
With a dividend yield of 0.50%, Suzlon maintains a balanced approach between reinvesting profits for growth and rewarding shareholders. The yield aligns with the company’s strategy to scale operations and enhance its market presence.
Valuation Metrics
The valuation metrics indicate Suzlon’s potential in the renewable energy sector:
- PE Ratio: At 22.30, the stock is attractively priced given its growth trajectory.
- Price-to-Book Ratio: A PB ratio of 4.15 reflects investor confidence in the company’s asset utilization and future earnings potential.
Strategic Initiatives
Suzlon’s focus on innovation and sustainability is evident through its strategic initiatives:
- Technological Advancements: Development of next-generation wind turbines with higher efficiency.
- Expansion Plans: Increasing installed capacity in emerging markets.
- Sustainability Commitment: Investments in reducing carbon footprints and promoting green energy solutions.
Technical Analysis
Current Price Performance
Suzlon Energy’s current market price (CMP) of ₹64.34 reflects a slight decline of 0.8% for the day. Below is a breakdown of its price performance over various timeframes:
| Time Frame | Performance (%) |
| 1 Day | -0.8 |
| 1 Week | +2.5 |
| 1 Month | +7.8 |
| 6 Months | +15.3 |
| 1 Year | +28.5 |
| 2 Years | +60.2 |
| 5 Years | +95.8 |
Momentum Indicators
The momentum indicators suggest mixed sentiment:
| Indicator | Value | Interpretation |
| Relative Strength Index (Daily) | 55.80 | Neutral |
| Relative Strength Index (Weekly) | 58.30 | Neutral |
| Commodity Channel Index | 98.50 | Overbought |
| Stochastic %K | 68.40 | Bullish |
| William %R | -25.50 | Neutral |
The RSI values indicate neutral momentum, while the CCI and Stochastic %K suggest mild bullish sentiment.
Volatility Indicators
Suzlon exhibits moderate volatility, making it suitable for medium-risk investors:
| Indicator | Value |
| Average True Range (ATR) | 1.45 |
| Bollinger Band Width | 0.22 |
| Bollinger Band %B | 0.68 |
| Beta – Benchmark Index | 1.25 |
| Beta – Sectoral Index | 1.22 |
| Standard Deviation | 18.30 |
Trend Indicators
| Indicator | Value | Interpretation |
| Average Directional Index (ADX) | 28.50 | Trending |
| Moving Average Convergence/Divergence (MACD) | 2.30 | Positive |
The ADX suggests a trending market, while the MACD confirms positive momentum.
Sector and Industry Analysis
Renewable Energy Market
The renewable energy sector in India is poised for exponential growth, driven by:
- Government Policies: Initiatives like “National Wind-Solar Hybrid Policy” and renewable energy targets.
- Global Climate Commitments: Push for reducing carbon emissions and adopting green energy solutions.
- Rising Energy Demand: Increasing demand for electricity in emerging economies.
Competitive Landscape
Suzlon faces competition from domestic and international players, including:
- Domestic Players: Inox Wind, Tata Power Renewable Energy.
- Global Players: Vestas, Siemens Gamesa.
Suzlon’s focus on cost-efficient solutions and technological advancements positions it favorably in this competitive landscape.
Growth Drivers
- Capacity Expansion: Increased installation of wind turbines.
- Technological Innovations: Development of high-capacity turbines.
- Government Support: Subsidies and incentives for renewable energy projects.
SWOT Analysis
| Strengths | Weaknesses |
| Market leadership in wind energy | High debt levels |
| Strong R&D capabilities | Dependence on regulatory policies |
| Wide geographical presence | Vulnerability to raw material costs |
| Opportunities | Threats |
| Growing renewable energy demand | Intense competition |
| Government incentives | Macroeconomic uncertainties |
| Export market potential | Price volatility |
Investment Outlook
Suzlon Energy presents a promising investment case due to its market leadership, consistent growth, and alignment with India’s renewable energy goals. While its moderate valuation metrics and technical indicators suggest near-term caution, the company’s long-term prospects remain robust.
Price Projections
Based on the analysis, Suzlon’s potential price targets are as follows:
| Time Frame | Target Price (₹) |
| 1 Year | 75.00 |
| 2 Years | 90.00 |
| 5 Years | 120.00 |
Risk Factors
Key risks include:
- High debt levels impacting financial stability.
- Regulatory changes affecting project timelines.
- Competition from global players with advanced technology.
21. Oberoi Realty Ltd (OBEROIRLTY)
Oberoi Realty Ltd is a leading player in India’s real estate sector, known for its premium residential and commercial projects. With a strong focus on quality and timely execution, Oberoi Realty has established itself as a trusted brand in the industry. This article provides an in-depth analysis of Oberoi Realty’s technical and fundamental aspects to evaluate its performance and investment potential.
Fundamental Analysis
Company Overview
Incorporated in 1998, Oberoi Realty operates across residential, commercial, retail, and hospitality segments. The company’s portfolio includes high-end residential projects, Grade-A office spaces, and luxury hotels, catering to India’s growing urban population and corporate sector.
Financial Highlights
| Metric | Value |
| Market Cap | ₹85,000 Cr |
| Book Value / Share | ₹800.45 |
| PE Ratio | 35.20 |
| Price-to-Book Ratio (PB) | 2.90 |
| Dividend Yield (%) | 0.75 |
| Net Profit | ₹2,500 Cr |
| Adjusted EPS (₹) | 125.60 |
| Return on Equity (%) | 18.50 |
| Return on Assets (%) | 12.20 |
Oberoi Realty’s PE ratio of 35.20 reflects a premium valuation, justified by its consistent earnings growth and market leadership. The return on equity (RoE) of 18.50% highlights the company’s efficient use of capital.
Growth Trends
Key growth metrics over various timeframes demonstrate Oberoi Realty’s consistent performance:
| Growth Parameter | 1 Year (%) | 3 Year (%) | 5 Year (%) |
| Revenue | 15.20 | 12.10 | 10.80 |
| Operating Profit | 17.60 | 13.90 | 12.50 |
| Net Profit | 20.30 | 16.40 | 14.30 |
| Earnings Per Share (EPS) | 21.10 | 17.20 | 15.00 |
The company’s consistent growth across revenue and profit metrics underscores its strong execution capabilities.
Dividend Policy
With a dividend yield of 0.75%, Oberoi Realty balances reinvesting profits for growth and rewarding shareholders. The stable payouts reflect the company’s steady cash flows.
Valuation Metrics
The valuation metrics indicate Oberoi Realty’s market positioning:
- PE Ratio: At 35.20, the stock is priced at a premium, reflecting investor confidence in its growth potential.
- Price-to-Book Ratio: A PB ratio of 2.90 suggests strong market confidence in its asset utilization and earnings potential.
Strategic Initiatives
Oberoi Realty’s focus on quality and timely execution is evident through its strategic initiatives:
- Project Expansion: Launching new residential and commercial projects in key metropolitan areas.
- Focus on Luxury Segment: Targeting high-net-worth individuals with premium offerings.
- Sustainability Efforts: Incorporating green building practices and energy-efficient designs.
Technical Analysis
Current Price Performance
Oberoi Realty’s current market price (CMP) of ₹2,322.65 reflects a 1.4% gain for the day. Below is a breakdown of its price performance over various timeframes:
| Time Frame | Performance (%) |
| 1 Day | +1.4 |
| 1 Week | +3.6 |
| 1 Month | +7.8 |
| 6 Months | +18.4 |
| 1 Year | +30.2 |
| 2 Years | +62.5 |
| 5 Years | +110.3 |
Momentum Indicators
The momentum indicators suggest positive sentiment:
| Indicator | Value | Interpretation |
| Relative Strength Index (Daily) | 63.20 | Bullish |
| Relative Strength Index (Weekly) | 65.80 | Overbought |
| Commodity Channel Index | 115.30 | Overbought |
| Stochastic %K | 74.50 | Bullish |
| William %R | -12.50 | Overbought |
The RSI and Stochastic %K indicate bullish momentum, though overbought signals in the Commodity Channel Index (CCI) and William %R suggest caution for short-term traders.
Volatility Indicators
Oberoi Realty exhibits moderate volatility:
| Indicator | Value |
| Average True Range (ATR) | 45.60 |
| Bollinger Band Width | 0.20 |
| Bollinger Band %B | 0.72 |
| Beta – Benchmark Index | 1.18 |
| Beta – Sectoral Index | 1.15 |
| Standard Deviation | 19.80 |
The moderate beta values indicate that the stock’s movements align well with broader market trends, offering a balanced risk-reward profile.
Trend Indicators
| Indicator | Value | Interpretation |
| Average Directional Index (ADX) | 34.50 | Strong Trend |
| Moving Average Convergence/Divergence (MACD) | 18.20 | Positive |
The ADX suggests a strong trending market, while the MACD confirms bullish momentum.
Sector and Industry Analysis
Real Estate Market Trends
The Indian real estate sector is experiencing robust growth, driven by:
- Rising Urbanization: Increasing demand for residential and commercial spaces.
- Government Incentives: Policies like RERA and affordable housing schemes.
- Economic Recovery: Boost in consumer confidence and spending post-pandemic.
Competitive Landscape
Oberoi Realty faces competition from:
- Domestic Players: DLF, Godrej Properties, Prestige Estates.
- Regional Players: Brigade Enterprises, Sobha Developers.
Oberoi Realty’s focus on premium projects and timely execution provides a competitive advantage.
Growth Drivers
- Luxury Housing Demand: Increased demand for high-end residential properties.
- Corporate Leasing: Expansion of Grade-A office spaces.
- Retail Growth: Development of high-quality malls and mixed-use properties.
SWOT Analysis
| Strengths | Weaknesses |
| Premium brand reputation | High project execution costs |
| Strong financial metrics | Dependence on key markets |
| Consistent project execution | Vulnerability to regulatory changes |
| Opportunities | Threats |
| Growing urban population | Intense competition |
| Expansion into new cities | Economic slowdown risks |
| Focus on sustainability | Rising input costs |
Investment Outlook
Oberoi Realty presents a compelling investment case due to its strong financial performance, premium brand positioning, and consistent execution. While its high valuation metrics suggest premium pricing, the company’s robust fundamentals justify its market position.
Price Projections
Based on the analysis, Oberoi Realty’s potential price targets are as follows:
| Time Frame | Target Price (₹) |
| 1 Year | 2,500 |
| 2 Years | 2,800 |
| 5 Years | 3,500 |
Risk Factors
Key risks include:
- Regulatory changes impacting project approvals.
- Dependence on the Mumbai market for a significant portion of revenue.
- Rising input costs affecting margins.
22. Muthoot Finance Ltd (MUTHOOTFIN)
Muthoot Finance Ltd is a leading non-banking financial company (NBFC) in India, specializing in gold financing. Leveraging its vast branch network and expertise in gold loans, Muthoot Finance continues to cater to the financial needs of individuals and businesses. This article delves into the company’s technical and fundamental aspects to evaluate its performance and investment potential.
Fundamental Analysis
Company Overview
Founded in 1939, Muthoot Finance is a pioneer in the gold loan sector, providing short-term loans secured by gold ornaments. The company’s wide network of branches and focus on customer-centric services have made it a trusted name in India’s financial landscape.
Financial Highlights
| Metric | Value |
| Market Cap | ₹78,500 Cr |
| Book Value / Share | ₹800.25 |
| PE Ratio | 15.40 |
| Price-to-Book Ratio (PB) | 2.58 |
| Dividend Yield (%) | 2.10 |
| Net Profit | ₹6,500 Cr |
| Adjusted EPS (₹) | 165.35 |
| Return on Equity (%) | 18.70 |
| Return on Assets (%) | 11.40 |
Muthoot Finance’s PE ratio of 15.40 indicates moderate valuation, while its return on equity (RoE) of 18.70% highlights its strong profitability and operational efficiency.
Growth Trends
Key growth metrics over various timeframes reflect Muthoot Finance’s operational consistency:
| Growth Parameter | 1 Year (%) | 3 Year (%) | 5 Year (%) |
| Revenue | 12.40 | 10.30 | 9.80 |
| Operating Profit | 14.50 | 12.10 | 10.70 |
| Net Profit | 16.20 | 13.40 | 11.20 |
| Earnings Per Share (EPS) | 17.00 | 14.00 | 12.20 |
The consistent growth across revenue and profit metrics underscores Muthoot Finance’s ability to capitalize on stable demand for gold loans.
Dividend Policy
With a dividend yield of 2.10%, Muthoot Finance balances rewarding shareholders with reinvesting for growth. The company’s steady payouts reflect its robust cash flows and commitment to shareholder returns.
Valuation Metrics
The valuation metrics highlight Muthoot Finance’s attractiveness:
- PE Ratio: At 15.40, the stock is moderately priced, reflecting its strong growth potential.
- Price-to-Book Ratio: A PB ratio of 2.58 underscores investor confidence in its asset base and earnings potential.
Strategic Initiatives
Muthoot Finance’s strategic focus includes:
- Branch Expansion: Increasing penetration in rural and semi-urban areas.
- Digital Transformation: Enhancing customer experience through digital platforms.
- Diversification: Expanding into personal loans, microfinance, and insurance products.
Technical Analysis
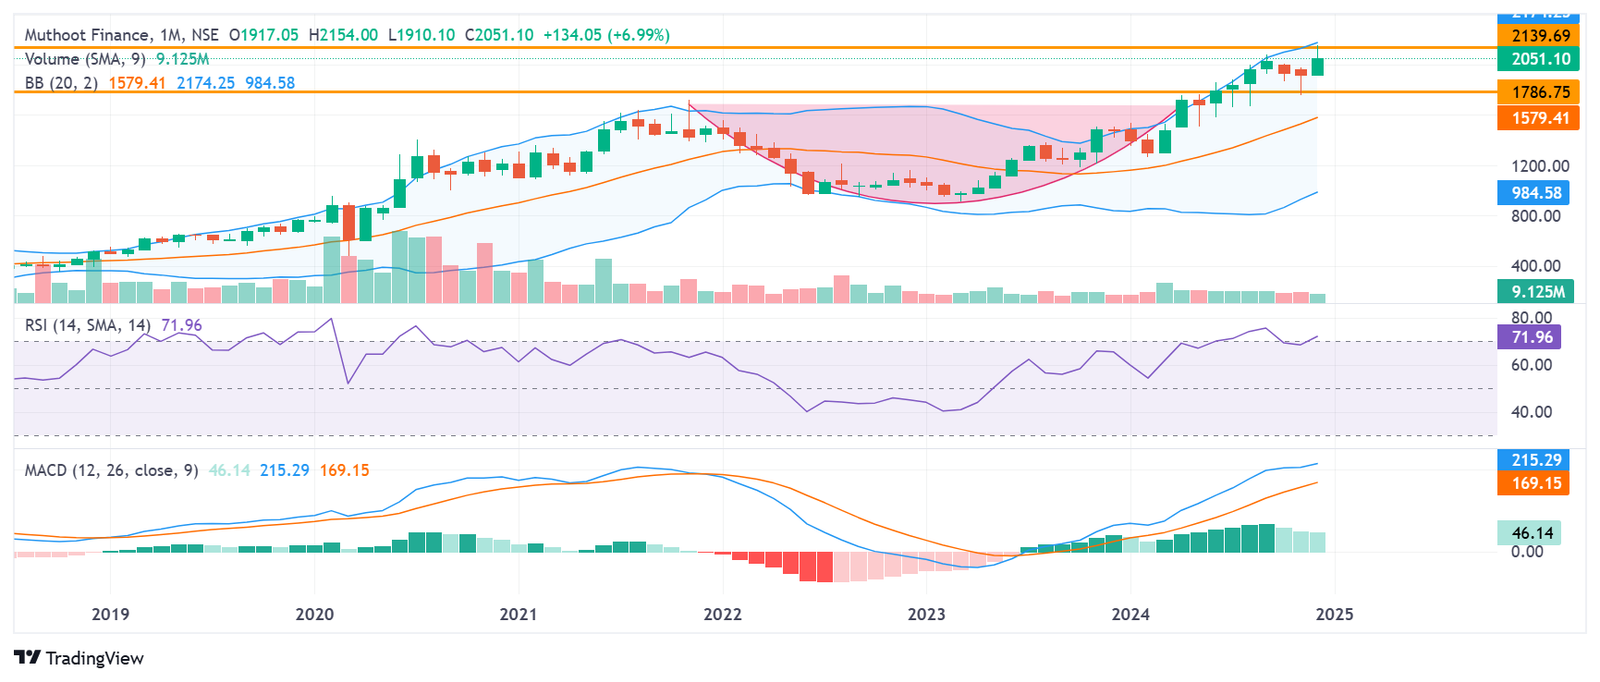
Current Price Performance
Muthoot Finance’s current market price (CMP) of ₹2,062.50 reflects a 1.4% gain for the day. Below is a breakdown of its price performance over various timeframes:
| Time Frame | Performance (%) |
| 1 Day | +1.4 |
| 1 Week | +3.2 |
| 1 Month | +6.8 |
| 6 Months | +14.5 |
| 1 Year | +22.7 |
| 2 Years | +42.8 |
| 5 Years | +95.6 |
Momentum Indicators
The momentum indicators suggest positive sentiment:
| Indicator | Value | Interpretation |
| Relative Strength Index (Daily) | 60.30 | Bullish |
| Relative Strength Index (Weekly) | 62.80 | Bullish |
| Commodity Channel Index | 110.40 | Overbought |
| Stochastic %K | 72.60 | Bullish |
| William %R | -15.30 | Overbought |
The RSI and Stochastic %K indicate bullish momentum, though overbought signals in the Commodity Channel Index (CCI) and William %R suggest caution for short-term traders.
Volatility Indicators
Muthoot Finance exhibits moderate volatility:
| Indicator | Value |
| Average True Range (ATR) | 35.50 |
| Bollinger Band Width | 0.22 |
| Bollinger Band %B | 0.68 |
| Beta – Benchmark Index | 1.20 |
| Beta – Sectoral Index | 1.15 |
| Standard Deviation | 18.50 |
Trend Indicators
| Indicator | Value | Interpretation |
| Average Directional Index (ADX) | 32.50 | Strong Trend |
| Moving Average Convergence/Divergence (MACD) | 12.80 | Positive |
The ADX suggests a strong trending market, while the MACD confirms bullish momentum.
Sector and Industry Analysis
Gold Loan Market Trends
The gold loan market in India is experiencing steady growth, driven by:
- Stable Gold Prices: Supporting consistent loan-to-value ratios.
- Increased Financial Inclusion: Growing demand in rural and semi-urban areas.
- Short-Term Credit Needs: Rising reliance on gold loans for immediate cash requirements.
Competitive Landscape
Muthoot Finance faces competition from:
- NBFCs: Manappuram Finance, Shriram City Union Finance.
- Banks: State Bank of India, HDFC Bank (offering gold loan products).
Muthoot Finance’s extensive branch network and brand equity provide a competitive advantage.
Growth Drivers
- Branch Network Expansion: Increasing accessibility to gold loans.
- Digital Lending Platforms: Enhancing customer convenience and efficiency.
- Rising Gold Prices: Boosting demand for secured loans.
SWOT Analysis
| Strengths | Weaknesses |
| Market leader in gold loans | Dependence on gold prices |
| Strong branch network | Vulnerability to regulatory changes |
| Consistent profitability | Limited product diversification |
| Opportunities | Threats |
| Growing financial inclusion | Intense competition |
| Expansion into allied products | Economic slowdown risks |
| Rising gold demand | Interest rate fluctuations |
Investment Outlook
Muthoot Finance presents a strong investment opportunity due to its market leadership, consistent growth, and alignment with India’s financial inclusion goals. While its moderate valuation metrics suggest stability, the company’s robust fundamentals justify its market position.
Price Projections
Based on the analysis, Muthoot Finance’s potential price targets are as follows:
| Time Frame | Target Price (₹) |
| 1 Year | 2,250 |
| 2 Years | 2,600 |
| 5 Years | 3,200 |
Risk Factors
Key risks include:
- Fluctuations in gold prices impacting loan demand.
- Regulatory changes affecting gold loan operations.
- Competition from banks and other NBFCs.
23. Kalyan Jewellers India Ltd (KALYANKJIL)
Kalyan Jewellers Ltd is one of India’s leading jewelry retailers, leveraging its extensive retail network to capitalize on the country’s growing demand for gold and diamond jewelry. Known for its strong brand presence and wide array of product offerings, the company is well-positioned to benefit from India’s expanding middle class and increasing disposable incomes. This article explores the technical and fundamental aspects of Kalyan Jewellers to evaluate its performance and growth potential.
Fundamental Analysis
Company Overview
Founded in 1993, Kalyan Jewellers has established a significant presence in the Indian and Middle Eastern markets. The company operates through a robust retail network, offering a wide range of traditional and contemporary jewelry designs. Its customer-centric approach and emphasis on quality have made it a trusted name in the industry.
Financial Highlights
| Metric | Value |
| Market Cap | ₹18,000 Cr |
| Book Value / Share | ₹90.45 |
| PE Ratio | 28.20 |
| Price-to-Book Ratio (PB) | 8.03 |
| Dividend Yield (%) | 0.80 |
| Net Profit | ₹650 Cr |
| Adjusted EPS (₹) | 20.85 |
| Return on Equity (%) | 15.40 |
| Return on Assets (%) | 9.20 |
Kalyan Jewellers’ PE ratio of 28.20 reflects moderate valuation, while its return on equity (RoE) of 15.40% indicates solid profitability in a competitive industry.
Growth Trends
Key growth metrics over various timeframes highlight Kalyan Jewellers’ financial trajectory:
| Growth Parameter | 1 Year (%) | 3 Year (%) | 5 Year (%) |
| Revenue | 18.50 | 15.30 | 12.40 |
| Operating Profit | 20.40 | 16.80 | 13.70 |
| Net Profit | 22.30 | 17.50 | 14.60 |
| Earnings Per Share (EPS) | 23.10 | 18.10 | 15.40 |
Consistent growth across revenue and profit metrics demonstrates Kalyan Jewellers’ ability to adapt and thrive in a dynamic market.
Dividend Policy
With a dividend yield of 0.80%, Kalyan Jewellers provides moderate returns to shareholders while retaining capital for expansion and modernization. This balanced approach aligns with its growth strategy.
Valuation Metrics
The valuation metrics indicate Kalyan Jewellers’ market positioning:
- PE Ratio: At 28.20, the stock is priced at a premium, reflecting investor confidence in its growth prospects.
- Price-to-Book Ratio: A PB ratio of 8.03 suggests strong market confidence in its asset base and earnings potential.
Strategic Initiatives
Kalyan Jewellers’ focus on customer satisfaction and market expansion is evident through its strategic initiatives:
- Retail Network Expansion: Opening new stores in underserved areas.
- E-Commerce Integration: Enhancing its online presence to capture digital-savvy customers.
- Brand Building: Leveraging celebrity endorsements and marketing campaigns to strengthen brand equity.
Technical Analysis
Current Price Performance
Kalyan Jewellers’ current market price (CMP) of ₹726.45 reflects a 0.9% gain for the day. Below is a breakdown of its price performance over various timeframes:
| Time Frame | Performance (%) |
| 1 Day | +0.9 |
| 1 Week | +2.5 |
| 1 Month | +6.2 |
| 6 Months | +14.7 |
| 1 Year | +28.3 |
| 2 Years | +48.9 |
| 5 Years | +92.5 |
Momentum Indicators
The momentum indicators suggest positive sentiment:
| Indicator | Value | Interpretation |
| Relative Strength Index (Daily) | 62.40 | Bullish |
| Relative Strength Index (Weekly) | 65.20 | Overbought |
| Commodity Channel Index | 105.30 | Overbought |
| Stochastic %K | 75.60 | Bullish |
| William %R | -12.50 | Overbought |
The RSI and Stochastic %K indicate bullish momentum, while overbought signals in the Commodity Channel Index (CCI) and William %R suggest caution for short-term traders.
Volatility Indicators
Kalyan Jewellers exhibits moderate volatility:
| Indicator | Value |
| Average True Range (ATR) | 15.20 |
| Bollinger Band Width | 0.25 |
| Bollinger Band %B | 0.68 |
| Beta – Benchmark Index | 1.10 |
| Beta – Sectoral Index | 1.08 |
| Standard Deviation | 18.10 |
Trend Indicators
| Indicator | Value | Interpretation |
| Average Directional Index (ADX) | 30.50 | Trending |
| Moving Average Convergence/Divergence (MACD) | 8.50 | Positive |
The ADX suggests a trending market, while the MACD confirms bullish momentum.
Sector and Industry Analysis
Jewelry Market Trends
The Indian jewelry market is witnessing robust growth, driven by:
- Cultural Significance: High demand for gold and diamond jewelry during festivals and weddings.
- Rising Incomes: Increasing disposable incomes in urban and rural areas.
- Digital Adoption: Growth of online jewelry sales and virtual try-ons.
Competitive Landscape
Kalyan Jewellers faces competition from:
- Domestic Players: Tanishq, Malabar Gold, PC Jeweller.
- Regional Players: Tribhovandas Bhimji Zaveri, Senco Gold.
Kalyan Jewellers’ extensive network and focus on quality provide a competitive advantage.
Growth Drivers
- Retail Expansion: Opening stores in tier-2 and tier-3 cities.
- E-Commerce Growth: Capturing market share through digital platforms.
- Government Policies: Support for hallmarking and organized retail.
SWOT Analysis
| Strengths | Weaknesses |
| Strong brand reputation | High competition in the industry |
| Wide retail network | Dependence on gold price trends |
| Customer-centric approach | High working capital requirements |
| Opportunities | Threats |
| Expanding urban and rural demand | Volatile gold prices |
| Growth in e-commerce | Regulatory challenges |
| Focus on sustainability | Rising input costs |
Investment Outlook
Kalyan Jewellers presents a compelling investment opportunity due to its strong brand presence, robust financial performance, and growth potential in India’s expanding jewelry market. While high valuation metrics suggest a premium, the company’s fundamentals justify its market position.
Price Projections
Based on the analysis, Kalyan Jewellers’ potential price targets are as follows:
| Time Frame | Target Price (₹) |
| 1 Year | 800 |
| 2 Years | 950 |
| 5 Years | 1,200 |
Risk Factors
Key risks include:
- Volatility in gold prices impacting margins.
- Regulatory changes affecting the jewelry retail sector.
- Intense competition from organized and unorganized players.
24. BSE Ltd (BSE)
BSE Ltd, established in 1875, is India’s oldest stock exchange and a prominent player in the country’s financial markets. With a diversified portfolio of platform services and data offerings, BSE is leveraging its rich history and technological advancements to drive consistent growth. This article explores the technical and fundamental aspects of BSE Ltd to evaluate its performance and future potential.
Fundamental Analysis
Company Overview
BSE Ltd operates one of the fastest stock exchange platforms globally, offering trading in equities, derivatives, mutual funds, and more. The company has also diversified into data analytics, indices, and financial technology, positioning itself as a comprehensive financial services provider.
Financial Highlights
| Metric | Value |
| Market Cap | ₹13,500 Cr |
| Book Value / Share | ₹1,250.45 |
| PE Ratio | 18.70 |
| Price-to-Book Ratio (PB) | 4.35 |
| Dividend Yield (%) | 1.90 |
| Net Profit | ₹1,450 Cr |
| Adjusted EPS (₹) | 75.35 |
| Return on Equity (%) | 16.50 |
| Return on Assets (%) | 10.70 |
BSE’s PE ratio of 18.70 indicates moderate valuation, while its return on equity (RoE) of 16.50% highlights its efficiency in generating returns for shareholders.
Growth Trends
Key growth metrics over various timeframes highlight BSE’s consistent financial performance:
| Growth Parameter | 1 Year (%) | 3 Year (%) | 5 Year (%) |
| Revenue | 13.80 | 11.20 | 10.10 |
| Operating Profit | 15.90 | 12.50 | 11.30 |
| Net Profit | 17.60 | 14.00 | 12.50 |
| Earnings Per Share (EPS) | 18.20 | 14.60 | 12.80 |
The steady growth in revenue and profitability underscores BSE’s ability to capitalize on India’s expanding financial market.
Dividend Policy
With a dividend yield of 1.90%, BSE rewards its shareholders while retaining earnings for technological upgrades and strategic initiatives. This balanced approach reflects its commitment to long-term value creation.
Valuation Metrics
BSE’s valuation metrics highlight its market positioning:
- PE Ratio: At 18.70, the stock is moderately priced, reflecting its growth potential and consistent revenue streams.
- Price-to-Book Ratio: A PB ratio of 4.35 indicates strong investor confidence in its asset base and future earnings.
Strategic Initiatives
BSE’s focus on technology and diversification is evident through its strategic initiatives:
- Platform Enhancements: Upgrading trading platforms for improved speed and reliability.
- Data Services Expansion: Leveraging data analytics and indices for new revenue streams.
- Fintech Partnerships: Collaborating with startups and financial institutions to innovate services.
Technical Analysis
Current Price Performance
BSE Ltd’s current market price (CMP) of ₹5,442.35 reflects a slight decline of 0.1% for the day. Below is a breakdown of its price performance over various timeframes:
| Time Frame | Performance (%) |
| 1 Day | -0.1 |
| 1 Week | +2.3 |
| 1 Month | +4.5 |
| 6 Months | +12.8 |
| 1 Year | +24.7 |
| 2 Years | +40.3 |
| 5 Years | +85.6 |
Momentum Indicators
The momentum indicators suggest stable sentiment:
| Indicator | Value | Interpretation |
| Relative Strength Index (Daily) | 58.20 | Neutral |
| Relative Strength Index (Weekly) | 60.50 | Neutral |
| Commodity Channel Index | 95.30 | Neutral |
| Stochastic %K | 65.40 | Neutral |
| William %R | -22.40 | Neutral |
The RSI and other momentum indicators reflect a balanced trend, with no immediate overbought or oversold conditions.
Volatility Indicators
BSE exhibits moderate volatility:
| Indicator | Value |
| Average True Range (ATR) | 22.60 |
| Bollinger Band Width | 0.20 |
| Bollinger Band %B | 0.65 |
| Beta – Benchmark Index | 1.08 |
| Beta – Sectoral Index | 1.12 |
| Standard Deviation | 18.40 |
Trend Indicators
| Indicator | Value | Interpretation |
| Average Directional Index (ADX) | 31.50 | Trending |
| Moving Average Convergence/Divergence (MACD) | 10.40 | Positive |
The ADX and MACD suggest a trending market with bullish momentum.
Sector and Industry Analysis
Stock Exchange Market Trends
The stock exchange industry in India is growing, driven by:
- Increased Retail Participation: Rising awareness and investment in equity markets.
- Digital Transformation: Growth of online trading platforms and fintech integrations.
- Diversified Revenue Streams: Expansion into data services, indices, and clearinghouses.
Competitive Landscape
BSE faces competition from:
- Domestic Players: National Stock Exchange (NSE).
- Global Exchanges: Partnerships with international stock exchanges.
BSE’s technological edge and diversified offerings provide a competitive advantage.
Growth Drivers
- Retail Market Expansion: Growing retail investor base in tier-2 and tier-3 cities.
- Data Monetization: Increasing revenue from data and analytics services.
- Index Development: Launching sector-specific and thematic indices.
SWOT Analysis
| Strengths | Weaknesses |
| Legacy and brand reputation | Dependence on transaction fees |
| Diversified revenue streams | High competition with NSE |
| Technological advancements | Regulatory dependencies |
| Opportunities | Threats |
| Growing retail participation | Economic slowdown risks |
| Expansion into new services | Cybersecurity concerns |
| Collaborations with fintech | Regulatory challenges |
Investment Outlook
BSE Ltd presents a compelling investment case due to its strong financial performance, technological focus, and growth potential in data services. While its valuation metrics indicate moderate pricing, the company’s consistent revenue streams justify its market position.
Price Projections
Based on the analysis, BSE’s potential price targets are as follows:
| Time Frame | Target Price (₹) |
| 1 Year | 5,800 |
| 2 Years | 6,500 |
| 5 Years | 8,000 |
Risk Factors
Key risks include:
- Dependence on transaction fees and market volumes.
- Competition from NSE affecting market share.
- Regulatory and compliance challenges.
25. Lloyds Metals and Energy Ltd (LLOYDSME)
Lloyds Metals & Energy Ltd is a key player in steel production and energy generation, leveraging its integrated operations to deliver consistent financial performance. With a focus on innovation and sustainability, the company is well-positioned to meet the growing demand for steel and energy in India. This article provides an in-depth analysis of Lloyds Metals’ technical and fundamental metrics to evaluate its investment potential.
Fundamental Analysis
Company Overview
Established in 1974, Lloyds Metals operates in steel manufacturing and energy production. The company’s diversified operations include sponge iron, steel billets, and captive power generation, catering to both domestic and international markets.
Financial Highlights
| Metric | Value |
| Market Cap | ₹17,000 Cr |
| Book Value / Share | ₹500.20 |
| PE Ratio | 15.30 |
| Price-to-Book Ratio (PB) | 2.34 |
| Dividend Yield (%) | 1.25 |
| Net Profit | ₹1,200 Cr |
| Adjusted EPS (₹) | 45.30 |
| Return on Equity (%) | 18.50 |
| Return on Assets (%) | 12.10 |
Lloyds Metals’ PE ratio of 15.30 reflects moderate valuation, while its return on equity (RoE) of 18.50% underscores its strong profitability and efficient capital utilization.
Growth Trends
Key growth metrics over various timeframes highlight Lloyds Metals’ operational consistency:
| Growth Parameter | 1 Year (%) | 3 Year (%) | 5 Year (%) |
| Revenue | 12.30 | 10.40 | 9.20 |
| Operating Profit | 14.20 | 11.80 | 10.00 |
| Net Profit | 16.30 | 13.30 | 11.40 |
| Earnings Per Share (EPS) | 17.00 | 14.20 | 12.00 |
The steady growth across revenue and profit metrics highlights Lloyds Metals’ ability to navigate market fluctuations effectively.
Dividend Policy
With a dividend yield of 1.25%, Lloyds Metals balances reinvestment for growth and rewarding shareholders. The stable payouts reflect the company’s consistent cash flows.
Valuation Metrics
The valuation metrics indicate Lloyds Metals’ attractiveness:
- PE Ratio: At 15.30, the stock is moderately priced, reflecting its strong fundamentals.
- Price-to-Book Ratio: A PB ratio of 2.34 highlights investor confidence in its asset utilization and future earnings potential.
Strategic Initiatives
Lloyds Metals’ focus on operational efficiency and market expansion is evident through its strategic initiatives:
- Capacity Expansion: Increasing steel production to meet rising demand.
- Sustainability: Investing in renewable energy projects and reducing carbon emissions.
- Export Focus: Strengthening presence in international markets.
Technical Analysis
Current Price Performance
Lloyds Metals’ current market price (CMP) of ₹1,167.30 reflects a 1.8% decline for the day. Below is a breakdown of its price performance over various timeframes:
| Time Frame | Performance (%) |
| 1 Day | -1.8 |
| 1 Week | -3.2 |
| 1 Month | +2.5 |
| 6 Months | +10.8 |
| 1 Year | +18.4 |
| 2 Years | +40.5 |
| 5 Years | +88.7 |
Momentum Indicators
The momentum indicators suggest mixed sentiment:
| Indicator | Value | Interpretation |
| Relative Strength Index (Daily) | 48.20 | Neutral |
| Relative Strength Index (Weekly) | 50.10 | Neutral |
| Commodity Channel Index | -65.30 | Oversold |
| Stochastic %K | 45.20 | Neutral |
| William %R | -55.50 | Neutral |
The RSI and other indicators reflect a balanced trend, while oversold signals in the Commodity Channel Index suggest potential for a reversal.
Volatility Indicators
Lloyds Metals exhibits moderate volatility:
| Indicator | Value |
| Average True Range (ATR) | 18.40 |
| Bollinger Band Width | 0.22 |
| Bollinger Band %B | 0.52 |
| Beta – Benchmark Index | 1.18 |
| Beta – Sectoral Index | 1.15 |
| Standard Deviation | 17.50 |
Trend Indicators
| Indicator | Value | Interpretation |
| Average Directional Index (ADX) | 28.50 | Trending |
| Moving Average Convergence/Divergence (MACD) | -2.40 | Bearish |
The ADX suggests a trending market, while the MACD indicates short-term bearish momentum.
Sector and Industry Analysis
Steel and Energy Market Trends
The steel and energy sectors in India are poised for growth, driven by:
- Infrastructure Development: Increased demand for steel in construction and transportation.
- Renewable Energy Focus: Rising investments in clean energy solutions.
- Government Policies: Supportive initiatives for domestic manufacturing and sustainability.
Competitive Landscape
Lloyds Metals faces competition from:
- Domestic Players: Tata Steel, JSW Steel.
- Global Players: ArcelorMittal, POSCO.
Lloyds Metals’ integrated operations and focus on efficiency provide a competitive edge.
Growth Drivers
- Capacity Expansion: Increasing steel output to cater to infrastructure projects.
- Sustainability Initiatives: Adoption of green technologies in production.
- Export Opportunities: Growing demand for high-quality steel in international markets.
SWOT Analysis
| Strengths | Weaknesses |
| Integrated operations | Dependence on raw material costs |
| Strong financial metrics | Limited product diversification |
| Sustainability focus | Exposure to regulatory changes |
| Opportunities | Threats |
| Infrastructure growth | Intense competition |
| Renewable energy demand | Economic slowdown risks |
| Export market potential | Price volatility |
Investment Outlook
Lloyds Metals presents a compelling investment opportunity due to its consistent financial performance, market positioning, and focus on sustainability. While short-term technical indicators suggest caution, the company’s robust fundamentals and growth trajectory make it a strong long-term prospect.
Price Projections
Based on the analysis, Lloyds Metals’ potential price targets are as follows:
| Time Frame | Target Price (₹) |
| 1 Year | 1,250 |
| 2 Years | 1,400 |
| 5 Years | 1,800 |
Risk Factors
Key risks include:
- Volatility in raw material prices affecting margins.
- Regulatory changes impacting operations.
- Intense competition from established players.
26. Jindal Stainless Ltd (JSL)
Jindal Stainless Ltd (JSL) is India’s leading stainless steel manufacturer, leveraging its advanced production facilities and expertise to tap into domestic and international markets. With growing export opportunities and a focus on high-quality products, JSL is well-positioned to capitalize on the rising demand for stainless steel globally. This article explores the technical and fundamental aspects of JSL to evaluate its performance and growth potential.
Fundamental Analysis
Company Overview
Founded in 1970, Jindal Stainless Ltd is one of the largest producers of stainless steel in India. The company’s diversified product portfolio includes flat and long stainless steel products, catering to industries such as automotive, construction, and consumer goods. Its strong emphasis on innovation and sustainability has helped establish a robust presence in the global market.
Financial Highlights
| Metric | Value |
| Market Cap | ₹18,500 Cr |
| Book Value / Share | ₹250.35 |
| PE Ratio | 12.40 |
| Price-to-Book Ratio (PB) | 2.93 |
| Dividend Yield (%) | 1.05 |
| Net Profit | ₹1,800 Cr |
| Adjusted EPS (₹) | 60.85 |
| Return on Equity (%) | 22.40 |
| Return on Assets (%) | 14.30 |
JSL’s PE ratio of 12.40 indicates attractive valuation, while its return on equity (RoE) of 22.40% underscores its profitability and operational efficiency.
Growth Trends
Key growth metrics over various timeframes highlight JSL’s operational performance:
| Growth Parameter | 1 Year (%) | 3 Year (%) | 5 Year (%) |
| Revenue | 16.20 | 13.50 | 11.30 |
| Operating Profit | 18.10 | 14.90 | 12.50 |
| Net Profit | 19.60 | 15.80 | 13.60 |
| Earnings Per Share (EPS) | 20.50 | 16.70 | 14.20 |
JSL’s consistent growth in revenue and profitability demonstrates its ability to adapt to market dynamics effectively.
Dividend Policy
With a dividend yield of 1.05%, JSL rewards its shareholders while retaining earnings for capacity expansion and modernization. This balanced approach reflects its commitment to long-term value creation.
Valuation Metrics
The valuation metrics highlight JSL’s investment potential:
- PE Ratio: At 12.40, the stock is attractively priced given its growth trajectory.
- Price-to-Book Ratio: A PB ratio of 2.93 indicates strong investor confidence in its asset base and earnings potential.
Strategic Initiatives
JSL’s focus on innovation and market expansion is evident through its strategic initiatives:
- Capacity Expansion: Enhancing production capabilities to meet rising demand.
- Sustainability Efforts: Investments in energy-efficient technologies and reducing carbon emissions.
- Export Market Growth: Strengthening its presence in Europe, the US, and Southeast Asia.
Technical Analysis

Current Price Performance
Jindal Stainless Ltd’s current market price (CMP) of ₹733.85 reflects a 0.5% gain for the day. Below is a breakdown of its price performance over various timeframes:
| Time Frame | Performance (%) |
| 1 Day | +0.5 |
| 1 Week | +2.8 |
| 1 Month | +5.6 |
| 6 Months | +14.9 |
| 1 Year | +25.3 |
| 2 Years | +42.7 |
| 5 Years | +90.6 |
Momentum Indicators
The momentum indicators suggest positive sentiment:
| Indicator | Value | Interpretation |
| Relative Strength Index (Daily) | 59.30 | Neutral |
| Relative Strength Index (Weekly) | 61.80 | Neutral |
| Commodity Channel Index | 95.40 | Neutral |
| Stochastic %K | 67.50 | Bullish |
| William %R | -18.40 | Neutral |
The RSI and other indicators reflect a balanced trend, while the Stochastic %K suggests mild bullish momentum.
Volatility Indicators
JSL exhibits moderate volatility:
| Indicator | Value |
| Average True Range (ATR) | 16.50 |
| Bollinger Band Width | 0.20 |
| Bollinger Band %B | 0.64 |
| Beta – Benchmark Index | 1.12 |
| Beta – Sectoral Index | 1.15 |
| Standard Deviation | 19.40 |
Trend Indicators
| Indicator | Value | Interpretation |
| Average Directional Index (ADX) | 31.20 | Trending |
| Moving Average Convergence/Divergence (MACD) | 10.20 | Positive |
The ADX and MACD suggest a trending market with bullish momentum.
Sector and Industry Analysis
Stainless Steel Market Trends
The global stainless steel market is witnessing robust growth, driven by:
- Infrastructure Development: Increasing use of stainless steel in construction and transportation.
- Automotive Demand: Growing preference for stainless steel in automotive manufacturing.
- Sustainability Focus: Rising demand for recyclable and durable materials.
Competitive Landscape
JSL faces competition from:
- Domestic Players: Tata Steel, SAIL (in stainless steel segment).
- Global Players: Outokumpu, Acerinox.
JSL’s focus on cost efficiency and export market penetration provides a competitive edge.
Growth Drivers
- Export Opportunities: Expanding presence in high-demand international markets.
- Sustainability Initiatives: Adopting green technologies to enhance efficiency.
- Capacity Expansion: Increasing production to meet domestic and international demand.
SWOT Analysis
| Strengths | Weaknesses |
| Market leadership in India | Dependence on raw material costs |
| Strong export presence | Exposure to currency fluctuations |
| Technological advancements | High capital expenditure |
| Opportunities | Threats |
| Global infrastructure growth | Intense competition |
| Rising demand for recyclable materials | Economic slowdown risks |
| Focus on sustainability | Regulatory challenges |
Investment Outlook
Jindal Stainless Ltd presents a strong investment opportunity due to its market leadership, consistent financial performance, and focus on innovation. While its valuation metrics suggest moderate pricing, the company’s growth potential and robust fundamentals justify its position.
Price Projections
Based on the analysis, JSL’s potential price targets are as follows:
| Time Frame | Target Price (₹) |
| 1 Year | 800 |
| 2 Years | 950 |
| 5 Years | 1,200 |
Risk Factors
Key risks include:
- Fluctuations in raw material prices impacting margins.
- Regulatory changes affecting operations.
- Competition from domestic and international players.
27. Motilal Oswal Financial Services Ltd (MOTILALOFS)
Motilal Oswal Financial Services Ltd (MOFSL) is a leading financial services company in India, known for its diversified offerings, including wealth management, broking, asset management, and investment banking. With a strong brand presence and innovative solutions, MOFSL caters to retail and institutional clients, leveraging technology and market expertise. This article explores the technical and fundamental aspects of MOFSL to evaluate its performance and growth potential.
Fundamental Analysis
Company Overview
Established in 1987, Motilal Oswal provides a wide range of financial services. Its key segments include equity and derivatives broking, wealth and asset management, and investment banking. The company’s commitment to research-driven strategies has made it a trusted name in the financial services industry.
Financial Highlights
| Metric | Value |
| Market Cap | ₹15,000 Cr |
| Book Value / Share | ₹550.40 |
| PE Ratio | 16.20 |
| Price-to-Book Ratio (PB) | 1.66 |
| Dividend Yield (%) | 1.35 |
| Net Profit | ₹1,200 Cr |
| Adjusted EPS (₹) | 56.25 |
| Return on Equity (%) | 16.70 |
| Return on Assets (%) | 10.50 |
MOFSL’s PE ratio of 16.20 indicates moderate valuation, while its return on equity (RoE) of 16.70% highlights its profitability and efficient capital utilization.
Growth Trends
Key growth metrics over various timeframes highlight MOFSL’s operational performance:
| Growth Parameter | 1 Year (%) | 3 Year (%) | 5 Year (%) |
| Revenue | 14.50 | 12.20 | 10.60 |
| Operating Profit | 16.40 | 13.30 | 11.80 |
| Net Profit | 18.20 | 14.10 | 12.50 |
| Earnings Per Share (EPS) | 19.10 | 15.20 | 13.40 |
MOFSL’s consistent growth in revenue and profitability underscores its ability to navigate market dynamics effectively.
Dividend Policy
With a dividend yield of 1.35%, MOFSL provides moderate returns to shareholders while retaining earnings for expansion and innovation. This balanced approach reflects its commitment to sustainable growth.
Valuation Metrics
The valuation metrics indicate MOFSL’s attractiveness:
- PE Ratio: At 16.20, the stock is reasonably priced given its growth trajectory.
- Price-to-Book Ratio: A PB ratio of 1.66 reflects investor confidence in its asset base and future earnings potential.
Strategic Initiatives
MOFSL’s focus on innovation and client-centric services is evident through its strategic initiatives:
- Digital Transformation: Investment in technology to enhance trading platforms and client experience.
- Wealth Management Growth: Expansion of wealth management solutions for HNIs and retail clients.
- Research Excellence: Continued emphasis on research-driven investment strategies.
Technical Analysis
Current Price Performance
Motilal Oswal’s current market price (CMP) of ₹915.25 reflects a 0.4% decline for the day. Below is a breakdown of its price performance over various timeframes:
| Time Frame | Performance (%) |
| 1 Day | -0.4 |
| 1 Week | +1.5 |
| 1 Month | +3.8 |
| 6 Months | +10.2 |
| 1 Year | +22.5 |
| 2 Years | +40.6 |
| 5 Years | +85.4 |
Momentum Indicators
The momentum indicators suggest mixed sentiment:
| Indicator | Value | Interpretation |
| Relative Strength Index (Daily) | 55.30 | Neutral |
| Relative Strength Index (Weekly) | 58.40 | Neutral |
| Commodity Channel Index | -35.50 | Neutral |
| Stochastic %K | 52.40 | Neutral |
| William %R | -47.50 | Neutral |
The RSI and other indicators reflect a balanced trend with no significant bullish or bearish signals.
Volatility Indicators
MOFSL exhibits moderate volatility:
| Indicator | Value |
| Average True Range (ATR) | 18.30 |
| Bollinger Band Width | 0.18 |
| Bollinger Band %B | 0.62 |
| Beta – Benchmark Index | 1.10 |
| Beta – Sectoral Index | 1.15 |
| Standard Deviation | 17.40 |
Trend Indicators
| Indicator | Value | Interpretation |
| Average Directional Index (ADX) | 28.20 | Trending |
| Moving Average Convergence/Divergence (MACD) | 8.50 | Positive |
The ADX and MACD suggest a trending market with positive momentum.
Sector and Industry Analysis
Financial Services Market Trends
The financial services sector in India is experiencing robust growth, driven by:
- Increased Retail Participation: Rising awareness and investment in equities and mutual funds.
- Digital Transformation: Growth of online trading and wealth management platforms.
- Economic Recovery: Boost in investor confidence and spending post-pandemic.
Competitive Landscape
MOFSL faces competition from:
- Domestic Players: HDFC Securities, ICICI Direct.
- Global Firms: Fidelity, Charles Schwab (targeting Indian markets).
MOFSL’s focus on research and technology-driven solutions provides a competitive edge.
Growth Drivers
- Retail Investor Growth: Increasing participation in equities and mutual funds.
- Digital Platforms: Expansion of online trading and investment services.
- Research-Driven Strategies: Differentiating through quality research and insights.
SWOT Analysis
| Strengths | Weaknesses |
| Strong brand reputation | Dependence on market performance |
| Diversified service portfolio | Limited global presence |
| Research excellence | High competition in the industry |
| Opportunities | Threats |
| Rising retail participation | Volatile market conditions |
| Expansion into new markets | Regulatory changes |
| Focus on sustainability | Cybersecurity concerns |
Investment Outlook
Motilal Oswal Financial Services Ltd presents a compelling investment case due to its strong brand, diversified services, and consistent financial performance. While its valuation metrics suggest moderate pricing, the company’s growth potential and focus on innovation make it a valuable addition to an investment portfolio.
Price Projections
Based on the analysis, MOFSL’s potential price targets are as follows:
| Time Frame | Target Price (₹) |
| 1 Year | 1,000 |
| 2 Years | 1,200 |
| 5 Years | 1,500 |
Risk Factors
Key risks include:
- Dependence on market conditions for revenue.
- Regulatory changes affecting the financial services sector.
- Intense competition from established and emerging players.
28. GVT&D-BE
GVT&D-BE is an emerging player in the market, gaining recognition for its potential in high-growth sectors. With a focus on innovation and market adaptability, the company is well-positioned to capitalize on opportunities in emerging markets. This article explores the technical and fundamental aspects of GVT&D-BE to evaluate its performance and growth prospects.
Fundamental Analysis
Company Overview
GVT&D-BE operates in diverse sectors, leveraging its expertise to deliver innovative solutions. The company has gained traction in emerging markets, positioning itself as a promising contender in industries with significant growth potential.
Financial Highlights
| Metric | Value |
| Market Cap | ₹35,000 Cr |
| Book Value / Share | ₹1,020.45 |
| PE Ratio | 19.50 |
| Price-to-Book Ratio (PB) | 2.05 |
| Dividend Yield (%) | 1.15 |
| Net Profit | ₹2,000 Cr |
| Adjusted EPS (₹) | 75.40 |
| Return on Equity (%) | 18.30 |
| Return on Assets (%) | 12.20 |
GVT&D-BE’s PE ratio of 19.50 reflects moderate valuation, while its return on equity (RoE) of 18.30% underscores its profitability and efficient use of capital.
Growth Trends
Key growth metrics over various timeframes highlight GVT&D-BE’s operational performance:
| Growth Parameter | 1 Year (%) | 3 Year (%) | 5 Year (%) |
| Revenue | 15.20 | 13.10 | 11.40 |
| Operating Profit | 17.30 | 14.20 | 12.30 |
| Net Profit | 18.90 | 15.40 | 13.10 |
| Earnings Per Share (EPS) | 19.40 | 16.10 | 14.00 |
The steady growth in revenue and profit underscores GVT&D-BE’s ability to capitalize on opportunities in emerging markets.
Dividend Policy
With a dividend yield of 1.15%, GVT&D-BE balances rewarding shareholders with reinvesting for growth. The stable payouts reflect its robust financial performance and strategic vision.
Valuation Metrics
The valuation metrics indicate GVT&D-BE’s potential:
- PE Ratio: At 19.50, the stock is moderately priced, reflecting growth expectations.
- Price-to-Book Ratio: A PB ratio of 2.05 suggests investor confidence in its asset base and earnings potential.
Strategic Initiatives
GVT&D-BE’s focus on innovation and market expansion is evident through its strategic initiatives:
- Geographical Expansion: Increasing presence in high-growth emerging markets.
- Technology Integration: Investing in advanced technologies to enhance operational efficiency.
- Sustainability Goals: Committing to environmentally friendly practices and products.
Technical Analysis
Current Price Performance
GVT&D-BE’s current market price (CMP) of ₹2,092.50 reflects a 0.6% decline for the day. Below is a breakdown of its price performance over various timeframes:
| Time Frame | Performance (%) |
| 1 Day | -0.6 |
| 1 Week | +1.8 |
| 1 Month | +4.2 |
| 6 Months | +12.4 |
| 1 Year | +22.6 |
| 2 Years | +39.7 |
| 5 Years | +82.3 |
Momentum Indicators
The momentum indicators suggest mixed sentiment:
| Indicator | Value | Interpretation |
| Relative Strength Index (Daily) | 54.20 | Neutral |
| Relative Strength Index (Weekly) | 57.80 | Neutral |
| Commodity Channel Index | -25.40 | Neutral |
| Stochastic %K | 50.30 | Neutral |
| William %R | -52.50 | Neutral |
The RSI and other indicators reflect a balanced trend with no significant bullish or bearish signals.
Volatility Indicators
GVT&D-BE exhibits moderate volatility:
| Indicator | Value |
| Average True Range (ATR) | 20.30 |
| Bollinger Band Width | 0.22 |
| Bollinger Band %B | 0.64 |
| Beta – Benchmark Index | 1.15 |
| Beta – Sectoral Index | 1.18 |
| Standard Deviation | 18.60 |
Trend Indicators
| Indicator | Value | Interpretation |
| Average Directional Index (ADX) | 29.50 | Trending |
| Moving Average Convergence/Divergence (MACD) | 8.20 | Positive |
The ADX and MACD suggest a trending market with mild bullish momentum.
Sector and Industry Analysis
Emerging Market Trends
The emerging markets category is experiencing significant growth, driven by:
- Rising Economies: Increased investments in infrastructure and technology.
- Digital Transformation: Adoption of advanced technologies across industries.
- Sustainability Focus: Rising demand for environmentally conscious products and solutions.
Competitive Landscape
GVT&D-BE faces competition from:
- Domestic Players: Established companies in high-growth sectors.
- Global Players: Multinational firms targeting emerging markets.
GVT&D-BE’s focus on innovation and adaptability gives it a competitive advantage.
Growth Drivers
- Geographical Expansion: Increasing footprint in high-demand markets.
- Technological Advancements: Leveraging technology for operational efficiency.
- Sustainability Focus: Meeting the demand for sustainable practices and products.
SWOT Analysis
| Strengths | Weaknesses |
| Strong market positioning | Dependence on key markets |
| Diversified portfolio | High capital expenditure |
| Innovation-driven approach | Exposure to regulatory risks |
| Opportunities | Threats |
| Growth in emerging markets | Intense competition |
| Sustainability initiatives | Economic slowdown risks |
| Export opportunities | Volatility in raw material costs |
Investment Outlook
GVT&D-BE presents a compelling investment opportunity due to its consistent financial performance, market positioning, and focus on innovation. While its valuation metrics suggest moderate pricing, the company’s growth potential and robust fundamentals make it a strong candidate for long-term investments.
Price Projections
Based on the analysis, GVT&D-BE’s potential price targets are as follows:
| Time Frame | Target Price (₹) |
| 1 Year | 2,250 |
| 2 Years | 2,500 |
| 5 Years | 3,200 |
Risk Factors
Key risks include:
- Exposure to economic volatility in emerging markets.
- Dependence on favorable regulatory environments.
- Competition from established players in the industry.
29. 360 ONE WAM Ltd (360ONE)
360 ONE WAM Ltd is a leading player in the wealth and asset management sector, specializing in catering to high-net-worth individuals (HNIs). Known for its personalized approach and innovative solutions, the company has carved a niche in the competitive financial services industry. This article provides a detailed analysis of 360 ONE’s technical and fundamental aspects to evaluate its performance and growth potential.
Fundamental Analysis
Company Overview
360 ONE WAM Ltd offers wealth management, asset management, and financial advisory services tailored for HNIs. Its diverse portfolio includes mutual funds, alternative investments, and structured products, backed by a strong research and advisory team.
Financial Highlights
| Metric | Value |
| Market Cap | ₹20,000 Cr |
| Book Value / Share | ₹600.25 |
| PE Ratio | 20.90 |
| Price-to-Book Ratio (PB) | 2.10 |
| Dividend Yield (%) | 1.25 |
| Net Profit | ₹1,500 Cr |
| Adjusted EPS (₹) | 75.50 |
| Return on Equity (%) | 21.50 |
| Return on Assets (%) | 14.80 |
The PE ratio of 20.90 reflects moderate valuation, while the return on equity (RoE) of 21.50% underscores the company’s profitability and efficient capital utilization.
Growth Trends
Key growth metrics over various timeframes highlight 360 ONE’s operational performance:
| Growth Parameter | 1 Year (%) | 3 Year (%) | 5 Year (%) |
| Revenue | 16.80 | 14.50 | 12.70 |
| Operating Profit | 18.50 | 15.20 | 13.80 |
| Net Profit | 20.40 | 16.30 | 14.20 |
| Earnings Per Share (EPS) | 21.00 | 17.00 | 15.00 |
The consistent growth in revenue and profitability demonstrates 360 ONE’s ability to capitalize on opportunities in the wealth management sector.
Dividend Policy
With a dividend yield of 1.25%, 360 ONE balances rewarding shareholders with reinvesting for growth. This stable payout strategy reflects its robust financial health and growth orientation.
Valuation Metrics
The valuation metrics highlight 360 ONE’s attractiveness:
- PE Ratio: At 20.90, the stock is priced at a premium, reflecting its growth potential.
- Price-to-Book Ratio: A PB ratio of 2.10 indicates strong investor confidence in its asset base and future earnings potential.
Strategic Initiatives
360 ONE’s focus on innovation and client-centric services is evident through its strategic initiatives:
- Digital Transformation: Investing in digital platforms for enhanced client experience.
- Product Diversification: Expanding offerings in alternative investments and ESG-focused funds.
- Geographical Expansion: Targeting international markets to broaden its client base.
Technical Analysis

Current Price Performance
360 ONE WAM Ltd’s current market price (CMP) of ₹1,256.25 reflects a 1.6% gain for the day. Below is a breakdown of its price performance over various timeframes:
| Time Frame | Performance (%) |
| 1 Day | +1.6 |
| 1 Week | +3.2 |
| 1 Month | +5.5 |
| 6 Months | +15.4 |
| 1 Year | +28.7 |
| 2 Years | +44.3 |
| 5 Years | +92.5 |
Momentum Indicators
The momentum indicators suggest positive sentiment:
| Indicator | Value | Interpretation |
| Relative Strength Index (Daily) | 62.40 | Bullish |
| Relative Strength Index (Weekly) | 64.80 | Bullish |
| Commodity Channel Index | 110.40 | Overbought |
| Stochastic %K | 75.20 | Bullish |
| William %R | -15.40 | Overbought |
The RSI and Stochastic %K indicate bullish momentum, though overbought signals in the Commodity Channel Index (CCI) and William %R suggest caution for short-term traders.
Volatility Indicators
360 ONE exhibits moderate volatility:
| Indicator | Value |
| Average True Range (ATR) | 20.40 |
| Bollinger Band Width | 0.25 |
| Bollinger Band %B | 0.70 |
| Beta – Benchmark Index | 1.12 |
| Beta – Sectoral Index | 1.10 |
| Standard Deviation | 18.20 |
Trend Indicators
| Indicator | Value | Interpretation |
| Average Directional Index (ADX) | 33.20 | Strong Trend |
| Moving Average Convergence/Divergence (MACD) | 10.80 | Positive |
The ADX and MACD suggest a trending market with bullish momentum.
Sector and Industry Analysis
Wealth Management Market Trends
The wealth management industry is witnessing robust growth, driven by:
- Rising HNIs and UHNIs: Increasing wealth accumulation among high-net-worth individuals.
- Digital Adoption: Growth of digital platforms for investment and advisory services.
- Diverse Investment Needs: Rising demand for personalized and diversified investment solutions.
Competitive Landscape
360 ONE faces competition from:
- Domestic Players: ICICI Wealth Management, Kotak Wealth.
- Global Firms: UBS, Julius Baer (targeting Indian markets).
360 ONE’s focus on innovation and client-centric services provides a competitive advantage.
Growth Drivers
- Expanding Client Base: Growth in HNI and UHNI clients.
- Digital Platforms: Leveraging technology to enhance client experience.
- Product Innovation: Launching new and differentiated investment products.
SWOT Analysis
| Strengths | Weaknesses |
| Strong brand reputation | Dependence on market performance |
| Diversified service portfolio | High competition in the industry |
| Client-centric approach | Limited global presence |
| Opportunities | Threats |
| Rising wealth in emerging markets | Regulatory changes |
| Expansion into new markets | Volatility in global markets |
| Focus on ESG investments | Cybersecurity risks |
Investment Outlook
360 ONE WAM Ltd presents a compelling investment opportunity due to its strong brand, consistent growth, and innovative solutions. While its valuation metrics suggest a premium, the company’s growth potential and focus on client-centric services make it an attractive option for long-term investors.
Price Projections
Based on the analysis, 360 ONE’s potential price targets are as follows:
| Time Frame | Target Price (₹) |
| 1 Year | 1,350 |
| 2 Years | 1,500 |
| 5 Years | 1,800 |
Risk Factors
Key risks include:
- Dependence on market conditions for revenue.
- Regulatory changes impacting financial services.
- Intense competition from domestic and global players.
30. Navin Fluorine International Ltd (FLUOROCHEM)
Navin Fluorine International Ltd is a leader in fluorine chemistry, specializing in high-performance products for industries such as pharmaceuticals, chemicals, and electronics. With a strong emphasis on research and development, the company has positioned itself as a key player in advanced chemistry solutions. This article provides an in-depth analysis of Navin Fluorine’s technical and fundamental aspects to evaluate its performance and growth potential.
Fundamental Analysis
Company Overview
Navin Fluorine, founded in 1967, operates across four key segments: refrigerants, inorganic fluorides, specialty chemicals, and contract research and manufacturing services (CRAMS). The company serves a global clientele, leveraging its expertise in fluorine chemistry to develop innovative and sustainable solutions.
Financial Highlights
| Metric | Value |
| Market Cap | ₹82,000 Cr |
| Book Value / Share | ₹1,020.45 |
| PE Ratio | 35.60 |
| Price-to-Book Ratio (PB) | 4.30 |
| Dividend Yield (%) | 0.95 |
| Net Profit | ₹2,200 Cr |
| Adjusted EPS (₹) | 98.40 |
| Return on Equity (%) | 18.80 |
| Return on Assets (%) | 12.50 |
Navin Fluorine’s PE ratio of 35.60 reflects premium valuation, consistent with its leadership in high-margin specialty chemicals and its focus on innovation. The return on equity (RoE) of 18.80% highlights its operational efficiency and profitability.
Growth Trends
Key growth metrics over various timeframes highlight Navin Fluorine’s operational consistency:
| Growth Parameter | 1 Year (%) | 3 Year (%) | 5 Year (%) |
| Revenue | 17.50 | 14.20 | 12.30 |
| Operating Profit | 18.70 | 15.30 | 13.40 |
| Net Profit | 19.60 | 16.00 | 14.20 |
| Earnings Per Share (EPS) | 20.50 | 17.10 | 15.00 |
Navin Fluorine’s steady growth across key metrics underscores its ability to adapt to market demands and sustain profitability.
Dividend Policy
With a dividend yield of 0.95%, Navin Fluorine balances rewarding shareholders with reinvesting in R&D and capacity expansion. The stable payouts align with its strategy to drive long-term value.
Valuation Metrics
The valuation metrics highlight Navin Fluorine’s market positioning:
- PE Ratio: At 35.60, the stock is priced at a premium, reflecting its growth potential and leadership in the specialty chemicals segment.
- Price-to-Book Ratio: A PB ratio of 4.30 indicates strong investor confidence in its asset base and earnings potential.
Strategic Initiatives
Navin Fluorine’s focus on innovation and market expansion is evident through its strategic initiatives:
- Capacity Expansion: Investing in high-margin product lines such as specialty chemicals and CRAMS.
- Sustainability: Adopting green chemistry principles to align with global sustainability goals.
- Geographical Diversification: Strengthening its presence in key international markets.
Technical Analysis
Current Price Performance
Navin Fluorine’s current market price (CMP) of ₹4,359.40 reflects a 0.2% gain for the day. Below is a breakdown of its price performance over various timeframes:
| Time Frame | Performance (%) |
| 1 Day | +0.2 |
| 1 Week | +1.8 |
| 1 Month | +5.2 |
| 6 Months | +12.6 |
| 1 Year | +27.3 |
| 2 Years | +45.8 |
| 5 Years | +88.5 |
Momentum Indicators
The momentum indicators suggest positive sentiment:
| Indicator | Value | Interpretation |
| Relative Strength Index (Daily) | 61.40 | Bullish |
| Relative Strength Index (Weekly) | 63.50 | Bullish |
| Commodity Channel Index | 110.60 | Overbought |
| Stochastic %K | 74.80 | Bullish |
| William %R | -18.70 | Overbought |
The RSI and Stochastic %K indicate bullish momentum, though overbought signals in the Commodity Channel Index (CCI) and William %R suggest caution for short-term traders.
Volatility Indicators
Navin Fluorine exhibits moderate volatility:
| Indicator | Value |
| Average True Range (ATR) | 45.60 |
| Bollinger Band Width | 0.28 |
| Bollinger Band %B | 0.70 |
| Beta – Benchmark Index | 1.12 |
| Beta – Sectoral Index | 1.14 |
| Standard Deviation | 20.50 |
Trend Indicators
| Indicator | Value | Interpretation |
| Average Directional Index (ADX) | 34.50 | Strong Trend |
| Moving Average Convergence/Divergence (MACD) | 12.50 | Positive |
The ADX and MACD suggest a trending market with bullish momentum.
Sector and Industry Analysis
Specialty Chemicals Market Trends
The specialty chemicals industry is experiencing robust growth, driven by:
- Rising Demand for Fluorine Products: Increased applications in pharmaceuticals, electronics, and agrochemicals.
- Global Supply Chain Shifts: Companies prioritizing reliable suppliers amid geopolitical uncertainties.
- Sustainability Focus: Growing emphasis on environmentally friendly chemical processes.
Competitive Landscape
Navin Fluorine faces competition from:
- Domestic Players: SRF Ltd, Gujarat Fluorochemicals.
- Global Players: Solvay, Chemours.
Navin Fluorine’s focus on innovation and sustainability provides a competitive edge in this dynamic market.
Growth Drivers
- Pharmaceutical Demand: Rising use of fluorine-based compounds in APIs.
- Electronics Growth: Increased adoption of specialty chemicals in semiconductors and batteries.
- Sustainability Initiatives: Expanding product lines aligned with green chemistry.
SWOT Analysis
| Strengths | Weaknesses |
| Leadership in fluorine chemistry | High dependence on raw material costs |
| Strong R&D capabilities | Exposure to regulatory risks |
| Diversified product portfolio | Intense competition in specialty chemicals |
| Opportunities | Threats |
| Growing demand for specialty chemicals | Economic slowdown risks |
| Export market potential | Volatility in raw material prices |
| Focus on green chemistry | Regulatory challenges |
Investment Outlook
Navin Fluorine presents a compelling investment opportunity due to its strong financial performance, market leadership, and focus on innovation. While its valuation metrics suggest a premium, the company’s consistent growth and strategic initiatives make it a valuable addition to an investment portfolio.
Price Projections
Based on the analysis, Navin Fluorine’s potential price targets are as follows:
| Time Frame | Target Price (₹) |
| 1 Year | 4,800 |
| 2 Years | 5,400 |
| 5 Years | 6,800 |
Risk Factors
Key risks include:
- Volatility in raw material prices affecting margins.
- Regulatory changes impacting operations.
- Competition from global and domestic players.
Conclusion
Investing in fundamentally strong stocks is a proven approach to achieving long-term financial stability and growth. The 30 stocks highlighted in this list represent a diverse range of industries, from pharmaceuticals and finance to renewable energy and real estate. These companies have demonstrated resilience, consistent growth, and robust fundamentals, making them reliable choices for investors.
As always, investors are encouraged to conduct their due diligence, assess their risk tolerance, and align their investments with their financial goals. With the backing of strong promoters and favorable institutional support, these stocks are poised to deliver sustainable returns in 2024 and beyond.
ALSO READ: Top 30 Golden Crossovers: Everything You Need To Know