In the backdrop of escalating tensions between Israel and Iran, the Indian stock market witnessed significant fluctuations on April 15, 2024. Key indices, including the NIFTY 50, SENSEX, NIFTY BANK, NIFTY IT, BSE SMALLCAP, NIFTY Midcap 100, and NIFTY 500, experienced notable declines, reflecting investor concerns about geopolitical instability in the Middle East.
NIFTY 50
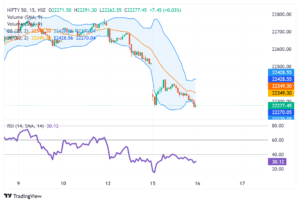
The NIFTY 50, representing the top 50 companies listed on the National Stock Exchange of India, closed at 22,271.15 points, down by 248.25 points or 1.10% from the previous trading day. The index, widely regarded as a benchmark for Indian equity markets, mirrored the overall sentiment of uncertainty and risk aversion among investors.
SOURCE: GROW
SENSEX
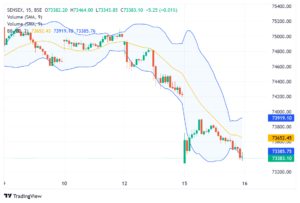
Similarly, the SENSEX, comprising 30 large, actively traded stocks on the Bombay Stock Exchange, registered a decline of 860.82 points or 1.16%, closing at 73,384.08. The broad-based sell-off across various sectors contributed to the downward pressure on the index, as investors sought safer assets amid geopolitical tensions.
NIFTY BANK
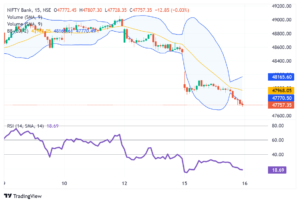
The banking sector, represented by the NIFTY BANK index, witnessed a sharper decline of 804.00 points or 1.66%, closing at 47,760.55. Banks, particularly sensitive to geopolitical risks and global economic uncertainties, faced selling pressure, leading to a notable pullback in the index.
NIFTY IT
The NIFTY IT index, composed of IT companies listed on the NSE, experienced a decline of 538.90 points or 1.54%, closing at 34,479.20. Despite the sector’s resilience in the face of geopolitical events, concerns about disruptions in global supply chains and potential impacts on business operations weighed on investor sentiment.
BSE SMALLCAP
Small-cap stocks, represented by the BSE SMALLCAP index, also faced significant selling pressure, with the index declining by 686.49 points or 1.50%, closing at 45,185.58. Small-cap companies, often perceived as more vulnerable to market volatility, bore the brunt of risk-off sentiment prevailing in the market.
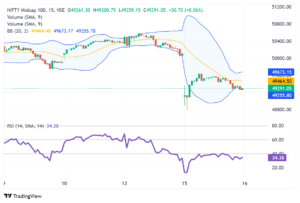
NIFTY Midcap 100
The NIFTY Midcap 100 index, comprising mid-sized companies listed on the NSE, witnessed a decline of 798.75 points or 1.60%, closing at 49,268.80. Mid-cap stocks, exhibiting higher volatility compared to large-caps, experienced amplified price movements amid heightened market uncertainty.
NIFTY 500
The broader NIFTY 500 index, encompassing 500 companies listed on the NSE, closed at 20,473.50, down by 272.00 points or 1.31%. The index, reflecting the overall performance of the Indian equity market, echoed the negative sentiment prevailing among investors.
Let’s have a look into sectoral performance:
1. BSE SmallCap:
Index Value: 45214.76
Change: -657.31
% Change: -1.43
Significance: The BSE SmallCap index tracks the performance of small-cap stocks listed on the Bombay Stock Exchange (BSE). Small-cap companies typically have lower market capitalization and are considered more volatile than large-cap counterparts.
Analysis: The negative change of -1.43% indicates a decline in small-cap stocks on the given day. Small-cap stocks are often more sensitive to market fluctuations and may experience sharper movements compared to large-cap stocks. Factors such as liquidity concerns, regulatory changes, and investor sentiment can significantly influence the performance of small-cap indices.
Implications: A decline in the BSE SmallCap index may suggest investor caution or a broader market correction. However, it could also present buying opportunities for investors seeking higher growth potential, as small-cap stocks often have greater room for expansion.
2. BSE MidCap:
Index Value: 40292.60
Change: -616.43
% Change: -1.51
Significance: The BSE MidCap index comprises stocks of mid-sized companies listed on the Bombay Stock Exchange. Mid-cap stocks generally fall between small-cap and large-cap stocks in terms of market capitalization and risk-return profile.
Analysis: Similar to small-cap stocks, mid-cap stocks exhibited a negative change of -1.51%, indicating a decline in mid-cap segment on the given day. The movement of mid-cap indices is influenced by factors such as economic conditions, sectoral trends, and company-specific developments.
Implications: A decrease in the BSE MidCap index suggests weakness in mid-cap stocks. Investors may interpret this as a signal to reassess their portfolio allocations or explore opportunities within other sectors or market segments.
3. Nifty Auto:
Index Value: 21697.35
Change: -153.95
% Change: -0.70
Significance: The Nifty Auto index tracks the performance of auto sector stocks listed on the National Stock Exchange (NSE). It includes companies involved in manufacturing automobiles, auto parts, and related industries.
Analysis: The Nifty Auto index experienced a relatively modest decline of -0.70%. The performance of the auto sector is influenced by factors such as consumer demand, regulatory changes, input costs, and technological advancements.
Implications: While the decline in the Nifty Auto index is less pronounced compared to small-cap and mid-cap indices, it still warrants attention from investors interested in the automotive sector. Changes in consumer preferences, government policies, or global economic conditions can impact the performance of auto stocks.
4. BSE Cap Goods:
Index Value: 61258.06
Change: -993.67
% Change: -1.60
Significance: The BSE Capital Goods index comprises stocks of companies engaged in the production of capital goods such as machinery, equipment, and infrastructure components.
Analysis: With a significant decrease of -1.60%, the BSE Cap Goods index reflects weakness in the capital goods sector. Factors such as infrastructure spending, industrial production, and global demand for machinery can influence the performance of capital goods stocks.
Implications: The decline in the BSE Cap Goods index may signal challenges within the sector, potentially stemming from subdued demand, supply chain disruptions, or policy uncertainties. Investors monitoring this index may adjust their investment strategies accordingly.
5. BSE Cons Durable, BSE FMCG, BSE Healthcare, BSE Metals:
BSE Cons Durable: 52475.49 (-1.04%)
BSE FMCG: 19151.09 (-0.95%)
BSE Healthcare: 34898.79 (-1.03%)
BSE Metals: 30210.17 (-0.46%)
Significance: These indices represent specific sectors within the economy, including consumer durables, fast-moving consumer goods (FMCG), healthcare, and metals.
Analysis: While each sector experienced varying degrees of decline, the negative changes across these indices suggest a broad-based downturn in consumer-oriented and industrial sectors.
Factors such as demand dynamics, input costs, regulatory changes, and global market trends influence the performance of these sectors.
Implications: Investors with exposure to these sectors may reassess their portfolio allocations and risk exposures in response to the observed downturn.
Understanding the underlying drivers of sectoral performance is essential for making informed investment decisions and managing risk effectively.
Impact of Geopolitical Uncertainty
The conflict between Israel and Iran, two key players in the geopolitically sensitive Middle East region, has historically triggered market volatility and risk aversion globally.
The potential for escalation and its implications for regional stability, oil prices, and global trade, have weighed on investor sentiment, leading to a flight to safety.
The Indian stock market’s reaction to the Israel and Iran conflict underscores the interconnectedness of global events and financial markets.
While geopolitical tensions can lead to short-term market volatility, investors often focus on the underlying fundamentals of the economy and long-term growth prospects.
However, continued geopolitical uncertainty may pose challenges to market stability, warranting cautious investment strategies and risk management approaches.
ALSO READ: Analysis of Recent Developments in the Indian Stock Market