Indian Energy Exchange Limited (IEX) stands as a pivotal player in India’s power sector, specifically in the domain of energy trading. As a power exchange licensed by the Central Electricity Regulatory Commission (CERC), IEX provides an automated platform for spot trading in electricity and trading of Renewable Energy Certificates (RECs) and Energy Saving Certificates (ESCerts). This comprehensive analysis will delve into IEX’s business model, its market position, performance metrics, technical analysis, and prospects to provide a holistic view of the company’s potential as an investment.
Overview of Indian Energy Exchange Limited
IEX is the first and largest energy exchange in India, offering a nationwide, automated trading platform for electricity. The company’s platform enables efficient price discovery and the physical delivery of electricity to its market participants, including distribution companies, captive power plants, and open access consumers. In addition to power trading, IEX has also ventured into the trading of renewable energy certificates (RECs) and energy-saving certificates (ESCerts), positioning itself as a versatile player in the evolving energy landscape.
Core Business and Market Role
IEX’s core business revolves around providing a transparent, efficient, and competitive marketplace for electricity trading. The exchange operates in three primary segments:
- Day-Ahead Market (DAM): This is the primary market for trading electricity on a 15-minute time slot basis, where participants can bid for the next day’s power requirement. DAM helps balance the supply-demand gap and ensures efficient utilization of the available energy.
- Term-Ahead Market (TAM): TAM allows participants to trade contracts ranging from intraday to up to 11 days. This segment caters to entities seeking medium-term solutions for their power requirements.
- Renewable Energy Certificates (RECs): IEX facilitates trading in RECs, allowing entities obligated to purchase renewable energy to fulfill their mandates in a cost-effective manner.
- Energy Saving Certificates (ESCerts): The exchange also deals in ESCerts, which are used by designated consumers to meet their energy-saving targets.
By offering a diversified range of trading options, IEX plays a crucial role in India’s energy market, promoting transparency, efficiency, and price discovery in power trading. As India continues its transition toward a more sustainable energy mix, IEX’s platform is well-positioned to support this shift by facilitating the trade of both conventional and renewable energy.
Performance Analysis
Understanding a company’s performance is essential for making informed investment decisions. IEX’s stock has shown remarkable performance across various time frames, reflecting its growing prominence in the energy sector. Let’s look at how the stock has performed recently:
Key Performance Metrics
- 1-Day Performance: The stock of IEX appreciated by 0.5% in the last trading day, indicating slight upward momentum in the short term.
- 1-Week Performance: Over the past week, IEX has seen a notable gain of 5.5%, suggesting a steady upward trajectory in the short term.
- 1-Month Performance: IEX stock surged by 11.4% in the last month, a significant monthly growth that suggests positive developments, investor sentiment, or favorable market conditions.
- 6-Month Performance: Over the last six months, IEX has demonstrated an impressive growth rate of 45.2%, indicating sustained positive returns, potentially driven by strategic initiatives, sectoral growth, or increased demand for energy trading.
- 1-Year Performance: In the past year, IEX has grown by 51.1%, reflecting the company’s robust market position and ability to capitalize on opportunities in the energy trading sector.
- 2-Year Performance: Over two years, IEX has experienced a cumulative growth of 34.6%, demonstrating consistent performance and a stable growth trajectory.
- 5-Year Performance: IEX has achieved a remarkable increase of 379.9% over the past five years, indicating substantial expansion and increasing market relevance in the power trading sector.
Recent Milestones
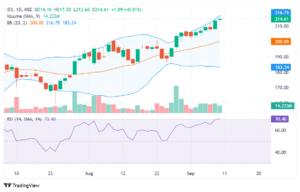
- Crossing 52-Week High: IEX recently closed at Rs. 213.52, which is 0.48% higher than its previous 52-week high of Rs. 212.50. This breakout to a new high is often considered a bullish signal, indicating strong investor confidence and momentum in the stock.
- Increasing Relative Strength: The relative strength (RS) of IEX’s stock against its benchmark index has increased by 0.05 over the last three days. The current RS of 0.11 suggests that the stock is performing better than the benchmark index, which could indicate continued outperformance in the near term.
Financial Overview and Valuation
Key Financial Metrics
- Market Capitalization: IEX has a market cap of ₹19,233.81 Crores, classifying it as a small-cap company in the Indian stock market. This significant market cap reflects the company’s strong presence and its role in the energy trading space.
- Enterprise Value (EV): The enterprise value of IEX is ₹18,846.61 Crores, slightly lower than its market cap, reflecting a balanced capital structure with manageable debt levels and adequate cash reserves.
- Book Value per Share: IEX’s book value per share is ₹11.76, a metric that provides insights into the intrinsic value of the company relative to its current market price.
- Price-Earnings (PE) Ratio: The stock’s PE ratio stands at 51.79, indicating that it trades at a higher multiple of its earnings. A high PE ratio suggests that investors are willing to pay a premium for the stock, likely due to strong growth expectations.
- PEG Ratio: The PEG ratio of 3.15 suggests that the stock may be overvalued relative to its earnings growth rate. A PEG ratio above 1 generally indicates that investors are paying more for growth than is currently being realized.
- Dividend Yield: IEX offers a dividend yield of 1.16%, providing some income to investors in addition to potential capital gains. Although the yield is relatively low, it reflects the company’s strategy to reinvest earnings for growth while still rewarding shareholders.
Technical Analysis of IEX
Technical analysis involves studying historical price movements, volume, and chart patterns to forecast a stock’s future price direction. Let’s dive into a detailed technical analysis of IEX to understand its potential for future growth.
1. Price Trend Analysis
- Current Stock Price: The stock closed at Rs. 213.52, surpassing its previous 52-week high of Rs. 212.50. This breakout to a new high is typically considered a bullish indicator, suggesting strong buying interest and potential for continued upward momentum.
- Overall Trend: IEX has shown consistent upward movement over various time frames, including 1 day, 1 week, 1 month, 6 months, and 1 year. This trend confirms an overall bullish trajectory, with significant gains like 11.4% in one month and 45.2% over six months, highlighting sustained momentum.
2. Relative Strength Index (RSI)
- RSI Level: The Relative Strength Index (RSI) is a momentum oscillator that measures the speed and change of price movements. RSI values range from 0 to 100, with levels above 70 indicating an overbought condition and levels below 30 indicating an oversold condition.
- Current RSI: The RSI of IEX is currently at 0.11, which is relatively low, suggesting that the stock is neither overbought nor oversold. A rising RSI, combined with the stock’s recent breakout to a new high, indicates there is still room for further upside before reaching overbought territory.
3. Moving Averages
- Simple Moving Averages (SMA):
- 50-Day SMA: IEX is trading above its 50-day moving average, indicating a short-term bullish trend. A stock trading above its 50-day moving average is generally considered to be in a positive phase.
- 200-Day SMA: The stock price is also above its 200-day moving average, confirming a long-term bullish trend. Trading above the 200-day SMA provides a strong bullish signal and suggests sustained strength in the stock’s upward movement.
- Moving Average Convergence Divergence (MACD):
- The MACD is a trend-following momentum indicator that shows the relationship between two moving averages of a stock’s price.
- For IEX, the MACD line is currently above the signal line, indicating a bullish crossover. This positive signal suggests strong upward momentum and supports a continuation of the uptrend, providing a buy signal for momentum investors.
4. Volume Analysis
- Volume Trends: Volume is a crucial indicator that reflects the total number of shares traded over a specific period. An increase in volume often confirms the strength of a price move.
- Recent trading sessions have shown above-average volume, especially as the stock reached and broke through its 52-week high. High volume during a breakout indicates strong buying interest, confirming the bullish trend.
- Sustained high volume on up days suggests institutional accumulation, a positive indicator for future price movements.
5. Support and Resistance Levels
- Support Levels:
- The immediate support level for IEX is around Rs. 200, close to the 50-day moving average. If the stock price declines, this level may act as a strong support zone.
- The next key support level is around Rs. 180, which coincides with previous consolidation and buying activity. This level is significant as it represents a prior high, which now acts as a support point.
- Resistance Levels:
- The stock’s recent breakout above Rs. 212.50 sets Rs. 220-225 as the next resistance level. This range could act as a short-term resistance, particularly if there is profit-taking.
- A successful breakout above Rs. 225 with strong volume could lead to further gains, with the next resistance around Rs. 240-250.
6. Chart Patterns
- Ascending Triangle Pattern: The recent price action suggests the formation of an ascending triangle pattern, a bullish continuation pattern characterized by a horizontal resistance line and an upward sloping trend line.
- The stock has been making higher lows while facing resistance around the Rs. 212-215 level. A breakout above this level with substantial volume would confirm the ascending triangle pattern, potentially leading to significant upside.
- Bullish Flag Pattern: In the shorter term, IEX appears to be forming a bullish flag pattern. This pattern typically follows a strong upward move, followed by a period of consolidation with parallel trend lines. A breakout above the upper trend line with high volume could signal the continuation of the prior uptrend.
7. Bollinger Bands
- Current Position: Bollinger Bands consist of a middle band (usually a 20-day SMA) and two outer bands representing standard deviations from the middle band.
- IEX is currently trading near the upper Bollinger Band, which often suggests that the stock is in an overbought condition. However, in a strong uptrend, stocks can continue riding the upper band, and a breakout above the upper band could indicate further bullish momentum.
8. Fibonacci Retracement Levels
- Fibonacci Levels: These levels are used to identify potential support and resistance areas.
- Given the recent move from a low of Rs. 150 to a high of Rs. 213.52, key Fibonacci retracement levels would be around 38.2% (Rs. 186), 50% (Rs. 181), and 61.8% (Rs. 176). These levels could act as potential support in case of a correction.
Investment Insights and Analysis
Reasons to Consider Investing in IEX
- Sectoral Growth and Demand: The increasing focus on renewable energy and efficient energy management is expected to drive demand for robust trading platforms like IEX. The company is strategically positioned to capitalize on these market trends.
- Strong Performance Indicators: IEX’s consistent upward trend, breaking of its 52-week high, and positive RSI and moving averages indicate strong momentum. These technical signals align with positive financial metrics, suggesting further growth potential.
- Bullish Technical Patterns: The presence of bullish patterns like the ascending triangle and bullish flag indicates the likelihood of continued upward momentum, supported by high volumes and positive market sentiment.
- Relative Strength and Volume Signals: The increasing relative strength against the benchmark index and significant trading volumes confirm strong buying interest, potentially indicating institutional participation and confidence in the stock.
Potential Risks and Considerations
- High Valuation: The stock’s high PE and PEG ratios indicate that it is trading at a premium. This could make it susceptible to price corrections if growth expectations are not met.
- Regulatory Risks: Operating under a strict regulatory framework, any changes in regulation or policy by the CERC could impact IEX’s operations and profitability.
- Market Volatility: As a small-cap stock, IEX may experience higher volatility and price fluctuations. Investors should be prepared for potential short-term corrections and adjust their strategies accordingly.
Conclusion
Indian Energy Exchange Limited (IEX) presents a compelling investment opportunity in the energy sector, especially in the domain of power trading. With strong financial performance, bullish technical indicators, and a strategic position in the market, IEX has the potential for both capital appreciation and income generation. However, investors should remain mindful of its high valuation, regulatory environment, and market volatility.
Combining both technical and fundamental analysis provides a well-rounded perspective for making informed investment decisions. For those looking for exposure to the evolving energy market in India, IEX could be a promising addition to their investment portfolio, provided they are willing to accept the associated risks.
ALSO READ: Angel One Limited: A Comprehensive Overview