
As investors and traders prepare for the last trading day of the week, all eyes are on the Nifty index, which appears to be poised for an interesting session. Technical analysis of Nifty’s charts suggests potential opening levels and key support and resistance levels to watch out for during the trading session.
Nifty‘s Potential Opening and Key Levels:
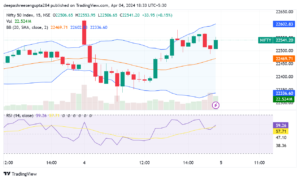
Opening Projection:
Based on the analysis of Nifty’s charts, it’s anticipated that the index may open at or near the level of 22500. This opening projection sets the initial tone for the trading session and serves as a reference point for evaluating market dynamics.
Resistance Levels:
Resistance levels represent price levels at which upward price movements may encounter selling pressure, potentially halting or slowing down the uptrend. In the case of Nifty, several key resistance levels are identified:
22540: The first resistance level to watch out for after the potential opening at 22500. If Nifty manages to surpass this level, it could indicate increasing bullish momentum.
22620: This level represents a significant resistance barrier that could play a pivotal role in determining the index’s upward momentum. Traders will closely monitor price action around this level for signs of a breakout or rejection.
22680: Another crucial resistance level, indicating potential further upside if breached successfully. A decisive move above this level could signal a continuation of the uptrend, with potential targets set at higher price levels.
Support Levels:
Support levels, on the other hand, represent price levels at which downward price movements may find buying interest, potentially halting or slowing down the downtrend. In the case of Nifty, several key support levels are identified:
22430: The first support level below the potential opening at 22500. If Nifty experiences a pullback from higher levels, traders will look for potential buying opportunities around this level to support the index’s price.
22380: A crucial support level that could indicate a reversal in the event of a breakdown below the opening level at 22500. Traders will closely monitor price action around this level for signs of a bounce or further downside potential.
22350: The final support level to watch out for on the lower side. If Nifty breaches this level, it could signal a deeper correction or downtrend, prompting traders to reassess their positions and risk management strategies.
Technical Analysis and Market Sentiment:
Bullish Scenario:
If Nifty manages to open at or above 22500 and successfully breaches the resistance levels at 22540, 22620, and 22680, it could signal a bullish sentiment in the market. Traders may look for opportunities to capitalize on the upward momentum, with potential targets set at higher resistance levels or price targets.
Bearish Scenario:
Conversely, if Nifty opens below 22500 and struggles to maintain support levels, it could indicate a bearish sentiment prevailing in the market. Traders should exercise caution and consider implementing risk management strategies to mitigate potential losses in such a scenario. Key support levels, particularly 22430, 22380, and 22350, would be critical to monitor for signs of a reversal or further downside potential.
Factors Influencing Market Performance:
Several factors could impact Nifty’s performance on the last trading day of the week:
Economic Indicators
GDP Data: Release of GDP figures or economic growth forecasts could influence market sentiment.
Inflation Data: Inflation reports may provide insights into the health of the economy and influence investor behavior.
Interest Rate Decisions: Monetary policy decisions by central banks could affect market dynamics.
Global Market Trends
International Markets: Developments in global markets, particularly major indices like the S&P 500 or FTSE 100, could influence investor sentiment in domestic markets.
Geopolitical Events: Political tensions, trade negotiations, or geopolitical conflicts may impact global markets and trickle down to regional indices.
Sectoral Performance
Sectoral Trends: Performance of specific sectors, such as technology, finance, or healthcare, could drive overall market sentiment.
Corporate Earnings: Earnings reports from major companies within key sectors may impact sectoral performance and overall market direction.
Market Sentiment
Investor Sentiment: Market sentiment indicators, such as the VIX (Volatility Index) or investor surveys, could provide insights into market participants’ outlook.
Technical Analysis: Chart patterns, trend lines, and other technical indicators may guide traders in identifying potential entry and exit points.
As traders gear up for the last trading day of the week, anticipation is high regarding Nifty’s potential performance. Technical analysis suggests opening levels around 22500, with key resistance and support levels to watch out for at 22540, 22620, 22680, 22430, 22380, and 22350.
While the bullish scenario could see Nifty gaining momentum and breaching resistance levels, the bearish scenario warrants caution, with emphasis on monitoring support levels for signs of a reversal or further downside potential. Additionally, factors such as economic indicators, global market trends, sectoral performance, and market sentiment will play a crucial role in shaping Nifty’s trajectory during the trading session.
Ultimately, traders should remain vigilant, adapt to evolving market conditions, and implement sound risk management strategies to navigate the dynamic landscape of the stock market effectively.
ALSO READ: VIP Industries Ltd.: Market Indicators Signal Buy