
A Guide on the Positional Trade of JSW ENERGY
JSW Energy: Positional trading is a strategy where investors hold their positions for an extended period, ranging from several weeks to months, to capture significant price movements. This approach requires a combination of technical analysis, fundamental analysis, and a solid understanding of market trends. In this comprehensive guide, we will delve into positional trading with a focus on JSW Energy, a prominent player in the power generation and distribution sector in India.
About JSW Energy
Company Overview
JSW Energy is a significant player in the Indian power sector, engaging in the generation and distribution of electricity.
The company sells power through a mix of long-term and short-term power purchase agreements and participates in power exchanges in India.
Its customers include state-owned utilities, power trading companies, and various industrial consumers.
Business Model
JSW Energy’s business model focuses on:
– Long-Term Agreements: Providing stable and predictable revenue streams.
– Short-Term Agreements: Offering flexibility to capitalize on market price fluctuations.
– Power Exchanges: Participating in India’s power exchanges to optimize revenue and manage supply and demand.
Market Position
– Sector: Power
– Industry: Power Generation/Distribution
– Market Capitalization: ₹1,07,024.60 crore
– Category: Mid Cap
– Enterprise Value (EV): ₹1,34,144.61 crore
– Book Value / Share: ₹147.82
– Price-Earning Ratio (PE): 62.13
– PEG Ratio: 2.78
– Dividend Yield: 0.33%
Investment Thesis for JSW Energy
Current Price Analysis
– Entry Price: ₹665
– Accumulate More: If the stock price declines to ₹580
– Target Prices: 700-750-800-850-900
Technical Indicators
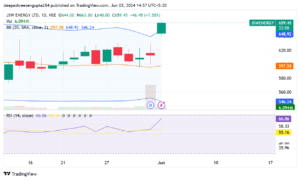
– Reversal from Bottom: The stock has shown signs of reversing from a bottom trend, indicating potential for an upward movement.
– RSI (Relative Strength Index): The RSI is moving in an upward direction, suggesting increased buying interest and momentum.
– Volume and Delivery: Recent trading data indicates a surge in volume and delivery, with volume increasing by 9.9 times and delivery by 14.5 times compared to the 5-day average. This increase, coupled with a 0.66% price movement, indicates strong buying interest.
Insider Deal
– Recent Insider Activity: The JSW Energy Employees Welfare Trust sold 5,167 shares through a market sale. While insider sales can sometimes be a concern, they are not necessarily indicative of negative sentiment and can be part of routine portfolio adjustments.
Technical Analysis of JSW Energy
Reversal Patterns
– Bottom Reversal: The stock is exhibiting a bottom reversal pattern, which is a strong bullish signal indicating that the stock may have reached its lowest point and is now poised to rise.
RSI (Relative Strength Index)
– RSI Movement: An RSI that is shifting upwards generally suggests that the stock is gaining buying interest and is likely to see a price increase. An RSI above 50 is typically considered bullish.
Volume and Delivery
– High Volume: The recent surge in trading volume signifies strong investor interest. High volumes are often associated with significant price movements.
– High Delivery: Increased delivery percentages indicate that investors are taking actual delivery of shares rather than engaging in speculative trading. This is often seen as a positive sign of confidence in the stock’s future performance.
Breakout After Consolidation
– Breakout: JSW Energy is showing signs of a breakout after a prolonged period of consolidation. Breakouts often lead to significant price movements and can provide lucrative opportunities for positional traders.
Fundamental Analysis of JSW Energy
Market Capitalization
– Mid Cap Stock: With a market cap of ₹1,07,024.60 crore, JSW Energy is a mid-cap stock. Mid-cap stocks often offer a balance between growth potential and stability.
Valuation Metrics
– Enterprise Value (EV): ₹1,34,144.61 crore, indicating the total value of the company, including debt and equity.
– Book Value / Share: ₹147.82, providing a measure of the company’s net asset value.
– Price-Earning Ratio (PE): A PE ratio of 62.13 suggests that the stock is trading at a high multiple relative to its earnings. This can be indicative of high growth expectations.
– PEG Ratio: A PEG ratio of 2.78 indicates that the stock might be overvalued considering its growth rate.
– Dividend Yield: A yield of 0.33% provides a modest income stream, which can be attractive for income-focused investors.
Sector and Industry Performance
– Power Sector: JSW Energy operates within the power sector, a critical component of any economy. The sector’s performance can significantly impact the stock’s performance.
– Power Generation/Distribution Industry: The company is involved in both the generation and distribution of power, providing a diversified revenue base.
Positional Trade Strategy for JSW Energy
Entry and Exit Points
– Entry Price: Consider entering at ₹665.
– Accumulate More: If the price drops to ₹580, consider accumulating more shares to lower the average purchase price.
– Target Prices: Set incremental target prices at 700-750-800-850-900 to lock in profits at different stages.
Holding Period
– Hold Duration: Positional trades typically span a few weeks to several months. For JSW Energy, consider holding the position for a few months to capture the full potential of the anticipated price movement.
Risk Management
– Stop Loss: Implement a stop loss to limit potential losses. For JSW Energy, a reasonable stop loss might be set slightly below the entry price to accommodate market fluctuations.
– Portfolio Diversification: Avoid investing all your capital in a single stock. Diversify your portfolio to spread risk across different assets.
Regular Monitoring
– Market News: Stay updated with market news and developments related to JSW Energy and the power sector.
– Stock Performance: Regularly review JSW Energy’s stock performance and adjust your strategy as needed based on technical indicators and market conditions.
Consult a Financial Advisor
Always consult a financial advisor before making any investment decisions. This guide is for educational purposes only and is not a substitute for professional financial advice.
High Volume and Delivery Analysis
Volume Surge
– 9.9 Times Volume Increase: The trading volume for JSW Energy surged by 9.9 times compared to its 5-day average. This significant increase in volume indicates heightened investor interest and potential for strong price movements.
Delivery Surge
– 14.5 Times Delivery Increase: The delivery percentage surged by 14.5 times, suggesting that investors are taking actual delivery of shares rather than engaging in speculative trading. This is often a sign of confidence in the stock’s long-term prospects.
Price Movement
– 0.66% Price Increase: Despite the high volume and delivery, the stock price moved by only 0.66%. This modest price movement amidst high trading activity can indicate accumulation, where large investors are building positions without significantly impacting the price.
Sector and Industry Insights
Power Sector Overview
– Essential Services: The power sector is essential for economic growth and development. It provides the necessary energy for various industries, commercial activities, and households.
– Government Policies: Government initiatives and policies, such as promoting renewable energy and ensuring power availability, can significantly impact the sector’s performance.
Power Generation/Distribution Industry
– Demand-Supply Dynamics: The industry is influenced by demand-supply dynamics, regulatory changes, and technological advancements.
– JSW Energy’s Position: JSW Energy is well-positioned within this industry, with a diversified portfolio of power generation and distribution assets.
Detailed Financial Analysis
Income Statement
– Revenue Growth: Analyze the revenue growth over the past few years. Consistent revenue growth indicates a strong business model and market position.
– Profit Margins: Examine the profit margins to assess operational efficiency. Higher margins suggest better cost management and pricing power.
Balance Sheet
– Asset Base: Review the company’s asset base, including power plants and infrastructure. A strong asset base provides a solid foundation for future growth.
– Debt Levels: Assess the company’s debt levels. High debt can be a concern, but manageable debt with strong cash flows can support expansion.
Cash Flow Statement
– Operating Cash Flow: Positive operating cash flow indicates the company’s ability to generate cash from its core operations.
– Investing Cash Flow: Review the cash flow from investing activities, including capital expenditures on new projects.
– Financing Cash Flow: Analyze the cash flow from financing activities, including debt repayment and dividend payments.
Strategic Insights
Expansion Plans
– New Projects: JSW Energy’s plans for new power projects can drive future growth. This includes investments in renewable energy and expanding capacity.
– Geographical Diversification: Expanding into new geographical areas can reduce dependency on specific markets and increase revenue streams.
Technological Advancements
– Renewable Energy: Emphasis on renewable energy sources such as solar and wind can position JSW Energy as a leader in sustainable energy.
– Efficiency Improvements: Technological advancements in power generation and distribution can improve efficiency and reduce costs.
Regulatory Environment
– Government Policies: Stay informed about government policies and regulations impacting the power sector. Supportive policies can enhance growth prospects.
– Compliance: Ensure that JSW Energy complies with regulatory standards and guidelines to avoid any legal or operational setbacks.
Detailed Technical Analysis
Moving Averages
– Simple Moving Average (SMA): Track the 50-day and 200-day SMAs to understand the long-term trend. If the 50-day SMA crosses above the 200-day SMA, it signals a bullish trend, known as a “Golden Cross.”
– Exponential Moving Average (EMA): The EMA gives more weight to recent prices. Comparing the 20-day EMA with the 50-day EMA can provide insights into short-term trends.
Relative Strength Index (RSI)
– RSI Calculation: RSI measures the magnitude of recent price changes to evaluate overbought or oversold conditions. An RSI above 70 typically indicates that the stock is overbought, while an RSI below 30 suggests it is oversold.
– RSI Divergence: Look for divergences where the price is moving in the opposite direction of the RSI. This can indicate a potential reversal.
Bollinger Bands
– Band Width: Bollinger Bands consist of a middle band (SMA) and an upper and lower band. The distance between the bands (bandwidth) indicates volatility.
– Price Action: Observe if the stock price is touching the upper or lower bands. A move towards the upper band indicates buying pressure, while a move towards the lower band indicates selling pressure.
MACD (Moving Average Convergence Divergence)
– MACD Line and Signal Line: The MACD line is the difference between the 26-day and 12-day EMAs. The signal line is the 9-day EMA of the MACD line. A bullish signal occurs when the MACD line crosses above the signal line.
– Histogram: The histogram shows the difference between the MACD line and the signal line. Positive values indicate bullish momentum, while negative values indicate bearish momentum.
Fibonacci Retracement
– Key Levels: Fibonacci retracement levels (23.6%, 38.2%, 50%, 61.8%, and 78.6%) are used to identify potential support and resistance levels.
– Application: Apply Fibonacci retracement to recent significant price movements to predict potential pullback levels.
Positional Trading Strategy
Entry Strategy
– Initial Entry Point: Buy JSW Energy at ₹665.
– Accumulation Strategy: If the stock price drops to ₹580, accumulate more shares to reduce the average purchase price and enhance potential returns.
Exit Strategy
– Target Prices: Set incremental target prices at ₹700, ₹750, ₹800, ₹850, and ₹900. This allows for partial profit-taking at each level, locking in gains while still participating in potential further upside.
– Trailing Stop Loss: Use a trailing stop loss to protect profits. Adjust the stop loss level as the stock price moves up, maintaining a certain percentage below the current market price.
Risk Management
– Stop Loss: Set an initial stop loss slightly below the entry price, at ₹650, to limit potential losses in case the trade goes against expectations.
– Position Sizing: Determine the size of the position based on your risk tolerance and overall portfolio size. Avoid over-allocating to a single stock to maintain diversification.
Monitoring and Adjusting the Trade
Regular Updates
– Technical Indicators: Continuously monitor key technical indicators such as RSI, MACD, and Bollinger Bands to assess the stock’s performance.
– News and Events: Stay updated with news and events related to JSW Energy and the power sector. Significant news can impact stock prices and may require adjustments to your trading strategy.
Adjusting Targets and Stop Losses
– Revising Targets: If the stock shows strong upward momentum, consider revising your target prices upwards to capture additional gains.
– Adjusting Stop Losses: As the stock price moves up, adjust your trailing stop loss to lock in profits and protect against sudden reversals.
Fundamental Analysis: In-Depth Look
Financial Performance
– Revenue Analysis: Examine the company’s revenue growth over the past five years. Consistent growth indicates a strong market presence and effective business strategy.
– Net Profit Margin: Assess the net profit margin to understand how much of the revenue is converted into profit. A higher margin indicates efficient cost management.
Balance Sheet Strength
– Total Assets and Liabilities: Review the total assets and liabilities to gauge the company’s financial health. A strong balance sheet with manageable debt levels is crucial for long-term sustainability.
– Debt-to-Equity Ratio: Calculate the debt-to-equity ratio to assess the company’s leverage. A lower ratio indicates lower financial risk.
Cash Flow Analysis
– Operating Cash Flow: Positive operating cash flow indicates that the company generates sufficient cash from its core operations to fund its activities.
– Investing Cash Flow: Review the capital expenditures and investments in new projects to understand the company’s growth initiatives.
– Financing Cash Flow: Analyze the cash flow from financing activities, including debt issuance and repayment, dividend payments, and share buybacks.
Dividend Policy
– Dividend Payout Ratio: The dividend payout ratio indicates the percentage of earnings paid out as dividends. A sustainable payout ratio ensures that the company can maintain dividend payments while investing in growth.
– Dividend Yield: A dividend yield of 0.33% provides a modest income stream. Compare this with industry peers to evaluate the attractiveness of the yield.
Strategic Insights: Future Prospects
Expansion and Growth Plans
– Capacity Expansion: JSW Energy’s plans to expand its power generation capacity through new projects, including renewable energy sources like solar and wind, will drive future growth.
– Geographical Diversification: Expanding into new regions reduces market dependency and diversifies revenue streams.
Technological Advancements
– Renewable Energy Initiatives: Investments in renewable energy projects position JSW Energy as a leader in sustainable power generation.
– Efficiency Improvements: Technological advancements in power generation and distribution improve operational efficiency and reduce costs.
Regulatory Environment
– Government Policies: Favorable government policies promoting renewable energy and ensuring power availability support the company’s growth prospects.
– Regulatory Compliance: Adhering to regulatory standards and guidelines ensures smooth operations and minimizes legal risks.
Conclusion: Positional Trade with JSW Energy
JSW Energy presents a compelling opportunity for positional traders due to its strong technical indicators, robust financial performance, and strategic growth initiatives.
The company’s diversified business model, significant market presence, and focus on renewable energy position it well for long-term growth.
Investment Strategy
– Entry Price: Consider entering at ₹665.
– Accumulation: Accumulate more shares if the price drops to ₹580.
– Target Prices: Set incremental targets at ₹700, ₹750, ₹800, ₹850, and ₹900.
– Stop Loss: Implement a stop loss to limit potential losses.
Risk Management
– Diversification: Avoid over-allocating to a single stock. Maintain a diversified portfolio to spread risk.
– Consult a Financial Advisor: Always consult a financial advisor before making any investment decisions. This guide is for educational purposes only and is not a substitute for professional financial advice.
By following this comprehensive strategy, investors can capitalize on the potential upside of JSW Energy while effectively managing risks.
Regular monitoring and adjustments based on market conditions and company performance will help ensure the success of your positional trade.