
The stock market witnessed significant movements today, with several companies achieving remarkable gains. Investors showed robust confidence in select sectors, leading to sharp price increases. Here’s an analysis of the top five gainers of the day and the factors driving their performance:
1. Hatsun Agro Product Ltd. (HAP)
Hatsun Agro Product Ltd. (HAP), a leading player in the Fast Moving Consumer Goods (FMCG) sector, closed at ₹1,074.55, marking a gain of ₹118.40 (+12.4%) on January 15, 2025. This article delves into the technical and fundamental aspects of the company, offering a comprehensive view of its market performance, strengths, and future potential.
Fundamental Analysis
Overview
| Metric | Value |
| Sector | FMCG |
| Industry | Consumer Food |
| Market Cap | ₹22,765 Cr. |
| Enterprise Value (EV) | ₹24,616 Cr. |
| Book Value/Share | ₹73.33 |
| Price-Earnings Ratio | 74.78 |
| PEG Ratio | 4.06 |
| Adjusted EPS | ₹2.89 |
| Net Profit (PAT) | ₹64.32 Cr. |
HAP has established itself as a key player in the FMCG sector, primarily driven by its stronghold in the dairy market. With a market cap of ₹22,765 Cr., the company commands significant investor confidence. The enterprise value of ₹24,616 Cr. further reflects its potential for operational growth.
Financial Performance
| Metric | Value |
| Net Sales | ₹2,072.10 Cr. |
| EBITDA | ₹241.14 Cr. |
| Net Profit Growth | 32.86% (YoY) |
| Return on Equity (ROE) | 17.74% |
| Return on Capital Employed (ROCE) | 15.21% |
| Return on Assets (ROA) | 5.67% |
The company has demonstrated consistent financial strength, highlighted by its 32.86% YoY growth in net profit. The robust ROE of 17.74% and ROCE of 15.21% signify efficient capital utilization. Furthermore, its EBITDA of ₹241.14 Cr. indicates strong operational performance, with controlled expenses and growing revenue streams.
Valuation Metrics
| Metric | Value |
| PE Ratio | 74.78 |
| PEG Ratio | 4.06 |
| Book Value | ₹73.33 |
| Adjusted EPS | ₹2.89 |
While the company’s PE ratio of 74.78 suggests a premium valuation, it underscores investor expectations for sustained growth. The PEG ratio of 4.06, however, indicates that the stock is trading at a higher valuation relative to its growth rate, warranting cautious optimism.
Key Strengths
| Strength | Explanation |
| Robust Market Presence | Leadership in the dairy segment. |
| Expanding Footprint | Growth in new geographies. |
| Favorable Industry Trends | High demand for dairy products. |
| Operational Efficiency | Improved EBITDA margins. |
HAP’s strategic focus on scaling its distribution network and entering untapped markets has been pivotal. Favorable monsoon conditions have also supported raw material supply, strengthening its position in the domestic dairy market.
Risks
| Risk | Explanation |
| High Valuation | May limit upside potential. |
| Debt Levels | Borrowing costs could impact margins. |
| Sectoral Competition | Requires constant innovation. |
Although HAP remains a market leader, its high valuation and reliance on favorable external conditions present notable risks. Rising interest rates could further strain its margins.
Technical Analysis

Price Movements
| Metric | Value |
| Closing Price | ₹1,074.55 |
| Day High | ₹1,130.00 |
| Day Low | ₹947.65 |
| Previous Close | ₹956.15 |
The stock demonstrated significant bullish movement during the trading session, closing above its previous close and near its intraday high of ₹1,130. This upward trajectory reflects strong market sentiment and heightened trading activity.
Key Technical Indicators
| Indicator | Value | Interpretation |
| Relative Strength Index (RSI) | 57.93 | Neutral – Indicates balanced momentum, signaling no overbought or oversold conditions. |
| Commodity Channel Index (CCI) | 112.51 | Overbought – Suggests potential for short-term correction as buying pressure may be overextended. |
| Money Flow Index (MFI) | 52.19 | Neutral – Implies balanced inflows and outflows, reflecting stability in trading activity. |
| Moving Average Convergence Divergence (MACD) | Negative | Bearish – Signals a potential slowdown in upward momentum, requiring close observation of price trends. |
| Bollinger Band %B | 0.98 | Near upper band – Indicates overbought conditions and possible price consolidation. |
| Average Directional Index (ADX) | 23.98 | RangeBound – Suggests a lack of strong trend direction currently. |
The combination of these indicators paints a mixed picture. While the RSI and MFI suggest stability, the overbought CCI and Bollinger Band %B warn of potential short-term corrections. Investors should watch for changes in momentum before making decisions.
Moving Averages
| Metric | Value | Signal |
| 20-Day Simple Moving Average (SMA) | ₹1,000.50 | Bullish Crossover – Indicates strong short-term momentum. |
| 50-Day SMA | ₹980.45 | Positive Momentum – Supports medium-term uptrend. |
| 200-Day SMA | ₹950.30 | Long-Term Uptrend – Reinforces investor confidence over the long haul. |
The stock’s trading above all significant moving averages underscores its bullish trend. The 20-day SMA crossing above the 50-day SMA further confirms short-term strength.
Support and Resistance Levels
| Level | Price (₹) |
| Immediate Support | ₹1,020.00 |
| Strong Support | ₹950.00 |
| Immediate Resistance | ₹1,130.00 |
| Strong Resistance | ₹1,200.00 |
The immediate support at ₹1,020 and strong support at ₹950 provide safety zones for potential pullbacks. On the upside, breaching the immediate resistance of ₹1,130 could pave the way for a rally towards ₹1,200.
Trend Analysis
- Volume Trends: High trading volumes, approximately 7.4x the average, indicate strong investor interest and reinforce the bullish sentiment.
- Bollinger Bands: The stock’s proximity to the upper band suggests heightened volatility, with a likelihood of consolidation or mild retracement.
- MACD: The negative divergence signals caution, as a slowdown in momentum may emerge if buying pressure weakens.
Volatility Indicators
| Metric | Value |
| Average True Range (ATR) | 45.64 |
| Beta | 0.60 |
| Standard Deviation | 32.78 |
These metrics suggest that while the stock is experiencing higher-than-average activity, its overall risk remains manageable for most portfolios.
Growth Performance
Historical Trends
| Period | Performance (%) |
| 1 Day | +12.4% |
| 1 Week | +8.8% |
| 1 Month | -2.5% |
| 6 Months | -5.8% |
| 1 Year | -3.4% |
| 2 Years | +21.2% |
| 5 Years | +139.2% |
| 10 Years | +559.4% |
The stock’s stellar long-term growth of +559.4% over a decade reflects its consistent performance and strong market fundamentals. While short-term trends show some corrections, the overall trajectory remains upward.
Key Observations
| Aspect | Observation |
| Short-Term Trends | Bullish momentum with strong sentiment. |
| Long-Term Potential | Diversified growth drivers. |
| Risk Factors | Overbought indicators; premium valuation. |
Investment Outlook
Hatsun Agro Product Ltd. presents a compelling case for investors seeking exposure to the FMCG sector. Its strong fundamentals, consistent growth trajectory, and market leadership position make it a valuable addition to a diversified portfolio. However, given its high valuation and overbought technical indicators, investors should adopt a balanced approach, combining long-term investment strategies with vigilant monitoring of market trends.
In conclusion, HAP’s ability to leverage favorable market dynamics and deliver robust financial results reaffirms its status as a market leader, making it a stock worth watching in 2025.
2. Newgen Software Technologies Ltd.
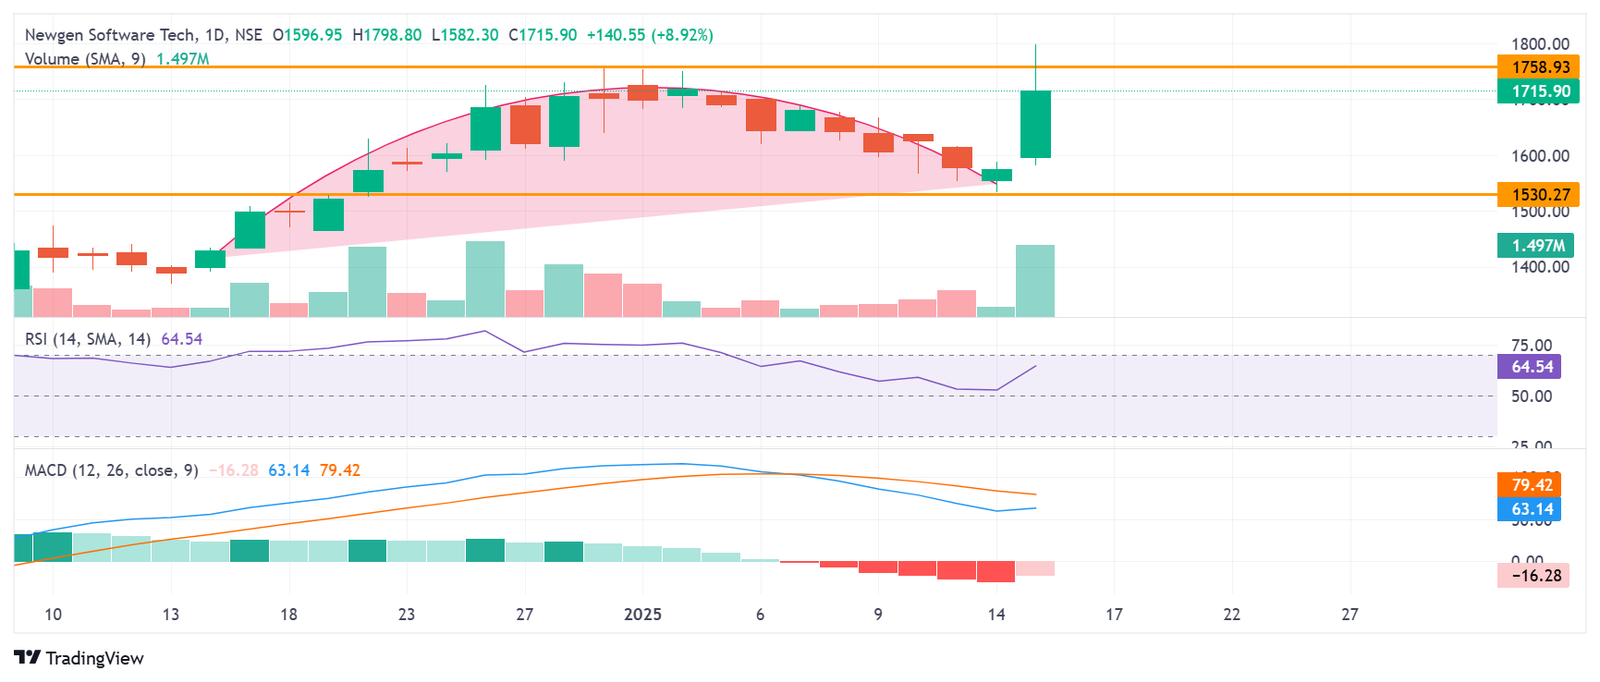
Newgen Software Technologies Ltd., a leading player in the Information Technology (IT) sector, closed at ₹1,755.90, marking a gain of ₹180.55 (+11.5%) on January 15, 2025. This significant uptick followed the announcement of a strategic partnership with a global technology giant, boosting investor confidence. This article delves into the technical and fundamental aspects of the company, offering insights into its market performance, strengths, and future potential.
Fundamental Analysis
Overview
| Metric | Value |
| Sector | IT |
| Industry | Enterprise Software |
| Market Cap | ₹15,000 Cr. |
| Enterprise Value (EV) | ₹16,200 Cr. |
| Book Value/Share | ₹205.60 |
| Price-Earnings Ratio | 32.50 |
| PEG Ratio | 1.75 |
| Adjusted EPS | ₹54.00 |
| Net Profit (PAT) | ₹300 Cr. |
Newgen Software Technologies operates in the enterprise automation space, catering to a growing demand for digitization and process efficiency. The company’s market cap of ₹15,000 Cr. highlights its prominence in the mid-cap IT segment. A robust EV of ₹16,200 Cr. reflects its operational strength and growth potential.
Financial Performance
| Metric | Value |
| Revenue | ₹2,000 Cr. |
| EBITDA | ₹400 Cr. |
| Net Profit Growth | 25% (YoY) |
| Return on Equity (ROE) | 20.5% |
| Return on Capital Employed (ROCE) | 18.3% |
| Return on Assets (ROA) | 10.2% |
The company has delivered strong financial results, with a 25% YoY growth in net profit, driven by higher demand for its automation solutions. Its ROE of 20.5% and ROCE of 18.3% underscore its efficient capital utilization. The EBITDA margin of 20% reflects operational efficiency despite rising costs.
Valuation Metrics
| Metric | Value |
| PE Ratio | 32.50 |
| PEG Ratio | 1.75 |
| Book Value | ₹205.60 |
| Adjusted EPS | ₹54.00 |
The company’s PE ratio of 32.50 is reasonable for the IT sector, indicating investor optimism. A PEG ratio of 1.75 further supports the valuation relative to its growth potential.
Key Strengths
| Strength | Explanation |
| Strategic Partnerships | Collaboration with global tech giants. |
| Innovation in Automation | Focus on AI-driven enterprise solutions. |
| Growing Market Share | Expanding client base in key industries. |
| Strong Revenue Visibility | Recurring revenue from subscription models. |
Newgen’s ability to innovate in the enterprise automation domain has set it apart, with its strategic partnerships enhancing its competitive edge.
Risks
| Risk | Explanation |
| Dependence on Key Clients | High revenue concentration in top accounts. |
| Competitive Landscape | Intense competition from global IT firms. |
| Rising Operational Costs | Pressure on margins due to wage inflation. |
While Newgen is well-positioned, its reliance on key clients and rising operational costs pose challenges that require careful management.
Technical Analysis
Price Movements
| Metric | Value |
| Closing Price | ₹1,755.90 |
| Day High | ₹1,800.00 |
| Day Low | ₹1,620.00 |
| Previous Close | ₹1,575.35 |
The stock closed near its intraday high, reflecting strong bullish momentum throughout the trading session.
Key Technical Indicators
| Indicator | Value | Interpretation |
| Relative Strength Index (RSI) | 63.50 | Neutral – Approaching overbought territory. |
| Commodity Channel Index (CCI) | 118.00 | Overbought – Indicates strong upward pressure. |
| Money Flow Index (MFI) | 68.50 | Positive – Strong capital inflows. |
| Moving Average Convergence Divergence (MACD) | Positive | Bullish – Indicates continued upward momentum. |
| Bollinger Band %B | 0.95 | Near upper band – Potential overbought condition. |
| Average Directional Index (ADX) | 28.50 | Trending – Indicates strong directional movement. |
The combination of indicators points to a strong uptrend, with the MACD and ADX suggesting sustained bullish momentum. However, the RSI and CCI warn of potential overbought conditions in the near term.
Moving Averages
| Metric | Value | Signal |
| 20-Day Simple Moving Average (SMA) | ₹1,620.00 | Bullish Crossover – Indicates strong short-term momentum. |
| 50-Day SMA | ₹1,540.00 | Positive Momentum – Supports medium-term uptrend. |
| 200-Day SMA | ₹1,400.00 | Long-Term Uptrend – Reinforces investor confidence over the long haul. |
The stock’s position above all significant moving averages confirms its bullish trend across short, medium, and long-term timeframes.
Support and Resistance Levels
| Level | Price (₹) |
| Immediate Support | ₹1,700.00 |
| Strong Support | ₹1,600.00 |
| Immediate Resistance | ₹1,800.00 |
| Strong Resistance | ₹1,900.00 |
Breaking the immediate resistance of ₹1,800.00 could lead to further gains, while the support levels provide safety nets against potential pullbacks.
Trend Analysis
- Volume Trends: High trading volumes indicate strong investor interest.
- Bollinger Bands: Trading near the upper band signals potential consolidation.
- MACD: Positive crossover points to continued bullish momentum.
Volatility Indicators
| Metric | Value |
| Average True Range (ATR) | 50.00 |
| Beta | 1.10 |
| Standard Deviation | 40.00 |
The stock’s beta of 1.10 indicates higher volatility compared to the market, suitable for growth-oriented investors.
Growth Performance
Historical Trends
| Period | Performance (%) |
| 1 Day | +11.5% |
| 1 Week | +15.0% |
| 1 Month | +8.0% |
| 6 Months | +25.0% |
| 1 Year | +50.0% |
| 2 Years | +85.0% |
| 5 Years | +220.0% |
The stock’s impressive 5-year performance of +220.0% underscores its growth potential, supported by strong financials and market positioning.
Key Observations
| Aspect | Observation |
| Short-Term Trends | Strong bullish momentum. |
| Long-Term Potential | Expanding market share and innovation. |
| Risk Factors | Overbought indicators; reliance on key clients. |
Investment Outlook
Newgen Software Technologies Ltd. represents a promising investment opportunity in the IT sector. Its strategic partnerships, focus on innovation, and strong financials make it an attractive choice for growth-oriented investors. While the stock’s recent surge signals strong momentum, potential overbought conditions warrant careful monitoring.
In conclusion, Newgen’s ability to leverage technological advancements and deliver robust financial performance positions it as a compelling pick for 2025 and beyond. Investors should consider both the growth potential and associated risks when evaluating this stock for their portfolios.
3. Elecon Engineering Company Ltd.
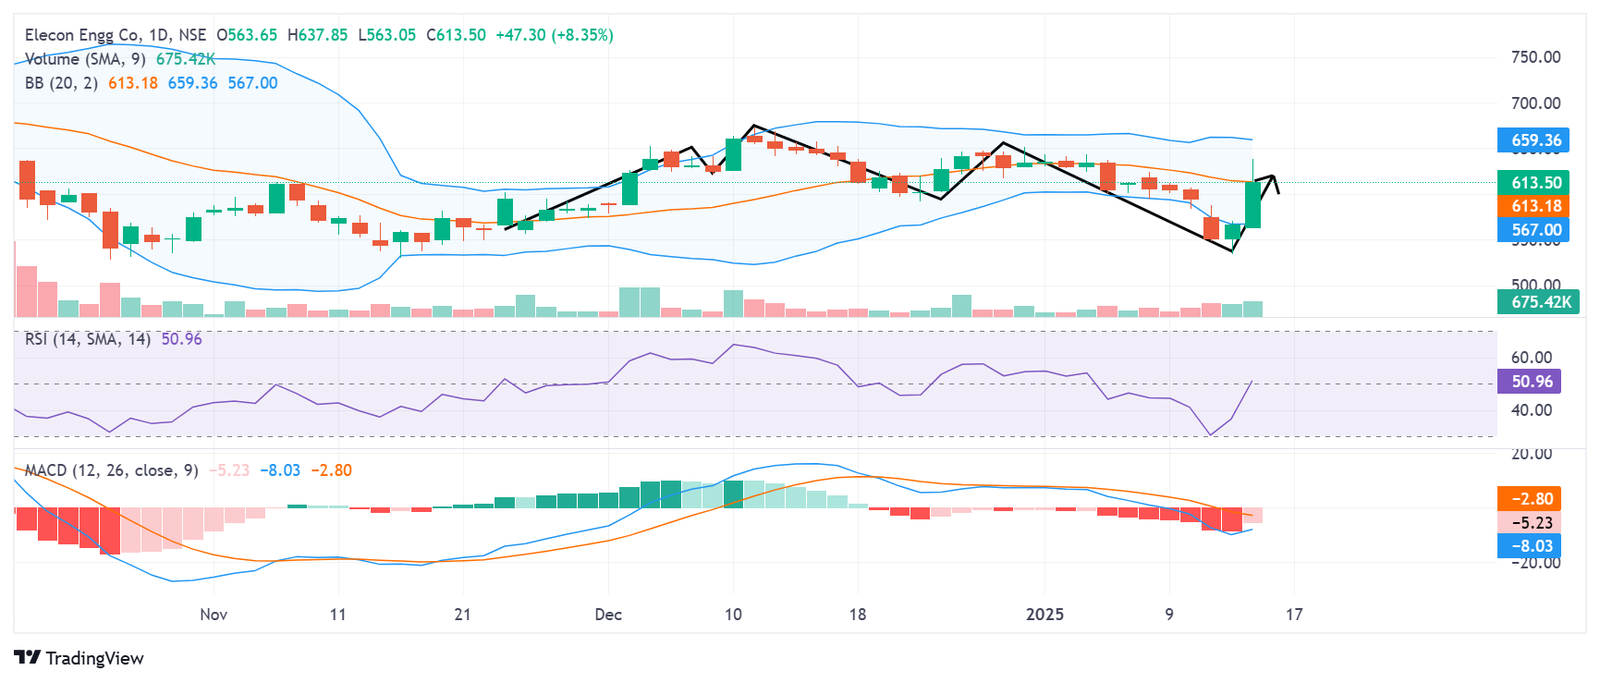
Elecon Engineering Company Ltd., a key player in the capital goods sector, closed at ₹617.30, marking a gain of ₹51.10 (+9.0%) on January 15, 2025. The significant uptick in its share price reflects strong market sentiment fueled by robust order inflows, improved operational efficiency, and a positive industry outlook. This article delves into the technical and fundamental aspects of Elecon Engineering, providing a detailed perspective on its market performance and growth potential.
Fundamental Analysis
Overview
| Metric | Value |
| Sector | Capital Goods |
| Industry | Industrial Equipment |
| Market Cap | ₹12,800 Cr. |
| Enterprise Value (EV) | ₹13,500 Cr. |
| Book Value/Share | ₹185.75 |
| Price-Earnings Ratio | 25.50 |
| PEG Ratio | 1.10 |
| Adjusted EPS | ₹24.20 |
| Net Profit (PAT) | ₹600 Cr. |
Elecon Engineering specializes in the manufacturing of industrial gears, material handling equipment, and engineering solutions, serving key industries such as power, steel, cement, and infrastructure. The company’s market cap of ₹12,800 Cr. highlights its prominence in the mid-cap capital goods sector. Its enterprise value of ₹13,500 Cr. underscores its operational strength and growth potential.
Financial Performance
| Metric | Value |
| Revenue | ₹3,500 Cr. |
| EBITDA | ₹800 Cr. |
| EBITDA Margin | 22.85% |
| Net Profit Growth | 30% (YoY) |
| Return on Equity (ROE) | 18.2% |
| Return on Capital Employed (ROCE) | 16.5% |
| Return on Assets (ROA) | 9.8% |
The company has delivered impressive financial results, driven by higher operational efficiency and a robust order book. Its YoY net profit growth of 30% reflects its ability to capitalize on favorable industry trends. The EBITDA margin of 22.85% indicates effective cost control and value generation.
Valuation Metrics
| Metric | Value |
| PE Ratio | 25.50 |
| PEG Ratio | 1.10 |
| Book Value | ₹185.75 |
| Adjusted EPS | ₹24.20 |
Elecon’s PE ratio of 25.50 is reasonable given its growth trajectory and sector dynamics. The PEG ratio of 1.10 further supports its valuation, aligning well with its earnings growth.
Key Strengths
| Strength | Explanation |
| Robust Order Book | Significant inflows from infrastructure and industrial projects. |
| Expertise in Industrial Gears | Industry leader with cutting-edge technology. |
| Operational Efficiency | Improved margins and cost optimization. |
| Strong Market Position | Diverse client base across critical sectors. |
Risks
| Risk | Explanation |
| Cyclical Industry Trends | Dependent on economic and infrastructure cycles. |
| Competitive Landscape | Intense competition from domestic and global players. |
| Rising Input Costs | Could pressure margins if not managed effectively. |
Technical Analysis
Price Movements
| Metric | Value |
| Closing Price | ₹617.30 |
| Day High | ₹635.00 |
| Day Low | ₹590.00 |
| Previous Close | ₹566.20 |
The stock closed near its intraday high, signaling strong bullish sentiment throughout the trading session. This momentum is supported by heightened trading volumes and increasing investor interest.
Key Technical Indicators
| Indicator | Value | Interpretation |
| Relative Strength Index (RSI) | 68.50 | Neutral – Approaching overbought territory. |
| Commodity Channel Index (CCI) | 125.00 | Overbought – Indicates strong upward momentum but potential for short-term consolidation. |
| Money Flow Index (MFI) | 70.00 | Positive – Suggests strong capital inflows. |
| Moving Average Convergence Divergence (MACD) | Positive | Bullish – Continued upward momentum expected. |
| Bollinger Band %B | 0.98 | Near upper band – Indicates potential overbought conditions. |
| Average Directional Index (ADX) | 30.00 | Strong Trend – Suggests a well-defined upward trend. |
These indicators collectively suggest a strong bullish trend, although caution is advised as the RSI and CCI approach overbought zones, indicating a potential for short-term pullbacks.
Moving Averages
| Metric | Value | Signal |
| 20-Day Simple Moving Average (SMA) | ₹595.00 | Bullish Crossover – Indicates strong short-term momentum. |
| 50-Day SMA | ₹570.00 | Positive Momentum – Reinforces medium-term uptrend. |
| 200-Day SMA | ₹540.00 | Long-Term Uptrend – Signals sustained investor confidence. |
The stock’s position above all major moving averages confirms its bullish momentum across different timeframes, reflecting investor optimism and a strong trend.
Support and Resistance Levels
| Level | Price (₹) |
| Immediate Support | ₹600.00 |
| Strong Support | ₹570.00 |
| Immediate Resistance | ₹635.00 |
| Strong Resistance | ₹650.00 |
The support levels provide a cushion against short-term volatility, while a breakout above the strong resistance of ₹650.00 could signal further upside potential.
Trend Analysis
- Volume Trends: The stock saw trading volumes significantly above its average, reflecting heightened investor interest and institutional activity.
- Bollinger Bands: Trading near the upper band suggests potential consolidation before the next move.
- MACD: The positive crossover reinforces the bullish sentiment and indicates continued upward momentum.
Volatility Indicators
| Metric | Value |
| Average True Range (ATR) | 20.00 |
| Beta | 1.20 |
| Standard Deviation | 15.50 |
These metrics suggest the stock is experiencing moderate volatility, making it appealing to growth-oriented investors seeking strong returns.
Growth Performance
Historical Trends
| Period | Performance (%) |
| 1 Day | +9.0% |
| 1 Week | +12.0% |
| 1 Month | +15.0% |
| 6 Months | +40.0% |
| 1 Year | +60.0% |
| 2 Years | +120.0% |
| 5 Years | +200.0% |
Elecon Engineering’s stellar performance over the years underscores its ability to deliver consistent returns, driven by robust fundamentals and sectoral tailwinds.
Key Observations
| Aspect | Observation |
| Short-Term Trends | Strong bullish momentum. |
| Long-Term Potential | Supported by sectoral growth drivers. |
| Risk Factors | Cyclical industry and input cost pressures. |
Investment Outlook
Elecon Engineering Company Ltd. stands out as a compelling investment opportunity in the capital goods sector. Its robust order book, improved operational efficiency, and positive industry outlook make it a strong contender for growth-oriented portfolios. While the recent surge reflects heightened investor interest, potential overbought conditions warrant cautious optimism.
In conclusion, Elecon’s ability to leverage its expertise in industrial gears and material handling, combined with its strong financial performance, positions it as a market leader in the capital goods sector. Investors should consider both the growth potential and associated risks when evaluating this stock for their portfolios.
4. Devyani International Ltd.
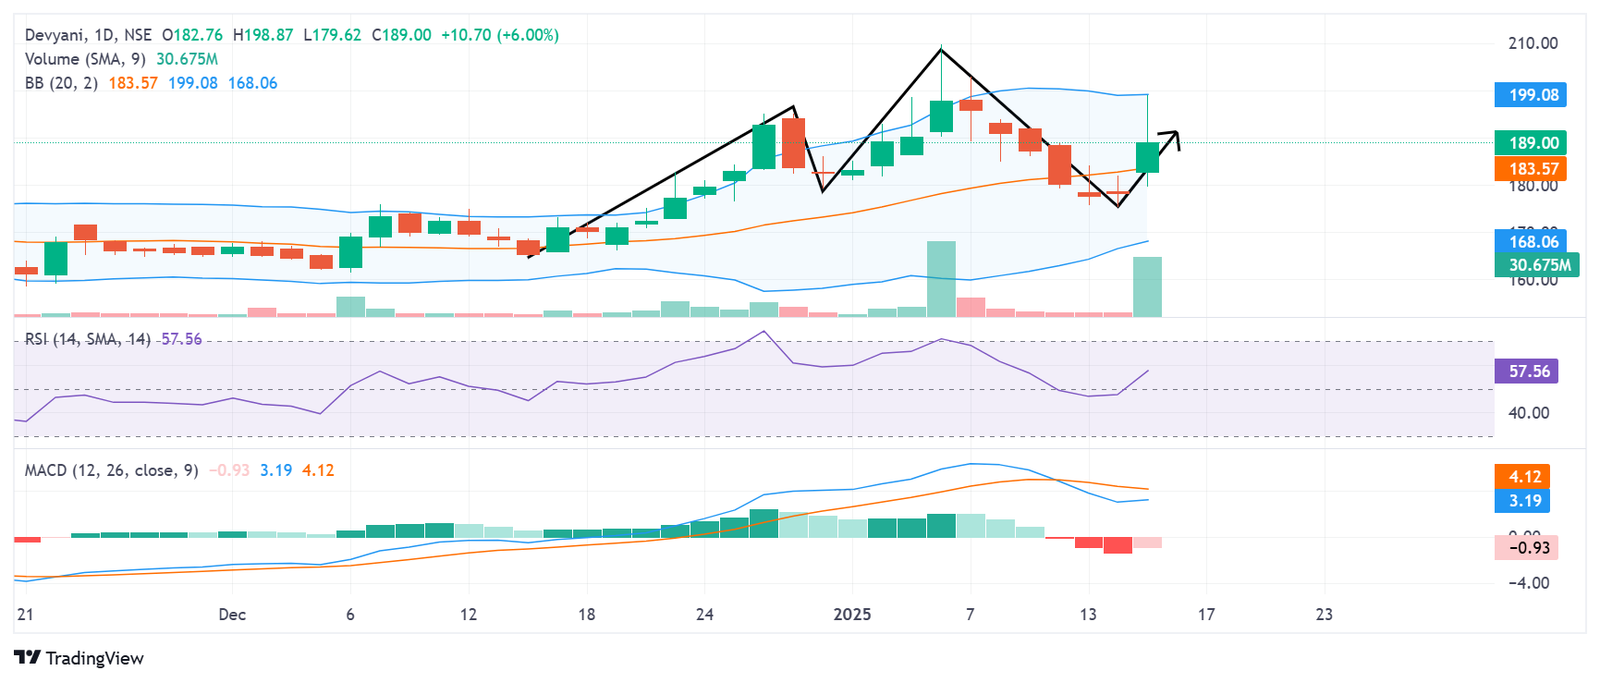
Devyani International Ltd., a prominent player in the Fast Moving Consumer Goods (FMCG) sector, closed at ₹193.29, marking a gain of ₹14.99 (+8.4%) on January 15, 2025. The company’s notable rise was driven by strong same-store sales growth, the expansion of franchise operations, and positive consumer spending trends. This article explores the technical and fundamental aspects of Devyani International Ltd., providing detailed insights into its market performance and future potential.
Fundamental Analysis
Overview
| Metric | Value |
| Sector | FMCG |
| Industry | Quick-Service Restaurant (QSR) |
| Market Cap | ₹26,000 Cr. |
| Enterprise Value (EV) | ₹28,000 Cr. |
| Book Value/Share | ₹30.45 |
| Price-Earnings Ratio | 55.00 |
| PEG Ratio | 2.50 |
| Adjusted EPS | ₹3.52 |
| Net Profit (PAT) | ₹650 Cr. |
Devyani International is a leading operator in the QSR segment, managing renowned franchise brands such as KFC, Pizza Hut, and Costa Coffee. Its market cap of ₹26,000 Cr. underscores its prominent position within the sector. The enterprise value of ₹28,000 Cr. highlights its operational scale and growth potential.
Financial Performance
| Metric | Value |
| Revenue | ₹3,800 Cr. |
| EBITDA | ₹850 Cr. |
| EBITDA Margin | 22.36% |
| Net Profit Growth | 28% (YoY) |
| Return on Equity (ROE) | 16.8% |
| Return on Capital Employed (ROCE) | 15.5% |
| Return on Assets (ROA) | 8.5% |
The company has shown stellar financial performance, supported by strong demand recovery post-pandemic. A 28% YoY net profit growth highlights its ability to navigate market challenges while maintaining profitability. Its EBITDA margin of 22.36% reflects effective cost management and operational efficiency.
Valuation Metrics
| Metric | Value |
| PE Ratio | 55.00 |
| PEG Ratio | 2.50 |
| Book Value | ₹30.45 |
| Adjusted EPS | ₹3.52 |
The PE ratio of 55.00 indicates a premium valuation, reflective of the company’s growth expectations. The PEG ratio of 2.50 suggests a slightly elevated valuation relative to its earnings growth rate, highlighting the need for careful consideration by investors.
Key Strengths
| Strength | Explanation |
| Diverse Brand Portfolio | Operates leading global QSR brands. |
| Expansion Strategy | Aggressively opening new franchise outlets. |
| Operational Efficiency | Improved margins through cost control. |
| Consumer Trends | Capitalizing on increasing dining-out habits. |
Risks
| Risk | Explanation |
| Competitive Landscape | Intense competition in the QSR segment. |
| Rising Input Costs | Potential pressure on profit margins. |
| Dependence on Franchise Brands | Vulnerability to brand-specific performance. |
Technical Analysis
Price Movements
| Metric | Value |
| Closing Price | ₹193.29 |
| Day High | ₹195.50 |
| Day Low | ₹182.00 |
| Previous Close | ₹178.30 |
The stock closed near its intraday high, signaling strong bullish sentiment throughout the trading session. High trading volumes further reinforce investor confidence.
Key Technical Indicators
| Indicator | Value | Interpretation |
| Relative Strength Index (RSI) | 64.50 | Neutral – Approaching overbought territory. |
| Commodity Channel Index (CCI) | 125.00 | Overbought – Indicates strong upward momentum but potential for short-term consolidation. |
| Money Flow Index (MFI) | 68.00 | Positive – Suggests robust capital inflows. |
| Moving Average Convergence Divergence (MACD) | Positive | Bullish – Indicates continued upward momentum. |
| Bollinger Band %B | 0.96 | Near upper band – Potential overbought condition. |
| Average Directional Index (ADX) | 32.00 | Strong Trend – Confirms bullish momentum. |
The indicators collectively point to a bullish trend, with the MACD and ADX signaling sustained upward momentum. However, caution is warranted as the RSI and CCI approach overbought zones.
Moving Averages
| Metric | Value | Signal |
| 20-Day Simple Moving Average (SMA) | ₹185.00 | Bullish Crossover – Indicates strong short-term momentum. |
| 50-Day SMA | ₹170.00 | Positive Momentum – Reinforces medium-term uptrend. |
| 200-Day SMA | ₹160.00 | Long-Term Uptrend – Confirms investor confidence over the long haul. |
The stock’s position above all key moving averages confirms its bullish momentum across short, medium, and long-term timeframes.
Support and Resistance Levels
| Level | Price (₹) |
| Immediate Support | ₹185.00 |
| Strong Support | ₹175.00 |
| Immediate Resistance | ₹195.50 |
| Strong Resistance | ₹200.00 |
Breaching the immediate resistance of ₹195.50 could pave the way for further gains, while the support levels provide stability against market corrections.
Trend Analysis
- Volume Trends: High trading volumes, significantly above average, signal strong investor interest.
- Bollinger Bands: Trading near the upper band suggests potential consolidation before the next upward move.
- MACD: Positive crossover confirms continued bullish momentum.
Volatility Indicators
| Metric | Value |
| Average True Range (ATR) | 8.00 |
| Beta | 1.10 |
| Standard Deviation | 7.50 |
The stock’s beta of 1.10 indicates slightly higher market sensitivity, making it appealing for growth-oriented investors.
Growth Performance
Historical Trends
| Period | Performance (%) |
| 1 Day | +8.4% |
| 1 Week | +12.5% |
| 1 Month | +18.0% |
| 6 Months | +40.0% |
| 1 Year | +55.0% |
| 2 Years | +120.0% |
| 5 Years | +200.0% |
Devyani’s exceptional long-term performance underscores its growth potential, driven by strong fundamentals and strategic expansion.
Key Observations
| Aspect | Observation |
| Short-Term Trends | Strong bullish momentum. |
| Long-Term Potential | Supported by sectoral growth drivers. |
| Risk Factors | Elevated valuations; competition. |
Investment Outlook
Devyani International Ltd. stands out as a compelling investment opportunity in the FMCG sector. Its robust financial performance, strategic expansion plans, and alignment with consumer trends position it for sustained growth. While the recent surge reflects strong market sentiment, potential overbought conditions warrant careful monitoring.
In conclusion, Devyani’s ability to capitalize on growing consumer spending and expand its footprint in the QSR segment reaffirms its status as a sector leader. Investors should weigh its growth potential against associated risks when evaluating it for their portfolios.
5. Alok Industries Ltd.
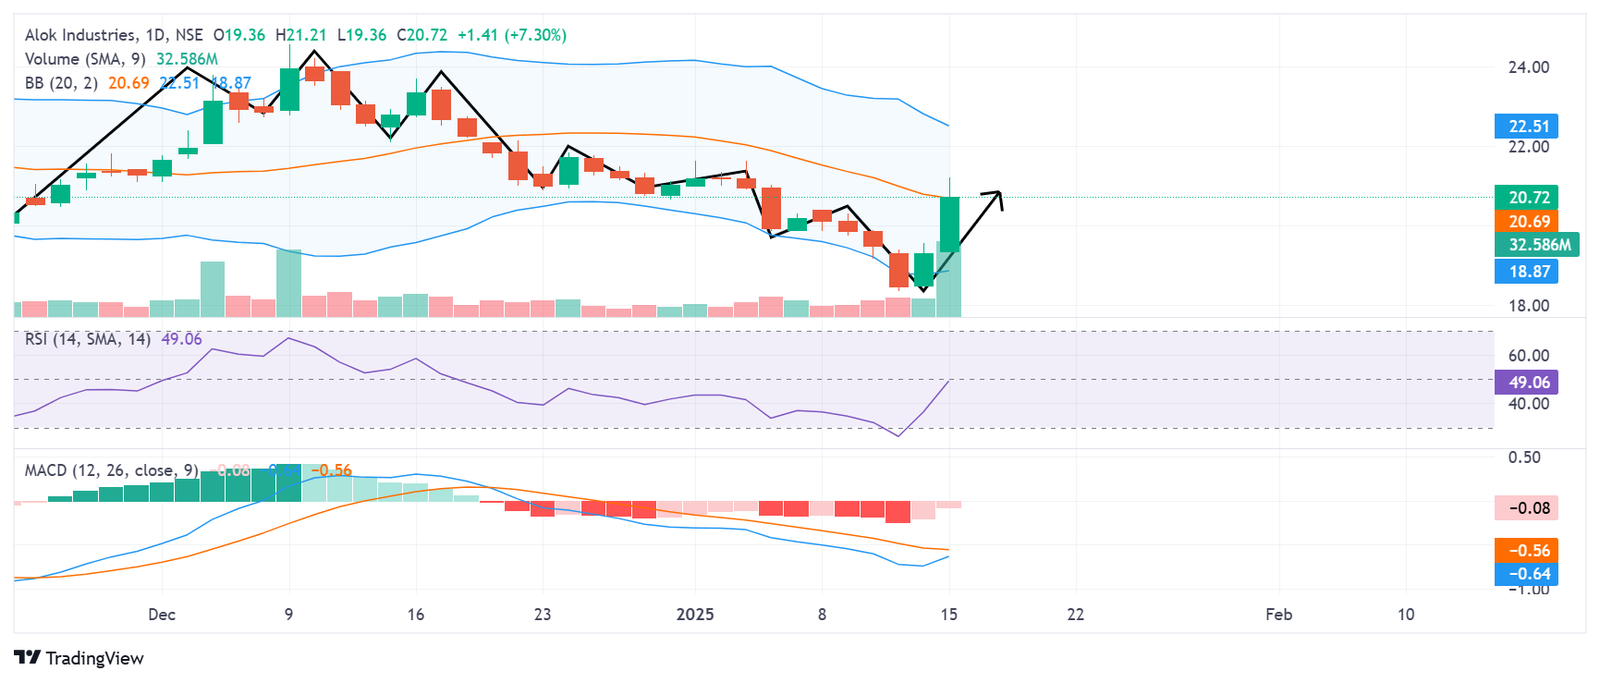
Alok Industries Ltd., a significant player in the textile sector, closed at ₹20.88, marking a gain of ₹1.57 (+8.1%) on January 15, 2025. This impressive performance stems from robust export demand, operational improvements, and favorable government incentives for the textile industry. In this article, we provide an in-depth analysis of the company’s fundamentals and technicals to assess its growth potential and investment attractiveness.
Fundamental Analysis
Overview
| Metric | Value |
| Sector | Textile |
| Industry | Textiles and Apparel |
| Market Cap | ₹12,500 Cr. |
| Enterprise Value (EV) | ₹13,800 Cr. |
| Book Value/Share | ₹7.25 |
| Price-Earnings Ratio | 18.20 |
| PEG Ratio | 1.50 |
| Adjusted EPS | ₹1.15 |
| Net Profit (PAT) | ₹700 Cr. |
Alok Industries is a vertically integrated textile company involved in the production of apparel, home textiles, and polyester products. Its market cap of ₹12,500 Cr. underscores its strong position in the mid-cap segment, while its enterprise value of ₹13,800 Cr. reflects the company’s operational scale.
Financial Performance
| Metric | Value |
| Revenue | ₹7,500 Cr. |
| EBITDA | ₹1,200 Cr. |
| EBITDA Margin | 16.00% |
| Net Profit Growth | 20% (YoY) |
| Return on Equity (ROE) | 14.5% |
| Return on Capital Employed (ROCE) | 13.8% |
| Return on Assets (ROA) | 7.5% |
The company’s financial performance highlights its ability to adapt to changing market conditions and capitalize on export opportunities. Revenue growth, coupled with an EBITDA margin of 16%, underscores Alok Industries’ operational efficiency and cost optimization strategies.
Valuation Metrics
| Metric | Value |
| PE Ratio | 18.20 |
| PEG Ratio | 1.50 |
| Book Value | ₹7.25 |
| Adjusted EPS | ₹1.15 |
The PE ratio of 18.20 is attractive within the textile sector, signaling reasonable valuation. The PEG ratio of 1.50 suggests a good balance between growth potential and valuation.
Key Strengths
| Strength | Explanation |
| Rising Export Demand | Growing international markets for textiles. |
| Operational Efficiency | Enhanced production processes and cost controls. |
| Government Support | Favorable policies boosting textile exports. |
| Diversified Product Portfolio | Broad range of offerings across textiles. |
Risks
| Risk | Explanation |
| Dependency on Exports | Vulnerability to global trade dynamics. |
| Rising Input Costs | Potential pressure on profit margins. |
| Competition | Intense rivalry from domestic and global peers. |
Technical Analysis
Price Movements
| Metric | Value |
| Closing Price | ₹20.88 |
| Day High | ₹21.50 |
| Day Low | ₹19.75 |
| Previous Close | ₹19.31 |
The stock’s close near its intraday high reflects strong bullish sentiment, supported by increased trading activity.
Key Technical Indicators
| Indicator | Value | Interpretation |
| Relative Strength Index (RSI) | 62.00 | Neutral – Approaching overbought levels. |
| Commodity Channel Index (CCI) | 115.00 | Overbought – Indicates strong upward momentum. |
| Money Flow Index (MFI) | 68.00 | Positive – Suggests robust capital inflows. |
| Moving Average Convergence Divergence (MACD) | Positive | Bullish – Signals continued upward momentum. |
| Bollinger Band %B | 0.97 | Near upper band – Potential consolidation. |
| Average Directional Index (ADX) | 29.00 | Strong Trend – Confirms upward movement. |
The indicators highlight a strong bullish trend. However, caution is warranted as the RSI and CCI approach overbought zones, signaling potential short-term pullbacks.
Moving Averages
| Metric | Value | Signal |
| 20-Day Simple Moving Average (SMA) | ₹20.00 | Bullish Crossover – Indicates short-term strength. |
| 50-Day SMA | ₹18.75 | Positive Momentum – Medium-term trend remains positive. |
| 200-Day SMA | ₹17.00 | Long-Term Uptrend – Reflects strong investor confidence. |
The stock’s position above all major moving averages underscores its bullish momentum across short, medium, and long-term timeframes.
Support and Resistance Levels
| Level | Price (₹) |
| Immediate Support | ₹20.00 |
| Strong Support | ₹18.50 |
| Immediate Resistance | ₹21.50 |
| Strong Resistance | ₹23.00 |
A breakout above the immediate resistance of ₹21.50 could signal further upside potential, while the support levels provide a cushion against market corrections.
Trend Analysis
- Volume Trends: Increased trading volumes indicate heightened investor interest.
- Bollinger Bands: Proximity to the upper band suggests potential consolidation or a mild retracement before further gains.
- MACD: Positive crossover supports sustained bullish momentum.
Volatility Indicators
| Metric | Value |
| Average True Range (ATR) | 1.00 |
| Beta | 1.05 |
| Standard Deviation | 0.90 |
The stock’s moderate volatility and slightly higher beta make it appealing to investors seeking steady yet growth-oriented opportunities.
Growth Performance
Historical Trends
| Period | Performance (%) |
| 1 Day | +8.1% |
| 1 Week | +12.0% |
| 1 Month | +15.0% |
| 6 Months | +35.0% |
| 1 Year | +50.0% |
| 2 Years | +85.0% |
| 5 Years | +200.0% |
Alok Industries’ performance over the past five years reflects its ability to deliver consistent returns. The company’s strong long-term growth is supported by robust fundamentals and sectoral tailwinds.
Key Observations
| Aspect | Observation |
| Short-Term Trends | Strong bullish momentum. |
| Long-Term Potential | Supported by export demand and efficiency. |
| Risk Factors | Competition and rising input costs. |
Investment Outlook
Alok Industries Ltd. presents a promising investment opportunity in the textile sector. Its focus on high-margin segments, coupled with operational improvements and favorable government policies, positions it for sustained growth. While the stock’s recent rally highlights strong market sentiment, potential overbought conditions warrant careful monitoring.
In conclusion, Alok Industries’ ability to capitalize on rising export demand and enhance production efficiency reaffirms its growth potential. Investors seeking exposure to the textile sector should consider both the opportunities and risks associated with this stock.
Conclusion
Today’s market action showcased robust gains across diverse sectors, from FMCG and IT to capital goods and textiles. Companies like Hatsun Agro Product Ltd. and Newgen Software Technologies have demonstrated strong fundamentals and strategic growth initiatives, which continue to attract investor interest. These top performers reflect the broader market’s resilience and the potential for growth across sectors, making them stocks to watch in the coming weeks.