
TRENT, a prominent stock listed on the NSE, is showing signs of an interesting price action pattern. The 15-minute chart reveals a potential reversal with key technical indicators pointing towards a possible bullish trend. Understanding the price movements, technical indicators, and trend signals can help traders make informed decisions. This analysis provides a comprehensive breakdown of TRENT’s stock performance, identifying key resistance and support levels, trading strategies, and market trends.
Current Market Structure
TRENT’s latest price action indicates a minor decline of 0.01% with the last traded price at ₹5423.35. The stock hit a high of ₹5430.00 and a low of ₹5423.25 during the observed period. Despite the minor loss, technical indicators suggest that the stock is forming a base for a potential upward movement.
Bollinger Bands Analysis
The Bollinger Bands (BB 20, 2) are a widely used indicator to determine market volatility and potential price breakouts. In TRENT’s case:
- Upper Band: ₹5755.09
- Middle Band (SMA 20): ₹5437.68
- Lower Band: ₹5120.27
Interpretation:
TRENT’s price has touched the lower Bollinger Band and is now showing signs of recovery. A move towards the middle band at ₹5437.68 is likely, as stocks tend to revert to their mean after hitting the lower band. This suggests that the bearish momentum might be fading, making way for a potential bullish reversal.
Relative Strength Index (RSI) Analysis
The Relative Strength Index (RSI) is a crucial momentum indicator used to determine overbought or oversold conditions.
- Current RSI: 44.25
Interpretation:
An RSI value of 44.25 indicates that the stock is below the neutral 50 level but is rising. Typically, an RSI below 30 is considered oversold, while above 70 is considered overbought. The recent rise in RSI from a lower level suggests that buying interest is increasing and a possible bullish breakout could occur if RSI crosses above 50.
MACD (Moving Average Convergence Divergence) Analysis
The MACD indicator is used to identify potential buy and sell signals.
- MACD Line: -81.99
- Signal Line: -98.03
- Histogram: 16.05 (Bullish)
Interpretation:
The MACD line crossing above the signal line is a strong bullish signal. This crossover indicates that the stock is gaining upward momentum. The histogram turning positive further reinforces the bullish outlook, suggesting that the selling pressure is decreasing and buyers are stepping in.
Price Action & Pattern Formation
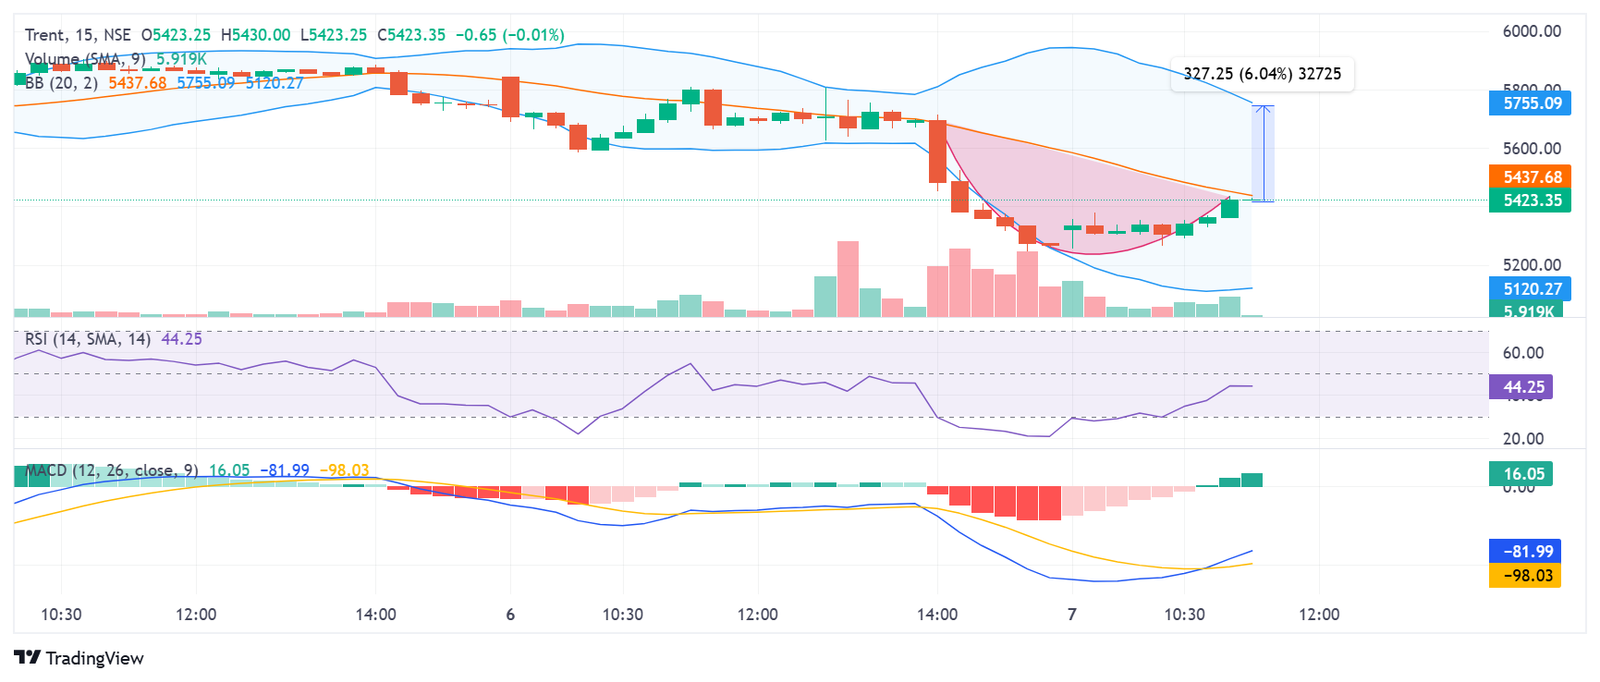
TRENT’s 15-minute chart reveals a rounded bottom formation, a bullish reversal pattern that indicates a shift from a downtrend to an uptrend.
- A rounded bottom typically occurs when a stock declines gradually, consolidates, and then starts to rise again.
- This formation suggests that the stock has found a strong support zone around ₹5120.27 and is preparing for an upward move.
- The key breakout level to watch is around ₹5437.68 (SMA 20).
Volume Analysis
Volume plays a significant role in confirming trends and breakouts. An increase in volume during price recovery is a positive sign.
- The volume has started to pick up as the price moves higher, suggesting increased buying interest.
- If the volume continues to rise along with the price, it would confirm the validity of the breakout above ₹5437.68.
Support & Resistance Levels
Understanding key support and resistance levels helps traders make informed decisions.
Support Levels:
- ₹5120.27 – Lower Bollinger Band support level
- ₹5200 – Psychological round-number support
Resistance Levels:
- ₹5437.68 – Middle Bollinger Band & SMA 20 (Breakout level)
- ₹5550 – Immediate resistance if the stock moves above ₹5437.68
- ₹5755.09 – Upper Bollinger Band (Potential Target)
Short-Term Forecast & Expected Price Movement
Given the current price action and technical indicators, the following scenarios are likely:
- Bullish Breakout:
- If the price sustains above ₹5437.68, a move towards ₹5550–₹5755.09 is possible.
- This would confirm the reversal pattern and attract more buyers.
- RSI moving above 50 would further strengthen the bullish momentum.
- Bearish Retest:
- If the stock fails to hold above ₹5437.68, it may retest the support at ₹5200.
- A breakdown below ₹5200 would invalidate the bullish setup, leading to further downside towards ₹5120.27.
Trading Strategy for TRENT
Bullish Strategy (Breakout Trade)
- Entry Point: Above ₹5437.68 after confirmation of breakout
- Stop Loss: ₹5300 (Below recent swing low)
- Target 1: ₹5550 (Immediate resistance)
- Target 2: ₹5755.09 (Upper Bollinger Band)
- Risk-Reward Ratio: 1:2 or better
Bearish Strategy (Rejection Trade)
- Entry Point: If price gets rejected at ₹5437.68 and starts falling
- Stop Loss: ₹5450 (Above resistance)
- Target 1: ₹5200 (Support level)
- Target 2: ₹5120.27 (Lower Bollinger Band)
- Risk-Reward Ratio: 1:2 or better
Risk Factors & Market Sentiment
While technical indicators suggest a bullish reversal, external factors could influence TRENT’s price movement:
- Market Sentiment:
- If broader market indices like NIFTY 50 or Sensex show weakness, TRENT may struggle to break resistance levels.
- Positive market sentiment could help push the stock higher.
- Earnings & News Impact:
- Upcoming earnings reports or corporate announcements could significantly impact price movements.
- Any negative news related to the company or sector could invalidate the bullish setup.
- Global Market Trends:
- Trends in international markets, especially in retail and FMCG sectors, could affect investor sentiment.
- Rising inflation, interest rate hikes, or geopolitical tensions could cause volatility.
Conclusion
TRENT’s stock is at a crucial juncture where a breakout above ₹5437.68 could lead to a strong upside movement towards ₹5755.09. The RSI, MACD, and Bollinger Bands indicate improving momentum, while volume trends support the recovery. However, failure to sustain above ₹5437.68 could lead to a bearish retest of support levels.
Traders should monitor volume activity, RSI strength, and price action around key resistance and support zones. A breakout trade above ₹5437.68 offers a favorable risk-reward opportunity, while a rejection could provide a short-selling chance targeting ₹5200.
Staying informed about market trends, earnings updates, and macroeconomic factors is essential for making data-driven trading decisions. Whether bullish or bearish, TRENT presents a promising setup for both short-term and swing traders looking to capitalize on its current price action.
ALSO READ: Rupee Falls as RBI Rate Decision Nears