Trident Ltd., a leading player in the textile and agro-based paper manufacturing industries, has demonstrated significant growth over the years. Incorporated in 1990 as Abhishek Industries Limited, the company has evolved into a diversified entity. It stands as one of the largest towel manufacturers in the world, one of India’s top yarn producers, and a major player in sustainable paper manufacturing.
This analysis delves into Trident Ltd.’s market performance, financial standing, technical outlook, growth drivers, challenges, and future potential.
Company Overview
Trident Ltd. is the flagship company of the Trident Group, headquartered in Ludhiana, Punjab, India. The company operates in two primary segments:
- Textiles: Manufacturing towels, yarn, and other textile products.
- Paper: Specializing in agro-based paper manufacturing.
Core Competencies
- Global Presence: Trident is recognized globally for its premium quality textile products, particularly towels and bed linen.
- Sustainability: It is a pioneer in sustainable paper manufacturing, using agricultural residue like wheat straw as raw material.
- Innovation: Continuous investment in R&D enables Trident to remain competitive in global markets.
Key Business Metrics
- Sector: Textile
- Industry: Textile – Spinning
- Market Capitalization: ₹19,604 Cr (Small Cap)
- Enterprise Value: ₹20,496 Cr
- Book Value per Share: ₹8.41
- Price-to-Earnings (P/E) Ratio: 60.82
- Dividend Yield: 0.94%
Historical Perspective
Trident Ltd. began as a modest venture and has grown exponentially over the years. The company initially focused on textiles before diversifying into paper manufacturing. Over the past three decades, it has expanded its production capacities, entered global markets, and adopted innovative technologies to improve efficiency and sustainability.
Milestones
- 1990s: Establishment and initial focus on textiles.
- 2000s: Expansion into agro-based paper manufacturing.
- 2010s: Global recognition for premium towel manufacturing.
- 2020s: Emphasis on sustainability and digital transformation.
Market Performance
Short-Term Performance
- 1-Day Growth: 0.5%
- 1-Week Growth: 12.4%
- 1-Month Growth: 14.3%
The short-term performance indicates positive momentum, with consistent price appreciation over the past month.
Long-Term Performance
- 6-Month Growth: 3.0%
- 1-Year Growth: 4.1%
- 2-Year Growth: 5.3%
- 5-Year Growth: 473.1%
- 10-Year Growth: 1,319.0%
The long-term growth trajectory highlights Trident’s ability to generate substantial returns for investors, particularly over a 5- to 10-year horizon.
Volume Surge
The stock recently witnessed a 46.3x surge in volume and a 14.8x increase in delivery, suggesting heightened investor interest. This surge often precedes major price movements, driven by institutional buying or positive news.
Financial Performance
Revenue Breakdown
- Net Sales: ₹1,712.94 Cr
- Expenditure: ₹1,491.40 Cr
- EBITDA: ₹221.54 Cr
- Net Profit: ₹99.07 Cr
Trident’s financials underscore its operational efficiency, with a solid revenue base and consistent profitability.
Expenditure Analysis
- Depreciation: ₹92.19 Cr
- Interest: ₹46.39 Cr
The company’s expenditure structure reflects its capital-intensive operations, with significant costs allocated to machinery and infrastructure maintenance.
Profit Margins
- EBITDA Margin: 12.9%
- Net Profit Margin: 5.8%
While the margins are moderate, they indicate room for improvement, particularly in reducing operational costs.
Return Ratios
- Return on Equity (ROE): 8.23%
- Return on Capital Employed (ROCE): 10.60%
- Return on Assets (ROA): 4.86%
These ratios suggest that Trident is moderately efficient in utilizing its resources to generate returns for stakeholders.
Growth Patterns
| Metric | 1-Year (%) | 3-Year (%) | 5-Year (%) | 10-Year (%) |
|---|---|---|---|---|
| Price Growth | 3.66 | -11.14 | 41.66 | 30.31 |
| Net Sales | 7.18 | 14.54 | 5.34 | 5.77 |
| EBITDA | -9.40 | 4.33 | -1.14 | 2.25 |
| Net Profit | -29.63 | 2.06 | -1.23 | 6.06 |
While price growth has been robust, profitability metrics like EBITDA and Net Profit have faced challenges, reflecting the need for improved cost management.
Peer Comparison
| Company | P/B Ratio | P/E Ratio | Dividend Yield | LTP (₹) | Market Cap (Cr) |
|---|---|---|---|---|---|
| Trident Ltd. | 4.52 | 60.10 | 0.95% | ₹38.16 | ₹19,604 |
| Filatex India | 2.51 | 26.94 | 0.28% | ₹69.95 | ₹3,117.20 |
| Nitin Spinners | 2.21 | 17.34 | 0.52% | ₹475.60 | ₹2,690.97 |
| Nahar Spinning | 0.67 | 0.00 | 0.36% | ₹280.00 | ₹1,005.86 |
| Ambika Cotton | 1.08 | 14.95 | 2.07% | ₹1,703.60 | ₹967.64 |
Insights
- Valuation: Trident’s P/E ratio is significantly higher than peers, reflecting premium valuation.
- Dividend Yield: At 0.95%, Trident’s dividend yield is competitive but lower than Ambika Cotton’s 2.07%.
- Market Cap: Trident has a substantially larger market cap compared to most peers, underscoring its leadership position.
Technical Analysis
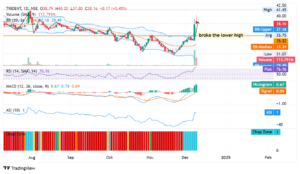
The technical analysis of Trident Ltd. provides insights into the stock’s price behavior, momentum, and potential future movements based on technical indicators. This section elaborates on key technical factors such as Relative Strength Index (RSI), Moving Average Convergence Divergence (MACD), Bollinger Bands, volume trends, and support and resistance levels.

1. Relative Strength Index (RSI)
- Current RSI Level: 76.16
- Significance: RSI measures the speed and change of price movements. Values above 70 indicate that the stock is in the overbought zone, while values below 30 suggest it is oversold.
- Interpretation for Trident:
- The RSI crossing above 70 suggests that the stock has experienced significant upward momentum in recent weeks. This can often indicate that the stock is overbought and might see some short-term profit booking.
- However, in a strong uptrend, RSI can remain in the overbought zone for an extended period, signaling continued bullish momentum. Traders should watch for divergences (when RSI moves opposite to the stock price) as potential reversal signals.
2. Moving Average Convergence Divergence (MACD)
- MACD Line: 0.67
- Signal Line: 0.09
- Histogram: Positive
- Significance: MACD is a trend-following momentum indicator that shows the relationship between two moving averages (typically the 12-day EMA and the 26-day EMA). A positive MACD indicates bullish momentum, while a negative MACD suggests bearish momentum.
- Interpretation for Trident:
- The MACD line is above the signal line, indicating a bullish crossover. This suggests that the stock is experiencing upward momentum.
- The widening gap between the MACD and signal line, along with a positive histogram, reinforces the bullish outlook.
- A continued positive histogram indicates sustained buying pressure, which could push prices higher. However, traders should monitor for any signs of the MACD line crossing below the signal line, as this could signal a reversal.
3. Bollinger Bands
- Upper Band: ₹37.18
- Median Band (20-Day SMA): ₹35.32
- Lower Band: ₹29.49
- Current Price: ₹38.16
- Significance: Bollinger Bands measure volatility and provide potential support and resistance levels. When the price moves near the upper band, it indicates overbought conditions, while movement near the lower band indicates oversold conditions.
- Interpretation for Trident:
- The stock price is trading above the upper Bollinger Band, which is a sign of strong bullish momentum.
- This breakout above the upper band can indicate a continued upward trend. However, stocks trading outside the upper band often revert back to the median (20-day SMA) due to profit booking or consolidation.
- If the price holds above the upper band for multiple trading sessions, it may confirm a strong breakout, signaling further upside potential.
4. Volume Analysis
- Recent Volume Surge: 113.791M (46.3x increase)
- Delivery Volume Surge: 14.8x above 5-day average
- Significance: Volume is a critical indicator of investor interest and the strength of price movements. High volume often accompanies strong price movements, indicating the presence of institutional activity.
- Interpretation for Trident:
- The massive increase in volume suggests significant investor participation, likely driven by positive news or a technical breakout.
- A high delivery percentage (14.8x surge) indicates that a large proportion of shares traded were purchased for long-term holding, reflecting bullish sentiment.
- Sustained high volume in the coming sessions will confirm the strength of the uptrend. Conversely, declining volume during a price rise may signal weakening momentum.
5. Support and Resistance Levels
- Support Levels:
- ₹33.34 (20-day SMA/Bollinger Median): This level serves as a key support point. If the price retraces, this level may act as a cushion.
- ₹29.49 (Lower Bollinger Band): A major support level indicating the lower bound of recent trading activity.
- Resistance Levels:
- ₹37.18 (Upper Bollinger Band): This is the immediate resistance level. A close above this for multiple sessions will confirm the breakout.
- ₹41.45 (Recent High): This is a critical resistance level. Breaking this level with strong volume could propel the stock into uncharted territory.
6. Average Directional Index (ADX)
- Current ADX Level: Above 25
- Significance: ADX measures the strength of a trend. A reading above 25 indicates a strong trend, while a reading below 20 indicates a weak trend.
- Interpretation for Trident:
- The current ADX level suggests a strong upward trend. This aligns with the stock’s breakout above key resistance levels.
- If the ADX continues to rise, it signals increasing trend strength, making it likely for the stock to maintain its upward trajectory.
7. Price Action
- Recent Breakout: The stock has broken past its previous week’s high of ₹35.10 and its previous month’s high of ₹35.47. These breakouts signal strong bullish momentum.
- Higher Highs and Higher Lows: The stock is forming a pattern of higher highs and higher lows, a classic indicator of an uptrend.
- Key Observation: The recent breakout above ₹37.18 suggests that buyers are in control, and the price may continue to climb if supported by strong volume.
8. Additional Indicators
- Accumulation/Distribution Line (A/D Line):
- Rising A/D line indicates strong accumulation, signaling that institutional investors are actively buying the stock.
- Choppiness Index (Chop Zone):
- The Choppiness Index suggests the stock is trending rather than trading sideways. Values closer to 0 indicate a strong trend, aligning with the stock’s recent breakout.
Growth Drivers
Global Demand for Textiles
Rising demand for high-quality textiles in global markets supports Trident’s growth. Its focus on premium products like towels and bed linen positions it well to capture market share.
Sustainability Initiatives
Trident’s agro-based paper manufacturing, using agricultural residue, aligns with global sustainability trends. This gives the company a competitive edge.
Innovation
Continuous investment in R&D ensures that Trident remains at the forefront of industry innovation.
Operational Efficiency
Efforts to streamline operations and reduce costs will likely enhance profitability.
Challenges
Future Outlook
Short-Term Prospects
The recent volume surge and technical breakout suggest strong short-term momentum. However, investors should remain cautious about overbought conditions.
Long-Term Potential
Trident’s focus on sustainability, innovation, and global expansion positions it well for sustained growth. Its leadership in textiles and agro-based paper manufacturing provides a strong foundation.
Conclusion
Trident Ltd. is a compelling investment option for long-term investors seeking exposure to the textile sector. Its strong fundamentals, diversified business model, and leadership position make it a valuable addition to any portfolio. While challenges like high valuation and profitability concerns exist, the company’s long-term growth potential outweighs these risks. Investors should monitor price movements and wait for optimal entry points to maximize returns.
ALSO READ: Mazagon Dock Shipbuilders Ltd.: Buy or Pass?


