
Zomato Limited has become a significant player in the food delivery and dining-out sectors in India. Its diversified business model and strong market presence have caught the attention of investors. This article focuses on the technical aspects of Zomato‘s stock performance, evaluating whether it is a potential buy based on technical indicators and trading strategies.
Technical Analysis Overview
Technical analysis involves evaluating securities by analyzing statistics generated by market activity, such as past prices and volume. It is used to identify patterns and trends that can suggest future movements. For Zomato, several technical indicators and patterns are worth noting:
1. Relative Strength Index (RSI)
2. Moving Averages
3. Volume and Delivery
4. Support and Resistance Levels
5. Candlestick Patterns
1. Relative Strength Index (RSI)
The Relative Strength Index (RSI) is a momentum oscillator that measures the speed and change of price movements. It oscillates between 0 and 100. Traditionally, RSI values above 70 indicate that a stock is overbought, while values below 30 suggest it is oversold.
– Current RSI Status: Zomato’s RSI has crossed above 70, entering the overbought zone. This can indicate that the stock may be due for a price pullback or consolidation in the near term. An overbought condition suggests that the stock has been in a strong upward trend but might be overextended.
2. Moving Averages
Moving averages smooth out price data to create a trend-following indicator. They help to identify the direction of the trend and potential support and resistance levels.
– Simple Moving Average (SMA): Zomato’s stock price is significantly above its 50-day and 200-day moving averages. This indicates a strong upward trend. The crossover of the shorter-term SMA above the longer-term SMA is a bullish signal.
– Exponential Moving Average (EMA): The EMA, which gives more weight to recent prices, also shows a bullish trend. The 20-day EMA crossing above the 50-day EMA is another positive signal.
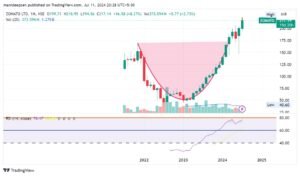
3. Volume and Delivery
Volume is a crucial indicator in technical analysis, reflecting the number of shares traded during a specific period. Delivery percentage indicates the number of shares that were actually taken into delivery out of the total traded quantity.
– Recent Volume Trends: Zomato’s stock has seen a surge in volume, with trading volume and delivery increasing by 1.6 times and 1.7 times, respectively, compared to their 5-day average. This high volume, coupled with a 2.73% price increase, suggests strong investor interest and the potential for continued upward movement.
– Volume Analysis: A rising price accompanied by increasing volume is a bullish signal, indicating that more investors are willing to buy the stock at higher prices.
4. Support and Resistance Levels
Support and resistance levels are critical in technical analysis as they indicate the price points where the stock tends to find buying and selling pressure, respectively.
– Current Levels: Zomato recently closed at Rs. 217.14, surpassing both its previous all-time high of Rs. 214.00 and its 52-week high. This indicates that the stock has broken through significant resistance levels, which now serve as new support levels.
– Future Levels: Given the stock’s upward trajectory, the next resistance level could be projected based on Fibonacci extensions or historical price patterns. Conversely, support levels are critical for identifying potential entry points if the stock experiences a pullback.
5. Candlestick Patterns
Candlestick patterns can provide insights into market sentiment and potential price reversals.
– Bullish Patterns: Recent bullish candlestick patterns, such as the hammer and bullish engulfing patterns, suggest strong buying interest at lower levels, supporting the upward trend.
– Bearish Patterns: Investors should also be aware of bearish patterns like the shooting star or bearish engulfing patterns, which could indicate potential reversals or pullbacks.
Advanced Technical Indicators
In addition to the basic indicators, several advanced technical tools can offer deeper insights:
– MACD (Moving Average Convergence Divergence): The MACD is a trend-following momentum indicator that shows the relationship between two moving averages of a stock’s price. For Zomato, the MACD line crossing above the signal line is a bullish indicator, suggesting upward momentum.
– Bollinger Bands: These are volatility bands placed above and below a moving average. Zomato’s stock price touching the upper Bollinger Band indicates that the stock is potentially overbought and may face resistance.
– Stochastic Oscillator: This momentum indicator compares a particular closing price of a security to a range of its prices over a certain period. Zomato’s stochastic oscillator crossing above 80 suggests an overbought condition.
Trading Strategies
Based on the technical analysis, several trading strategies can be considered:
– Momentum Trading: Given the strong upward momentum and bullish signals from the RSI, moving averages, and volume, momentum traders might consider buying Zomato’s stock, aiming to capitalize on continued upward movement.
– Swing Trading: Swing traders can look for buying opportunities on dips or near support levels, with the expectation that the stock will continue to swing upward within its established trend.
– Contrarian Strategy: For those wary of the overbought RSI, a contrarian strategy might involve waiting for a pullback to more favorable levels before buying. This approach aims to capitalize on temporary corrections in the overall bullish trend.
Risk Management
Effective risk management is crucial when trading, especially with a stock that shows strong momentum but also potential overbought conditions:
– Stop-Loss Orders: Placing stop-loss orders below recent support levels can help protect against significant losses if the stock reverses.
– Position Sizing: Adjusting the size of positions based on risk tolerance and the volatility of the stock can help manage overall portfolio risk.
– Regular Monitoring: Keeping a close eye on technical indicators and market conditions can help traders make informed decisions and adjust their strategies as needed.
Conclusion
Zomato Limited’s stock exhibits strong upward momentum supported by several bullish technical indicators, including RSI, moving averages, volume trends, and key support and resistance levels. The stock’s recent performance, surpassing both its all-time and 52-week highs, underscores its strong investor interest and potential for continued gains.
However, the overbought RSI suggests that a near-term pullback or consolidation is possible. Investors and traders should consider their risk tolerance and investment horizon when deciding whether to buy Zomato’s stock. Short-term traders may find attractive opportunities to capitalize on the stock’s momentum, while long-term investors might prefer waiting for a more favorable entry point.
As with any investment, conducting thorough research and implementing effective risk management strategies are essential to making informed decisions. Zomato’s stock presents a compelling case for potential gains, but it also requires careful consideration of the associated risks and market conditions.
ALSO READ: Bharat Petroleum Technical Analysis: July 11, 2024