
The Nifty India Defence Index has shown a strong upward move after several weeks of price consolidation. The daily chart now reflects a positive technical structure, with price action moving above key resistance levels while momentum indicators also support further upside. Current data suggests that the broader trend remains healthy, although traders should watch important support zones in the coming sessions.
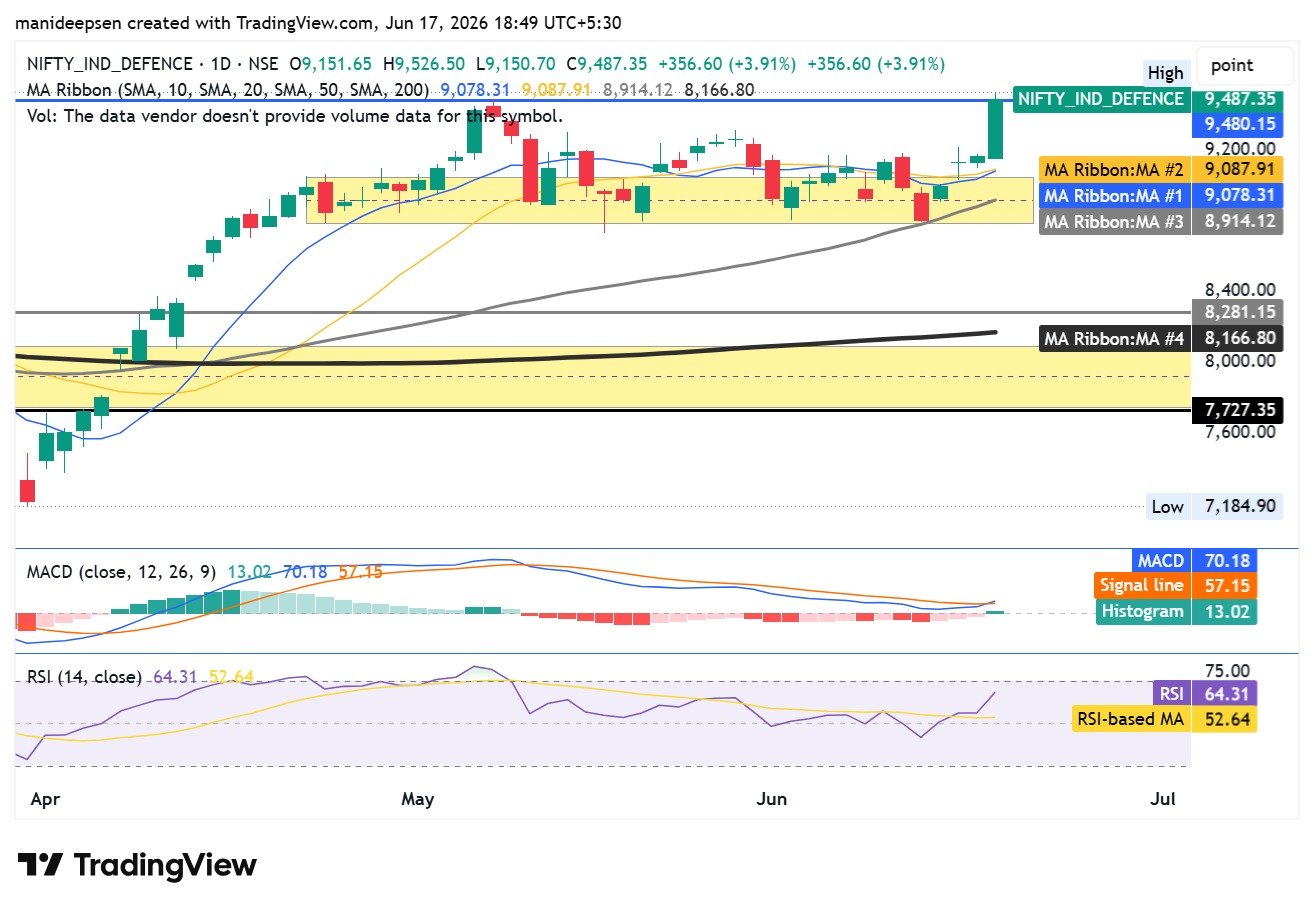
At the time of analysis, the index closed at 9,487.35, recording a gain of 356.60 points or 3.91 percent. This sharp move came after the index spent multiple weeks moving inside a narrow range, which often signals a pause before the next directional move.
Price Structure Indicates Continuation of Uptrend
From early April to the first half of May, the index moved sharply upward from levels near 7,600 and reached around 9,400. Such a fast price rise usually reflects strong demand and sector-wide optimism. This phase established the main bullish trend.
After this sharp rise, the market entered a period of consolidation. For several weeks, price stayed between 9,070 and 9,450. During this period, the index failed to move lower despite repeated selling pressure near the upper range. This behavior usually suggests that sellers are losing strength while buyers continue to absorb supply.
The latest session shows a strong breakout above this consolidation zone. Price closed near the highest point of the day, which usually reflects confidence from market participants.
Breakout Above Resistance Changes Short-Term Outlook
The level near 9,400 to 9,450 acted as an important resistance area during the past few weeks. The latest candle closed clearly above this zone at 9,487.35, which now changes the short-term structure.
A breakout above a well-defined range often suggests that the market has accepted higher prices. This may lead to continuation toward higher levels if the breakout holds during the next few sessions.
The current move does not show signs of exhaustion. Candle structure remains healthy and there is no major rejection near the day’s high.
Moving Average Structure Remains Very Strong
The moving averages on the chart show a healthy bullish structure.
The 10-day simple moving average stands at 9,078.31, while the 20-day moving average is placed at 9,087.91. The 50-day moving average is near 8,914.12, and the 200-day moving average remains at 8,166.80.
Current price trades well above all these levels.
This structure is important because it confirms trend strength across short-term, medium-term, and long-term timeframes.
In technical analysis, when price remains above all major moving averages, it usually signals trend stability rather than weakness.
Support Zones Remain Clearly Defined
The first important support now sits near 9,400 to 9,450. Since price has moved above this resistance zone, it may now act as immediate support.
The second major support area lies between 9,070 and 9,100. This zone becomes important because both the 10-day and 20-day moving averages are placed here.
A deeper correction below this region may weaken short-term momentum.
The long-term support area remains near 8,166 to 8,280, close to the 200-day moving average.
As long as price remains above these levels, the larger bullish structure stays intact.
MACD Confirms Momentum Improvement
The MACD indicator currently shows positive momentum.
The MACD value stands at 70.18, while the signal line is at 57.15. The histogram value currently reads 13.02.
This setup is important because the MACD line remains above the signal line, which generally confirms bullish momentum.
The histogram has also started to expand again after a recent slowdown.
This often signals that a fresh upward phase may begin after a period of consolidation.
RSI Shows Strength Without Overheating
The Relative Strength Index also supports the bullish view.
The RSI currently stands at 64.31, while the RSI moving average remains at 52.64.
An RSI value above 50 usually suggests buyers hold control of the market. The recent upward move in RSI confirms improving strength.
At the same time, RSI remains below the common overbought zone near 70.
This is important because it shows momentum remains strong while still leaving room for additional upside.
Visual Trend Snapshot
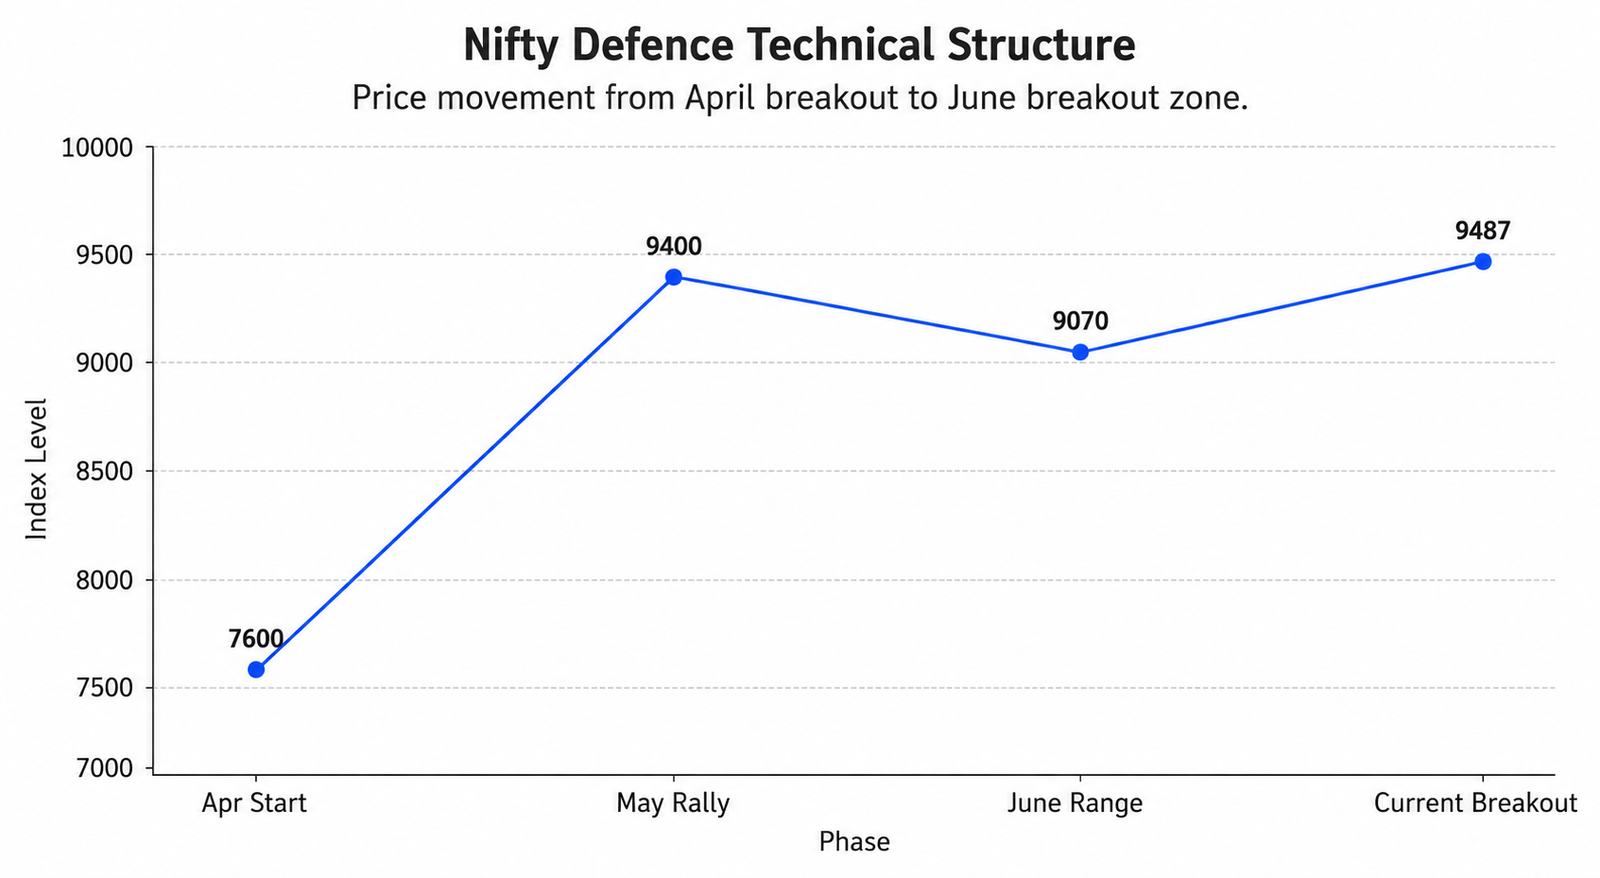
The chart above shows how the index moved sharply higher, entered a consolidation phase, and then broke above resistance during the latest session.
Near-Term Price Outlook Remains Positive
Current market structure supports a bullish outlook over the short to medium term.
If price remains above 9,400, the index may continue moving toward the next resistance area near 9,650.
If momentum stays strong, the next projected zone may appear near 9,800 to 10,050 over the coming weeks.
A temporary pullback toward 9,300 or 9,400 cannot be ruled out, but such movement may remain healthy if buyers return near support.
Risk Factors Investors Should Monitor
The bullish outlook weakens if price closes below 9,070, since this area represents the consolidation base along with short-term moving average support.
A deeper move below 8,900 may create a more serious shift in market sentiment because that would place price below the 50-day moving average.
One limitation in the current analysis is the absence of volume data. Since volume information is unavailable, participation from institutional buyers cannot be fully confirmed.
Without volume confirmation, breakout strength should still be monitored over the next few trading sessions.
Final Technical View
The Nifty India Defence Index currently shows one of the strongest technical structures visible on the daily chart.
Price has moved above an important resistance zone after spending weeks inside consolidation. Moving averages remain perfectly aligned, MACD supports momentum expansion, and RSI confirms buying strength without reaching overheated levels.
Based on available data, the probability currently favors continuation of the bullish trend rather than reversal.
As long as price remains above 9,400, the technical outlook remains positive.
Frequently Asked Questions
1. Why is the latest breakout important?
The breakout above 9,400 resistance shows that buyers have gained control after weeks of sideways movement.
2. What does MACD indicate right now?
MACD remains positive with a value of 70.18, which suggests momentum has improved.
3. Is the index overbought at current levels?
No. RSI stands at 64.31, which remains below the usual overbought zone near 70.
4. Which level is the most important support now?
The immediate support zone sits near 9,400, while stronger support remains near 9,070.
5. What is the near-term upside target?
If momentum continues, price may move toward 9,650 first, followed by 9,800 to 10,050.
ALSO READ: Top Stocks Rise Before Market Open – Market Insiders