
CROMPTON has started to show signs of recovery after a sharp fall from recent highs. The stock recently closed at ₹275.90, with a strong 4.23% gain in a single session. This move came after buyers stepped in near an important support zone around ₹253–257, which now becomes the most important level for the stock in the near term.
At present, the chart shows early positive signals. However, the broader trend has not fully changed yet. The stock remains below a major long-term resistance area, which means caution still remains important.
Price Trend Shows Early Recovery
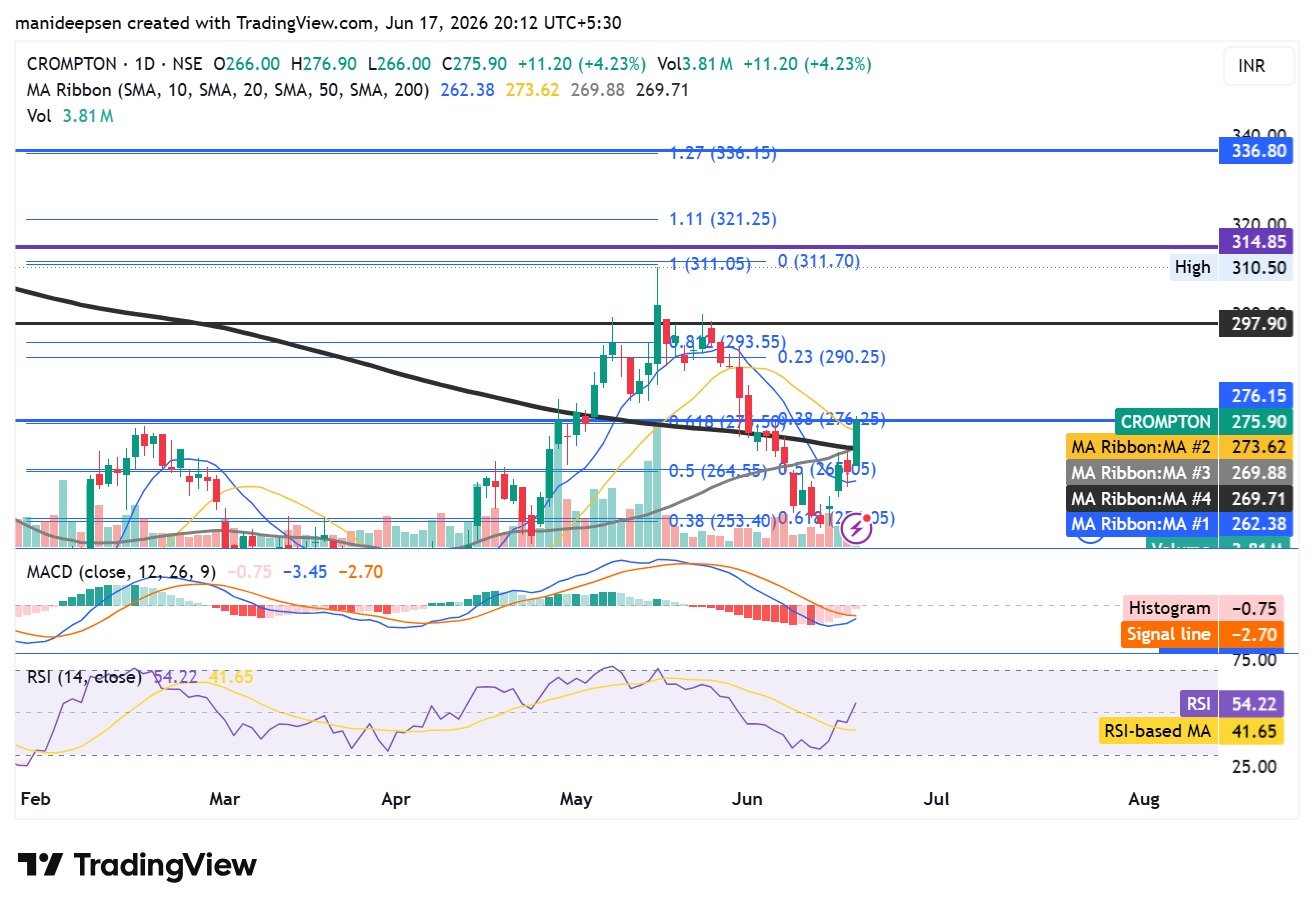
The stock moved sharply lower after it failed near the ₹310–315 zone. After this correction, price found support around ₹253, where buyers entered again. Since then, the stock has started a bounce and has now returned near ₹276.
This type of movement usually shows that selling pressure has reduced. Buyers have started to regain confidence after defending an important demand area.
The latest candle on the chart looks constructive because price closed near the upper part of the day’s range. This often reflects stronger buying interest during the session.
At this stage, the stock has entered a short-term recovery phase. It has not yet confirmed a full trend reversal.
Long-Term Trend Still Remains Weak
The most important long-term indicator on the chart remains the 200-day moving average, which currently stands near ₹297.90.
The stock trades below this level. In technical analysis, price below the 200-day average usually means the broader trend stays weak.
This suggests that long-term investors may still wait before treating the stock as fully bullish.
A sustained move above this zone may improve confidence among larger market participants.
Until that happens, the long-term structure remains under pressure despite recent improvement.
Medium-Term Structure Starts To Improve
The medium-term setup has started to look better.
The stock currently trades above several short-term moving averages:
10-day MA = ₹262.38
20-day MA = ₹273.62
50-day MA = ₹269.88
Price now stays above all three averages, which often shows improving momentum.
When a stock starts trading above short-term averages after a correction, it usually means buyers have regained short-term control.
The moving average ribbon on the chart has started to compress. This often happens before a larger directional move.
The coming sessions will decide whether this recovery becomes stronger or loses momentum.
Volume Shows Strong Market Participation
One of the strongest positive signals on the chart comes from volume.
The latest session recorded 3.81 million shares traded, which stands above recent average participation.
Higher volume during upward price movement often reflects stronger conviction from buyers.
When a stock rises with weak volume, the move may fail quickly. In this case, volume support makes the current bounce more credible.
If volume remains elevated for the next few sessions, confidence in the recovery may improve further.
If volume drops sharply, this move may turn into a temporary bounce.
Fibonacci Levels Highlight Key Zones
The Fibonacci retracement levels on the chart help identify support and resistance areas.
The important levels remain:
0.618 level near ₹257
0.5 level near ₹264
0.382 level near ₹276
0.236 level near ₹290
The stock has now moved above the 0.382 retracement zone near ₹276, which is a positive sign.
This area now becomes an important short-term breakout zone.
The next major challenge sits near ₹290–293.
If price manages to move above that zone, further upside may become possible.
Momentum Indicators Show Positive Change
The MACD indicator currently shows improving momentum.
The histogram remains negative at -0.75, but negative momentum has started to reduce.
The signal line stands near -2.70, while the MACD line has started turning upward.
This usually means bearish pressure has weakened.
Although bullish confirmation has not fully arrived, momentum indicators now show improvement compared to previous sessions.
This often becomes an early sign before stronger upward movement.
RSI Shows Buyer Strength Returns
The Relative Strength Index (RSI) now stands at 54.22.
The RSI-based moving average stands at 41.65.
An RSI reading above 50 generally reflects improving buyer strength.
The recent rise from lower RSI levels suggests that market sentiment has improved.
Higher RSI values usually show stronger momentum.
For a stronger bullish setup, traders often prefer RSI levels moving above 60.
At present, the indicator supports short-term recovery.
Important Price Levels For Market Direction
Support levels now remain extremely important.
The first immediate support sits near ₹273, followed by ₹269.
Below that, ₹264, ₹257, and ₹253 become stronger demand zones.
On the upside, the first resistance remains near ₹276, which price currently tests.
Above that, the next resistance sits around ₹290–293.
The strongest long-term resistance remains near ₹297–298, where the 200-day moving average currently sits.
Beyond that, the earlier supply zone near ₹311–315 becomes important.
The larger upside zone remains near ₹336.
Institutional Participation Looks Limited But Positive
The chart suggests some selective buying has started near lower levels.
The strong bounce from the ₹253–257 demand zone, supported by higher volume and improving momentum indicators, suggests buyers have started showing interest.
However, price still trades below the long-term trend level near ₹297.
Because of this, it remains too early to classify this move as strong institutional accumulation.
At present, the chart shows improving sentiment rather than aggressive long-term buying.
More confirmation remains necessary.
Probable Market Scenarios Ahead
If price manages a strong close above ₹276–278, the stock may attempt a move toward ₹290, followed by ₹298 and possibly ₹311.
If price remains trapped below resistance, the stock may move sideways between ₹262 and ₹285 for some time.
If price falls below ₹257, weakness may return and downside pressure could increase toward ₹245 or lower.
At present, the highest probability favors a short-term recovery continuation.
Technical Snapshot
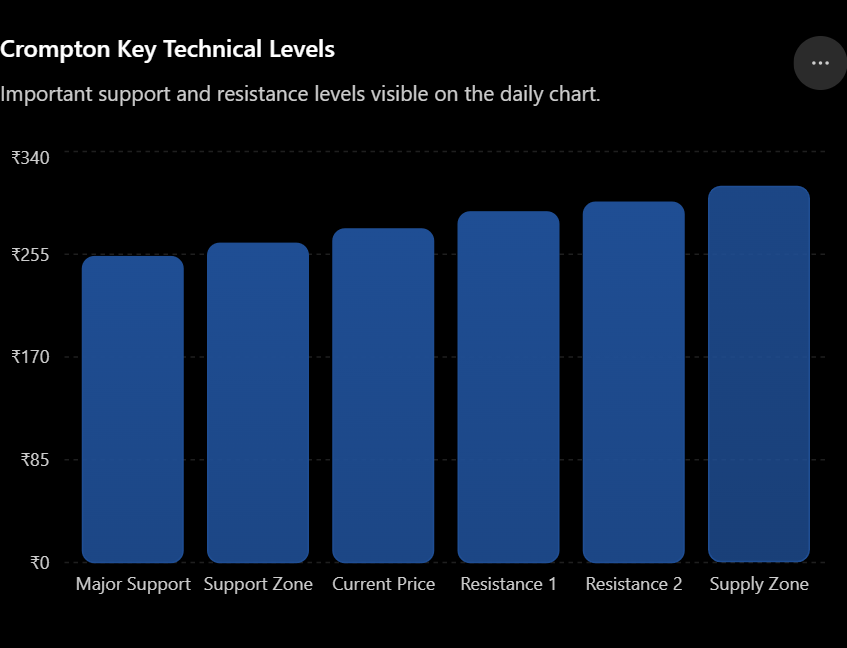
Important support and resistance levels visible on the daily chart.
₹0₹85₹170₹255₹340Major SupportSupport ZoneCurrent PriceResistance 1Resistance 2Supply Zone
Final View
Crompton currently shows encouraging short-term recovery signals after a sharp correction. Price has recovered from a technically important support area, volume has improved, momentum indicators look stronger, and short-term averages now support price action.
Despite these positive developments, the stock remains below the 200-day moving average near ₹297, which means the long-term trend has not changed yet.
The coming sessions near ₹276–290 will likely decide whether this recovery becomes a sustained upward move or turns into temporary consolidation.
From a technical perspective, the stock has improved, but full bullish confirmation still remains absent.
FAQs
Is Crompton stock bullish right now?
The stock shows short-term bullish recovery, but the long-term trend remains uncertain because price stays below the 200-day moving average.
What is the strongest support level for Crompton?
The strongest support zone currently sits between ₹253 and ₹257, where buyers recently entered the stock.
What resistance should traders watch?
The immediate resistance sits near ₹276, followed by a stronger zone near ₹290–293.
Does volume support the recent price rise?
Yes. The latest session showed 3.81 million shares traded, which indicates stronger buyer participation.
Can Crompton move toward previous highs again?
A move toward earlier highs near ₹311–315 becomes possible only if price first crosses ₹290 and then sustains above ₹298.