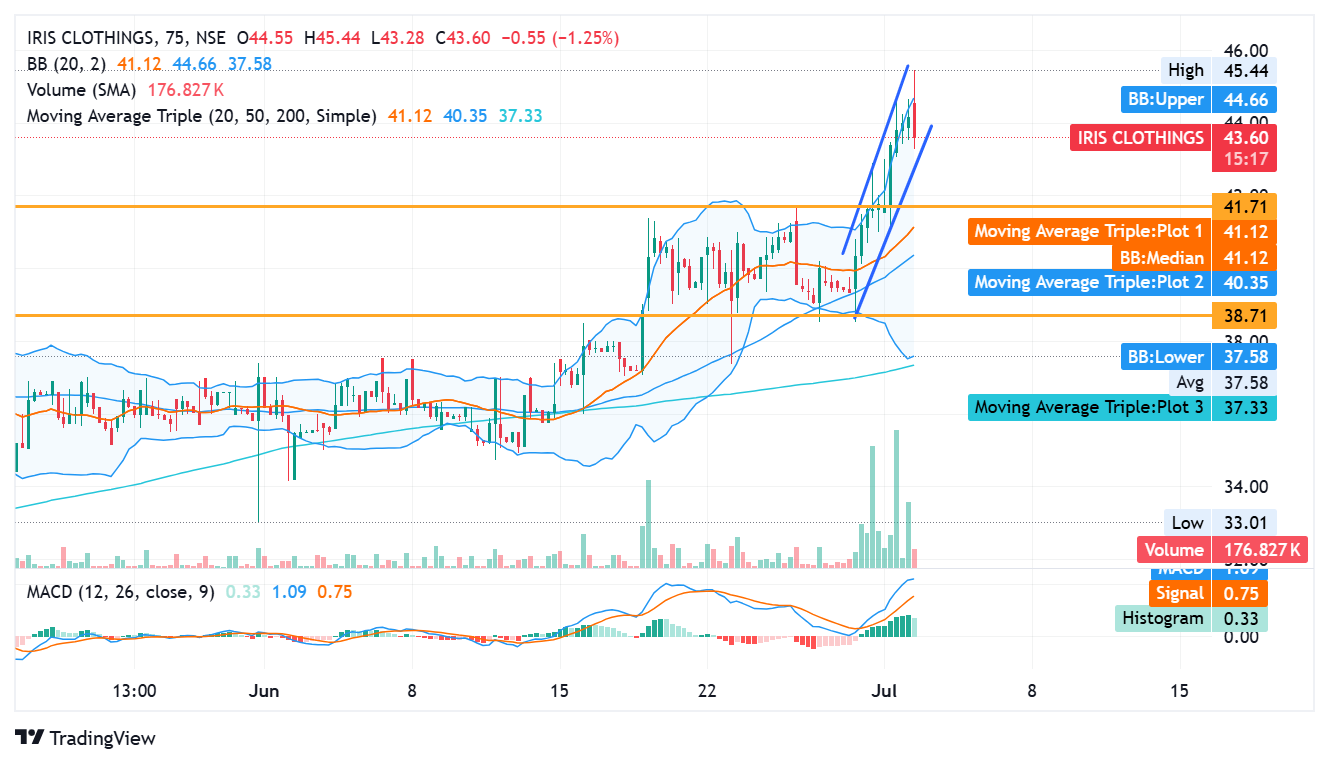
The chart structure currently reflects a strong bullish setup.
Price has moved upward inside a clear rising channel over the last several sessions. The stock formed higher highs and higher lows, which usually confirms strong buyer control.
The recent move pushed price toward the upper range of this rising structure.
A stock that continues to respect an upward channel often remains in bullish territory unless a clear breakdown takes place.
At present, the chart does not show any major structural weakness.
Moving Average Analysis
Moving averages help measure trend direction.
The stock currently trades above all major moving averages.
| Moving Average |
Value |
| 20 Day Average |
41.11 |
| 50 Day Average |
40.35 |
| 200 Day Average |
37.33 |
The shorter moving average remains above the medium-term average, while the medium-term average stays above the long-term average.
This formation usually confirms trend strength.
The gap between these averages also shows that price strength has improved steadily over time.
As long as price stays above these important averages, the broader trend remains positive.
Bollinger Band Study
Bollinger Bands help identify whether price has moved too far in a short period.
Current Bollinger Band values stand at the following levels.
| Bollinger Band |
Value |
| Upper Band |
44.64 |
| Median Band |
41.11 |
| Lower Band |
37.59 |
The stock recently moved close to the upper band after a strong rally.
When price reaches the upper band after a fast move, it often suggests temporary overheating.
This does not automatically signal weakness.
Instead, it often shows that price may pause for some time before the next move begins.
A short consolidation phase may therefore appear near current levels.
MACD Momentum Analysis
MACD remains one of the strongest indicators for momentum analysis.
Current values stand at the following levels.
| Indicator |
Value |
| MACD |
1.08 |
| Signal |
0.75 |
| Histogram |
0.33 |
The MACD line remains above the signal line.
The positive histogram confirms that bullish momentum remains active.
This setup usually means buyers still hold market control.
At present, no clear reversal pattern appears through this indicator.
Momentum therefore remains favorable.
ALSO READ: This ₹48 Cr Deal Changes GK Energy’s Future
Volume Analysis
Volume often confirms whether a price move carries real strength.
Trade data shows the following.
| Metric |
Value |
| Traded Volume |
1.95 Lakhs |
| Traded Value |
₹0.86 Crore |
| Deliverable Quantity Ratio |
66.17% |
Recent sessions witnessed large volume expansion during price breakout.
This matters because strong volume often confirms genuine buying activity rather than temporary speculation.
A deliverable quantity ratio above 66% may indicate stronger investor participation instead of only short-term trading activity.
However, the latest session showed some selling pressure after price reached the day’s high.
This suggests some market participants booked profit near resistance levels.
Important Price Levels
The stock now trades near an important decision zone.
| Level Type |
Price |
| Immediate Resistance |
₹45.44 |
| Near Support |
₹41.71 |
| Strong Support |
₹38.71 |
| Major Trend Support |
₹37.33 |
The resistance zone near ₹45.44 now remains important because this level represents the latest yearly high.
A clear move above this zone may open the possibility of another upward move.
The support zone near ₹41.71 remains the first important area where buyers may return.
The deeper support zone near ₹38.71 may act as a stronger defensive area.
Valuation Perspective
The company currently trades at a relatively expensive valuation.
The stock has a Price to Earnings ratio of 52.11.
A higher P/E ratio often means investors already expect strong future growth.
However, higher valuation also creates risk because the stock may react sharply if future earnings fail to meet expectations.
The company remains a small-cap stock, which means price volatility can stay elevated.
Current volatility numbers support this view.
| Volatility Type |
Value |
| Daily Volatility |
2.49 |
| Annualised Volatility |
47.57 |
Such numbers show that price fluctuations may remain significant.
Broader Business Outlook
The recent newborn gift set launch carries strategic importance.
The infant wear segment usually attracts repeat demand because newborn care products remain essential household purchases.
This category may also allow stronger pricing power because customers often focus on quality and brand trust while purchasing infant products.
The company now moves beyond basic children’s apparel and slowly builds a wider brand presence.
If this expansion leads to stronger revenue growth over coming quarters, market confidence may improve further.
The strategy also suggests management has begun focusing on product diversification rather than dependence on a limited product category.
Risk Factors
Despite positive momentum, some risks remain visible.
The stock already trades near yearly high levels.
After a fast upward move, short-term correction remains possible.
Higher valuation creates pressure because future earnings now carry greater importance.
The company also belongs to the small-cap segment, where liquidity remains lower compared with larger companies.
Any weaker quarterly performance may cause sudden market reaction.
Investors therefore need caution while evaluating short-term price movement.
Overall Market Assessment
Iris Clothings currently stands at an interesting position where business expansion and stock momentum support each other.
The launch of the new infant wear product line created a positive market response.
Technical indicators remain favorable.
Price trades above all important moving averages.
MACD confirms positive momentum.
Volume expansion supports breakout strength.
At the same time, the stock now trades near resistance after a sharp rally, which creates short-term caution.
The company valuation remains expensive at a P/E ratio above 52, which means future growth expectations have already entered the price to some extent.
Overall, the present structure suggests optimism remains strong, but price may require consolidation before the next major move begins.
For market participants, Iris Clothings now represents a stock where growth expectations remain high, momentum stays positive, and future execution by management will determine whether current valuation levels remain justified.
The next few trading sessions near ₹45.44 resistance may therefore become an important signal for future direction.
At present, the broader picture remains constructive, though short-term caution remains necessary after the recent rapid rise.