
Tata Steel recently reported a very strong financial performance for FY26. At first look, the numbers look impressive. Revenue moved higher, profit rose sharply, margins improved, and shareholders received a higher dividend.
Yet the stock price does not reflect the same confidence. Over the last few weeks, the share price has moved lower and the technical chart remains under pressure.
This creates an interesting situation where the company’s business performance looks strong while market behavior remains cautious. To understand what this means, it helps to study both the financial numbers and the technical chart together.
FY26 Financial Performance Shows Major Improvement
The company reported strong growth across almost every major business metric.
| Metric | FY2025 | FY2026 |
|---|---|---|
| Deliveries | 30.96 million tons | 31.97 million tons |
| Revenue | ₹2,18,543 crore | ₹2,32,140 crore |
| EBITDA | ₹25,802 crore | ₹34,848 crore |
| Profit After Tax | ₹3,174 crore | ₹10,886 crore |
| Diluted EPS | ₹2.7 | ₹8.7 |
| Dividend Per Share | ₹3.6 | ₹4.0 |
The biggest surprise came from profit after tax. Net profit rose from ₹3,174 crore to ₹10,886 crore. This means profit increased by more than three times within one financial year.
Revenue growth stood at around 6%, which looks healthy, but profit growth came much faster. This suggests the company controlled expenses very well and improved efficiency across operations.
EBITDA also moved sharply higher from ₹25,802 crore to ₹34,848 crore. EBITDA often gives a clearer picture of core business strength because it focuses on operating performance before interest and tax costs.
This result shows Tata Steel managed to improve profitability much faster than revenue growth.
Cost Savings Played A Major Role
Management highlighted cost savings as one of the biggest reasons behind this profit jump.
In large steel companies, cost control has a huge impact because steel production depends heavily on raw materials, transportation costs, energy prices, and plant efficiency.
A company can sometimes increase profit sharply even when revenue growth remains moderate if production costs fall.
This appears to be exactly what happened here.
The improvement in margins supports this view.
In FY25, EBITDA margin stayed close to 11.8%.
In FY26, EBITDA margin moved near 15%.
This jump in margin shows the business became far more efficient.
For a steel company, this is an important positive signal.
Dividend Increase Shows Financial Confidence
The board increased dividend from ₹3.6 per share to ₹4 per share.
The increase is not very large, but dividend decisions usually reflect management confidence.
When a company decides to pay more cash to shareholders, it often signals that management feels comfortable about future cash generation.
This suggests the company balance sheet remains healthy.
Long Term Stock Performance Remains Positive
Even after recent weakness, Tata Steel stock performance over longer periods remains respectable.
| Period | Stock Return |
|---|---|
| 1 Week | -1.06% |
| 1 Month | -11.34% |
| Year To Date | 2.65% |
| 1 Year | 12.56% |
| 3 Years | 66.71% |
| 5 Years | 64.36% |
The recent one month decline stands out.
The stock has fallen more than 11% even after the company released strong business numbers.
Normally strong earnings support share price. Here the opposite has happened.
This usually means the market sees risks ahead.
Valuation Is Not Cheap
Current market valuation shows investors already expect strong performance.
| Metric | Value |
|---|---|
| Market Cap | ₹2,33,079 crore |
| P/E Ratio | 21.98 |
| Adjusted P/E | 20.63 |
Steel remains a cyclical sector.
This means company earnings can move sharply depending on steel demand, global supply conditions, and commodity prices.
A P/E near 22 is not considered cheap for a cyclical business.
This may explain why the market has not reacted strongly despite excellent results.
Some investors may believe future earnings growth could slow later.
ALSO READ:Why Iris Clothings Stock Suddenly Hit 52 Week High
Technical Chart Shows Clear Weakness
The technical chart paints a very different picture compared to the financial report.
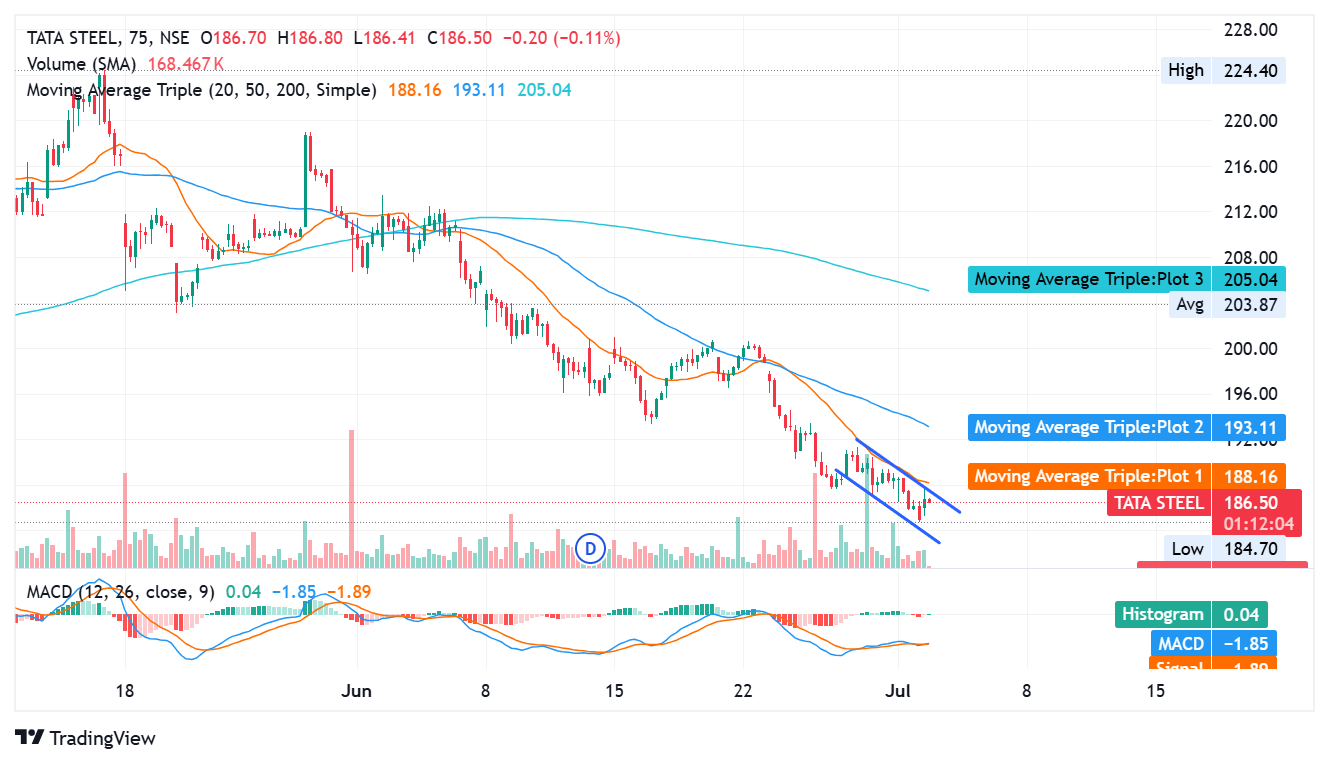
The stock currently trades near ₹186.50.
Over recent weeks the chart has formed a pattern of lower highs and lower lows.
This means every price recovery has failed and sellers continue to push price lower.
The trend looks clearly bearish in the short term.
Price earlier stayed above ₹220.
It has gradually moved lower toward ₹186.
This steady decline shows weakness in market sentiment.
Moving Averages Confirm The Downtrend
The chart shows three major moving averages.
| Moving Average | Level |
|---|---|
| 20 SMA | ₹188.16 |
| 50 SMA | ₹193.11 |
| 200 SMA | ₹205.04 |
Current price remains at ₹186.50.
The stock trades below all three moving averages.
This is an important technical signal.
Normally traders watch these averages to understand trend direction.
When price stays above these averages, trend usually remains healthy.
Here the opposite has happened.
Price has fallen below every important average.
This suggests weakness across short term, medium term, and long term market structure.
Moving Average Structure Looks Bearish
The order of moving averages matters.
Current structure looks like this.
| Level | Value |
|---|---|
| 200 SMA | ₹205.04 |
| 50 SMA | ₹193.11 |
| 20 SMA | ₹188.16 |
| Current Price | ₹186.50 |
This structure often reflects a bearish market.
The long term average sits highest.
The medium average stays below it.
The short term average sits lower.
Price remains below all of them.
This usually tells traders that sellers control market direction.
No sign of trend reversal appears yet.
Price Trades Inside A Falling Channel
The chart also shows a descending channel.
A descending channel forms when price moves lower inside two parallel downward sloping lines.
This pattern often suggests controlled selling pressure.
It does not look like panic selling.
Instead, price gradually moves lower step by step.
This usually means institutions may continue reducing positions slowly over time.
As long as price remains inside this channel, the downtrend remains active.
A strong breakout above this channel would be the first sign of change.
At this stage, that breakout has not happened.
ALSO READ: This Engineering Stock Secures Canada Order Worth ₹64 Lakh
Important Support Zone Sits Near ₹184.70
The chart shows immediate support around ₹184.70.
This level matters because price has approached this zone multiple times.
If price holds here, a short bounce may happen.
If price falls below this level, weakness could continue.
The next important price areas may appear around ₹182, ₹178, and ₹175.
A breakdown below support would strengthen bearish sentiment further.
Resistance Levels Remain Close Above Price
Three resistance zones stand directly above the current price.
| Resistance Level | Reason |
|---|---|
| ₹188 | 20 SMA |
| ₹193 | 50 SMA |
| ₹205 | 200 SMA |
Even if price starts moving upward, sellers may appear at these levels.
For trend recovery, the stock must cross these levels successfully.
Until that happens, recovery remains uncertain.
MACD Shows Selling Pressure Has Slowed
The MACD indicator helps measure momentum.
Current values show:
| Indicator | Value |
|---|---|
| MACD | -1.85 |
| Signal | -1.89 |
| Histogram | 0.04 |
MACD remains below zero.
This usually means bearish momentum still exists.
However, histogram recently turned slightly positive.
This suggests selling pressure has reduced a little.
It does not confirm reversal.
It simply means price decline has become slower for now.
The broader trend remains weak.
ALSO READ: India Bond Yield Falls as Market Sees Easier Money Ahead
Volume Data Does Not Show Strong Buyer Interest
Volume helps show participation.
During previous price declines, volume bars increased sharply.
This tells us sellers acted aggressively during earlier downward moves.
Recent candles show lower volume.
This means market activity has cooled.
More importantly, no strong buying volume appears near current price levels.
If institutions were building fresh positions, higher buying volume would usually appear.
That pattern is missing for now.
This suggests accumulation remains limited.
Why Strong Results Did Not Push Stock Higher
This becomes the most interesting question.
The company reported excellent earnings.
Yet the stock remains weak.
There are several possible reasons.
Steel remains highly cyclical.
Global demand concerns can affect future expectations.
Chinese steel exports often create pricing pressure in global markets.
Commodity prices can shift quickly.
The market may believe current profit growth cannot continue at the same pace.
Sometimes investors sell after good results if strong earnings were already expected.
This situation may reflect that kind of market behavior.
Good company performance does not always create immediate stock price gains.
The Big Picture
When business performance and stock price move in opposite directions, investors must study both carefully.
Fundamentally, Tata Steel looks strong.
Profit growth looks exceptional.
Margins improved sharply.
Operations became more efficient.
Dividend moved higher.
Financial health appears stable.
Technically, the picture looks weaker.
Price trades below every major moving average.
The stock remains inside a falling channel.
Momentum indicators remain negative.
Volume does not show strong buyer conviction.
The market currently appears cautious.
This means fundamentals and technical structure tell two very different stories.
Final Market Interpretation
At present, Tata Steel looks like a fundamentally strong company facing short term technical weakness.
The business itself appears healthy.
The stock chart shows sellers still dominate market direction.
Long term investors may focus more on business strength and future infrastructure demand in India.
Short term traders may remain cautious until the price breaks above ₹188, ₹193, and eventually ₹205.
Until the stock exits the descending channel, market sentiment remains defensive.
For now, the company looks strong.
The stock does not.
That difference makes Tata Steel one of the more interesting cases inside the NIFTY 50 metal sector.
Frequently Asked Questions (FAQs)
1. Why did Tata Steel profit rise sharply in FY26?
Tata Steel reported a major jump in profit mainly because of better cost control, stronger operating efficiency, and higher EBITDA margins. Profit after tax rose from ₹3,174 crore to ₹10,886 crore.
2. If Tata Steel results were strong, why is the stock price falling?
Even though company performance improved, the stock market often looks ahead. Investors may have concerns about future steel demand, global pricing pressure, and possible weakness in the broader steel sector.
3. What does trading below all moving averages mean for Tata Steel?
The stock currently trades below the 20-day, 50-day, and 200-day moving averages. This usually suggests short term weakness and indicates that sellers currently have more control over price direction.
4. Is Tata Steel technically bullish or bearish right now?
From a chart perspective, the stock currently looks bearish. Price continues to move lower, remains inside a falling channel, and has not crossed above important resistance zones.
5. What is the significance of the descending channel on the chart?
A descending channel usually shows a controlled downtrend where the stock keeps making lower highs and lower lows. This often means the market remains cautious until a breakout happens.
6. What support level should investors watch in Tata Steel?
The immediate support level appears near ₹184.70. If price falls below this zone, the next support areas may appear near ₹182, ₹178, and ₹175.
7. What resistance levels are important for Tata Steel now?
Important resistance levels currently sit around ₹188, ₹193, and ₹205. These levels match the major moving averages visible on the technical chart.
8. Does the MACD indicator show a reversal in Tata Steel?
Not yet. The MACD remains below zero, which usually reflects bearish momentum. The histogram has turned slightly positive, but this only shows that selling pressure has slowed for now.
9. Is Tata Steel fundamentally strong despite recent stock weakness?
Yes. The FY26 numbers show strong revenue growth, a sharp rise in EBITDA, higher profit, improved margins, and an increase in dividend. The business performance remains strong even though the stock chart looks weak.
10. What is the overall outlook for Tata Steel stock?
The company fundamentals look healthy, but technical indicators remain weak in the short term. Long term investors may focus on business strength, while short term traders may wait for price to move above key resistance levels before expecting trend recovery.
Disclaimer:
This analysis is for educational and informational purposes only and does not represent financial advice, investment advice, or a recommendation to buy or sell any security. Always do your own research before making market decisions.
ALSO READ: This ₹48 Cr Deal Changes GK Energy’s Future