Hindustan Aeronautics Limited (HAL) has started to attract fresh attention after a strong move on both the daily and intraday charts. The recent price action has created a technical structure that many market participants may consider constructive. The chart also shows support from several technical indicators across different timeframes.
This analysis looks at the daily, 75-minute, and 15-minute charts to understand the present market structure. The discussion uses chart patterns, moving averages, RSI, ADX, VWAP, Fibonacci levels, and price behaviour. The purpose of this article is only to explain the technical picture. It does not predict future prices or provide investment advice.
Daily Chart Shows a Strong Bullish Foundation
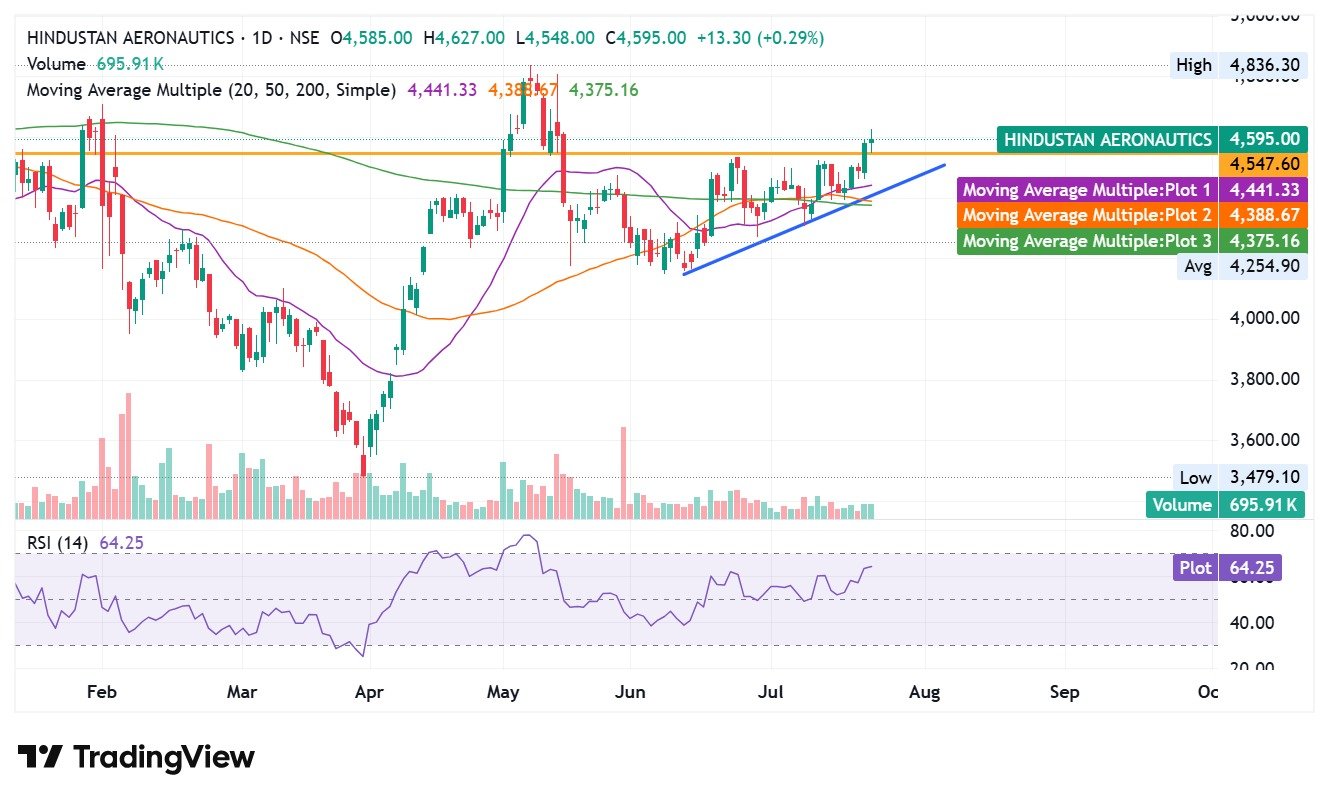
The daily chart presents one of the strongest signals for the current trend. Price has stayed above all major moving averages while also creating a pattern that often appears before a continuation of an existing trend.
The stock has recovered well from earlier weakness and has built a series of higher lows followed by higher highs. This sequence reflects steady demand. Buyers have accepted higher prices over several weeks, which has helped the trend remain positive.
The latest daily candle closed at ₹4,595, well above the important resistance zone near ₹4,548. This close has placed the stock above a level that previously acted as resistance.
Although one close above resistance does not always confirm a lasting breakout, the present structure appears constructive because several indicators support the move.
The Ascending Triangle Adds Strength to the Setup
One of the most noticeable features on the daily chart is the ascending triangle.
This pattern forms when buyers continue to push the price higher after every pullback, while sellers defend a nearly flat resistance level.
The rising trendline connects several higher lows. At the same time, price has tested the resistance zone near ₹4,550 more than once.
Such a pattern often reflects gradual buyer strength. Every decline ends at a higher level than the previous one. This behaviour shows that demand remains active.
The recent close above resistance has improved the technical picture. However, many traders usually prefer one or two additional daily closes above the breakout level before they treat the move as fully confirmed.
Ascending Triangle Summary
| Technical Feature |
Observation |
| Pattern |
Ascending Triangle |
| Resistance Zone |
₹4,548–₹4,550 |
| Latest Close |
₹4,595 |
| Pattern Bias |
Bullish continuation |
| Confirmation |
More daily closes above ₹4,550 may strengthen confidence |
Moving Averages Present a Healthy Trend
Moving averages often help traders understand trend direction.
HAL currently trades above the three most widely followed simple moving averages.
| Moving Average |
Value |
| 20 SMA |
₹4,441.33 |
| 50 SMA |
₹4,388.67 |
| 200 SMA |
₹4,375.16 |
The order of these averages also deserves attention.
Price stands above the 20-day average. The 20-day average remains above the 50-day average. The 50-day average also stays above the 200-day average.
Many analysts describe this arrangement as a healthy bullish alignment because it reflects strength across short, medium, and long-term trends.
The upward slope of the shorter averages also supports the positive market structure.
RSI Suggests Momentum Has Room to Continue
The Relative Strength Index, or RSI, helps measure momentum.
The daily RSI stands near 64.25.
This level sits above the neutral mark of 50, which often reflects buyer control. At the same time, the reading remains below the commonly watched overbought level of 70.
This position leaves room for additional strength if buying interest continues.
A rising RSI above 50 without reaching extreme levels often appears during healthy trends.
Volume Will Remain an Important Signal
Price has moved above resistance, but volume has not expanded sharply.
A breakout with strong participation often gives additional confidence because it suggests broader market interest.
Future trading sessions may therefore become important.
If price continues to remain above ₹4,550 while volume improves, confidence in the breakout may increase.
If volume stays weak and price returns below resistance, the market may require more time before another attempt.
The 75-Minute Chart Supports the Daily Trend
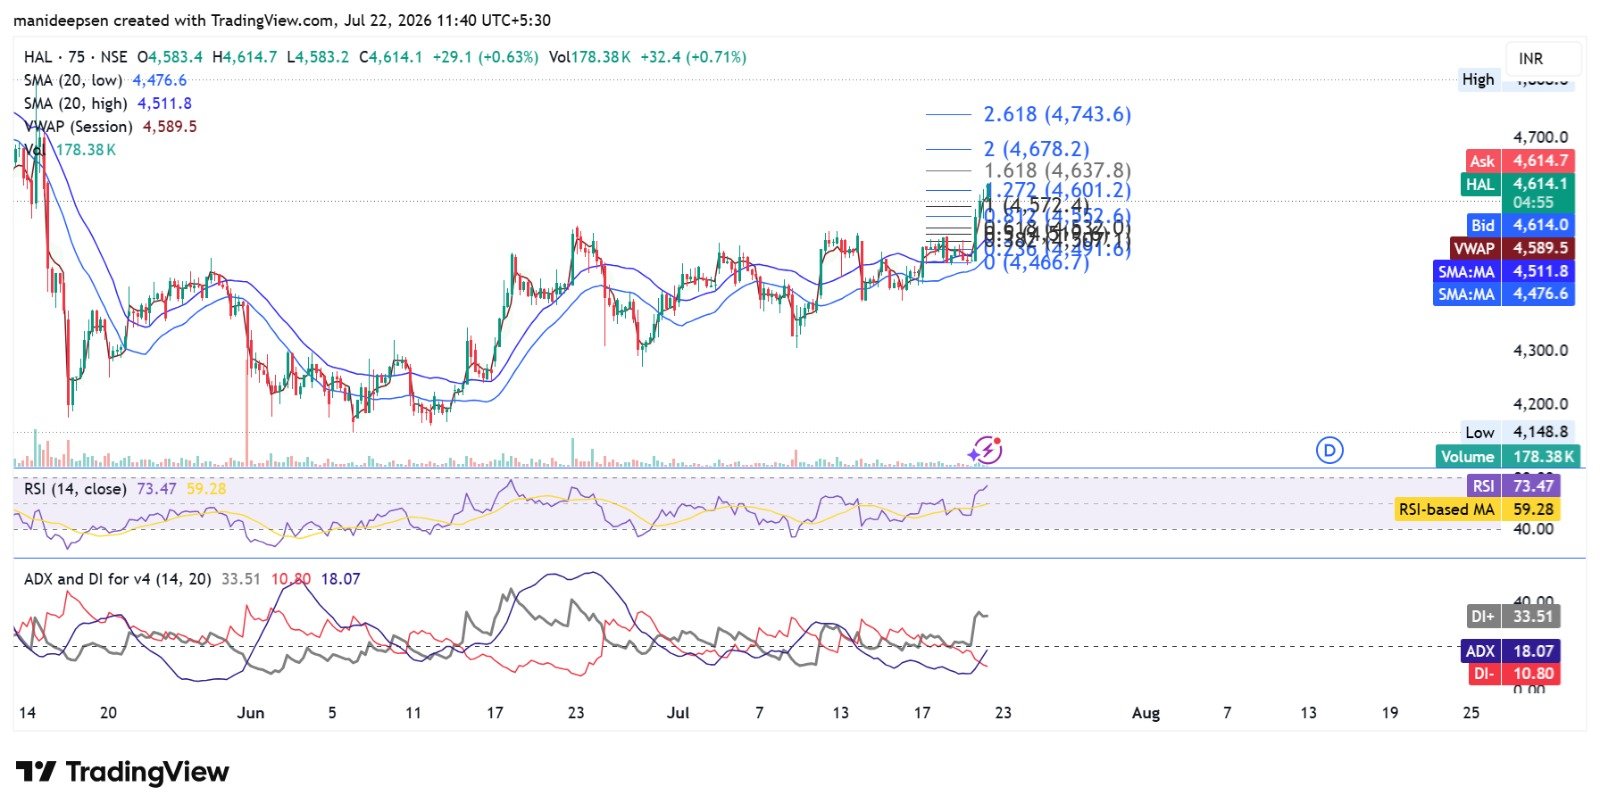
The 75-minute chart offers a closer view of recent market activity.
The stock trades above the important moving averages and also remains above the session VWAP.
The latest price stands near ₹4,614.
The important technical levels appear below.
| Indicator |
Value |
| Price |
₹4,614.1 |
| VWAP |
₹4,589.5 |
| 20 SMA Low |
₹4,476.6 |
| 20 SMA High |
₹4,511.8 |
Price above these levels usually reflects continued buyer strength during the current session.
Higher Highs and Higher Lows Continue
The intraday structure also shows higher highs and higher lows.
This sequence usually reflects a healthy trend because buyers enter after every short decline.
Instead of large corrections, price has produced shallow pullbacks before another advance.
This behaviour matches the positive structure already visible on the daily chart.
When multiple timeframes display the same direction, traders often describe the trend as stronger than a move that appears on only one chart.
Fibonacci Levels Highlight the Next Resistance Zones
The Fibonacci extension levels show possible resistance areas if the trend continues.
The current price has already crossed the 1.272 extension.
The next important levels appear below.
| Fibonacci Extension |
Price Level |
| 1.272 |
₹4,601.2 |
| 1.618 |
₹4,637.8 |
| 2.000 |
₹4,678.2 |
| 2.618 |
₹4,743.6 |
These levels do not guarantee that price will stop or reverse.
Many traders simply use them as reference zones where profit booking or fresh price reactions may appear.
RSI on the 75-Minute Chart Shows Strong Momentum
The RSI on the 75-minute chart stands near 73.47.
This level has entered the traditional overbought zone.
An overbought reading does not automatically mean that price must decline.
During strong trends, RSI may remain above 70 for several sessions while price continues to rise.
However, such readings often suggest that short-term traders should also watch for small pauses or brief pullbacks before the next move.
ADX Shows Buyer Control
The ADX and Directional Movement indicators provide another view of trend strength.
Current readings appear below.
| Indicator |
Value |
| DI+ |
33.51 |
| DI- |
10.80 |
| ADX |
18.07 |
DI+ remains well above DI-, which reflects stronger buyer control than seller pressure.
The ADX stays below 20, which suggests that the trend has room to become stronger if momentum continues.
A rise above 20 or 25 may support the view that the trend has gained additional strength.
The 15-Minute Chart Adds Another Positive Signal
The smallest timeframe also supports the larger trend.
The 15-minute chart shows repeated support near the 20-period moving average.
This detail may appear small, but it often carries importance during healthy trends.
Instead of deep corrections, price has returned to the 20-period average before buyers entered once again.
This behaviour reflects steady demand.
Many strong trends respect the short-term moving average before another upward move begins.
As long as this pattern continues, short-term momentum may remain positive.
Multi-Timeframe Analysis Creates Better Confidence
One timeframe rarely tells the complete story.
The present chart structure becomes more interesting because all three timeframes point in the same general direction.
| Timeframe |
Technical View |
| Daily |
Ascending triangle breakout with bullish moving average alignment |
| 75-Minute |
Price above VWAP, moving averages, and Fibonacci breakout |
| 15-Minute |
Regular support near the 20-period moving average |
When the daily trend and intraday structure support each other, technical confidence often improves.
This does not remove risk, but it reduces conflicting signals.
Important Support Levels
Several price levels may attract market attention if the stock faces a pullback.
| Support Level |
Reason |
| ₹4,590 |
VWAP |
| ₹4,550 |
Previous resistance |
| ₹4,511 |
20 SMA High |
| ₹4,476 |
20 SMA Low |
| ₹4,441 |
Daily 20 SMA |
| ₹4,389 |
Daily 50 SMA |
These levels may act as areas where buyers attempt to defend the trend.
A clear break below several of these zones may weaken the present technical picture.
Possible Resistance Areas
If the trend continues, traders may watch several higher levels.
| Resistance |
Reason |
| ₹4,637 |
Fibonacci 1.618 |
| ₹4,678 |
Fibonacci 2.000 |
| ₹4,744 |
Fibonacci 2.618 |
| ₹4,836 |
Previous swing high |
These levels represent possible reaction zones rather than guaranteed price targets.
What Could Strengthen the Bullish View?
The present chart already displays several positive signals.
Further strength may appear if price continues to hold above ₹4,550, volume expands during the next advance, the 15-minute chart continues to respect the 20-period moving average, and the daily chart produces more closes above the breakout level.
Such behaviour would support the present technical structure.
What Could Weaken the Current Structure?
Technical analysis also requires attention to risk.
The bullish view may weaken if price falls back below ₹4,550 and remains below that level.
Repeated failure to hold the 15-minute 20-period moving average may also reduce short-term momentum.
A move below the major daily moving averages would create another sign that buyer strength has faded.
These developments have not appeared at present, but they remain important areas for observation.
Final Thoughts
HAL currently presents a technically strong chart across multiple timeframes. The daily chart shows an ascending triangle breakout along with a healthy alignment of the 20-day, 50-day, and 200-day moving averages. The RSI remains positive without reaching extreme levels, which leaves room for additional momentum.
The 75-minute chart supports the larger trend through higher highs, higher lows, price above VWAP, and bullish Fibonacci extensions. Although the intraday RSI has entered the overbought zone, this condition often appears during strong trends and does not automatically signal a reversal.
The 15-minute chart adds another constructive element because price has repeatedly found support near the 20-period moving average. This behaviour reflects steady buying interest during short-term pullbacks.
Overall, the available technical evidence suggests that HAL remains in a positive trend. Even so, no chart pattern or technical indicator can guarantee future performance. Market conditions can change without warning, and technical signals may fail. For that reason, the current setup should be viewed as a structured technical assessment rather than a prediction of future price movement or a recommendation to buy or sell any security.