In the fast-paced world of electric infrastructure, Schneider Electric Infrastructure Ltd (SEIL) emerges as a powerhouse of innovation and excellence. With a commitment to manufacturing, designing, and servicing technologically advanced products and systems for electricity networks, SEIL stands at the forefront of revolutionizing the way electricity is managed and distributed. In this comprehensive analysis, we delve into SEIL’s recent performance, trading indicators, and fundamental metrics, shedding light on its profound impact on the electric equipment industry and its potential for investors.
Understanding Recent Stock Performance
SEIL’s stock recently witnessed significant movements, with the daily high reaching Rs. 752 and the low touching Rs. 715. Notably, the stock recorded a substantial increase in price by Rs. 24.25, representing a noteworthy gain of 3.4% from the previous day’s close. Moreover, the trading volume surged to 365,800 shares, indicating heightened investor activity and interest in the stock.
About Schneider Electric Infrastructure Ltd
SEIL is primarily engaged in the business of manufacturing, designing, building, and servicing a wide range of technologically advanced products and systems for electricity networks. Its product portfolio includes transformers, power transformers, switchgears, protection relays, electricity distribution management systems, and software suites for smart grid management. SEIL’s key end markets span across power generation, transmission, distribution, oil & gas, metro, and other electro-intensive segments.
Key Trading Opportunities and Indicators
Key Trading Opportunities and Indicators play a crucial role in guiding investors towards making informed decisions regarding their investments. In the case of Schneider Electric Infrastructure Ltd (SEIL), several key indicators suggest favorable opportunities for investors to capitalize on the stock’s potential. Let’s delve deeper into these indicators to understand their significance:
Stock to Trade: SEIL’s stock presents a trading opportunity under One Day Bullish Strategies. This implies that the stock is exhibiting bullish momentum and may present short-term trading opportunities for investors looking to capitalize on upward price movements.
RSI Entering the Overbought Zone: The Relative Strength Index (RSI) is a momentum oscillator that measures the speed and change of price movements. When the RSI crosses above 70, it enters the overbought zone, indicating that the stock may be overvalued in the short term. While this suggests potential overvaluation, it also indicates strong upward momentum in the stock price.
Crossing All-Time High: SEIL’s stock recently closed at Rs. 741.05, surpassing its previous all-time high of Rs. 730.00. This signifies bullish momentum and investor confidence in the company’s growth prospects. Crossing the all-time high is a significant milestone and may attract further buying interest from investors.
Increasing Relative Strength: The Relative Strength (RS) of SEIL’s stock against the benchmark index has increased by 0.12 over the last three days, reaching a current RS of 0.75. A rising RS indicates that the stock is outperforming the broader market, suggesting strong relative strength and potentially attractive investment prospects.
Crossing Upper Bollinger Band: The Upper Bollinger Band is a technical indicator that represents two standard deviations above the moving average. When a stock’s price crosses above the Upper Bollinger Band, it indicates a potential uptrend in price. In the case of SEIL, the stock closed at Rs. 741.05, crossing its Upper Bollinger Band from below by 0.3%, signaling a potential uptrend in price and presenting a bullish trading opportunity.
High Volume & Delivery: Trading volume and delivery for SEIL’s stock surged significantly, with volume increasing by 3 times and delivery rising by 3 times compared to the five-day average. This surge in volume and delivery, coupled with a 3.38% price movement, reflects strong investor confidence and conviction in the stock. High volume and delivery are often indicative of increased buying interest and positive sentiment towards the stock.
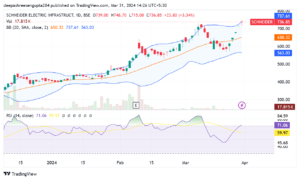
SOURCE: TREADING VIEW
Fundamental Metrics
Examining SEIL’s fundamental metrics provides insights into the company’s financial health and valuation:
Sector and Industry: SEIL operates within the Capital Goods sector, specifically in the Electric Equipment industry. This information gives investors context about the company’s area of focus and its position within the broader market landscape. Understanding the sector and industry dynamics helps investors assess SEIL’s competitive position and growth potential relative to its peers.
Market Cap and Category: SEIL falls under the Small Cap category, with a market capitalization of Rs. 17,618.38 crores. Market capitalization reflects the total market value of a company’s outstanding shares and is a key indicator of its size within the market. As a Small Cap company, SEIL may offer growth opportunities for investors seeking exposure to smaller, potentially high-growth companies.
Enterprise Value (EV): SEIL’s Enterprise Value stands at Rs. 18,086.19 crores, representing the total value of the business, including both debt and equity, after accounting for cash and cash equivalents. EV provides a comprehensive measure of a company’s total value and is useful for comparing the relative valuation of companies, especially in the context of mergers, acquisitions, or takeovers.
Book Value per Share: SEIL’s Book Value per Share is Rs. 13.03, indicating the net asset value per share as reported in its financial statements. Book value per share represents the equity value attributable to each outstanding share of the company’s stock. It serves as a measure of the company’s tangible assets and provides insight into its financial stability and asset base.
Price-Earning Ratio (PE): SEIL’s Price-Earning Ratio (PE) stands at 82.49, reflecting the valuation of the company’s stock relative to its earnings per share (EPS). A high PE ratio suggests that investors are willing to pay a premium for SEIL’s earnings, potentially indicating market expectations of future growth. However, it’s essential to interpret the PE ratio in the context of industry norms and growth prospects.
PEG Ratio: SEIL’s PEG Ratio is 2.77, indicating the ratio of the company’s PE ratio to its earnings growth rate. A PEG ratio above 1 typically suggests that the stock may be overvalued relative to its earnings growth potential, while a ratio below 1 may indicate undervaluation. In the case of SEIL, a PEG ratio of 2.77 suggests that the stock may be relatively overvalued compared to its earnings growth potential.
In conclusion, Schneider Electric Infrastructure Ltd’s stellar performance, coupled with its innovative products and strong market position, positions it as a compelling investment opportunity in the electric equipment industry. However, investors should conduct thorough due diligence, analyze market trends, and consider risk factors before making any investment decisions. By staying informed and vigilant, investors can potentially capitalize on the growth potential of Schneider Electric Infrastructure Ltd and participate in its journey of transforming the electric infrastructure landscape.
ALSO READ: This Stock Surges Amidst Record-Breaking Performance