
The stock market witnessed an explosive trading session today as three standout performers grabbed investor attention with massive gains and strong momentum. Newgen Software Technologies surged nearly 20%, hitting the upper circuit with exceptional buying interest, while Alkyl Amines Chemicals rallied close to 10% after a sharp breakout during the session. Concord Biotech also joined the winning streak, soaring over 11% and touching fresh intraday highs. With strong volumes, bullish sentiment, and impressive price action, these stocks emerged as the top market movers of the day, making them the center of attention for traders and investors alike.
1. Newgen Software Technologies Surges Nearly 20%: What’s Driving the Rally?
Strong Buying Pushes the Stock Higher
Newgen Software Technologies Limited witnessed a massive rally in today’s trading session, with the stock surging nearly 20% and hitting the upper circuit. The sharp rise attracted strong investor attention as the company emerged as one of the top-performing stocks of the day.
The stock opened at ₹439.10 and quickly gained momentum during the session, touching an intraday high of ₹529.80. Heavy buying interest and strong trading volumes supported the rally throughout the day, reflecting bullish market sentiment around the company.
Growing Optimism Around AI and Digital Transformation
One of the major reasons behind the rally is the growing global demand for AI-powered enterprise software and digital automation solutions. Businesses across industries are increasingly investing in workflow automation, document management, and digital transformation platforms to improve efficiency and reduce operational costs.
Newgen Software, which operates in the enterprise digital transformation space, is benefiting from this strong industry trend. Investors are showing increased confidence in technology companies that are focused on automation, cloud services, and AI-based solutions.
Rising SaaS Revenue Improves Investor Confidence
Another key factor supporting the stock is the company’s growing Software-as-a-Service (SaaS) and recurring revenue business. Markets generally reward companies that generate stable and predictable revenue streams through subscriptions and long-term contracts.
Newgen has been steadily expanding its SaaS offerings, which has strengthened investor confidence in the company’s future earnings visibility and long-term growth potential.
Global Business Expansion Adds Strength
The company has also been expanding its international presence through new overseas deals and partnerships. Recent business developments in regions such as the United States, Europe, and the Middle East have improved market sentiment around the stock.
Investors often view international order wins as a positive sign because they highlight a company’s ability to compete globally and diversify revenue sources beyond the domestic market.
Momentum Buying Accelerates the Rally
Apart from fundamental triggers, technical momentum also played a major role in today’s sharp move. After correcting significantly from earlier highs, the stock started witnessing fresh buying as traders and short sellers rushed to take positions.
The breakout above important price levels further boosted momentum buying, helping the stock extend gains rapidly during the trading session.
Technical Analysis: Strong Short-Term Momentum Within a Larger Bearish Structure
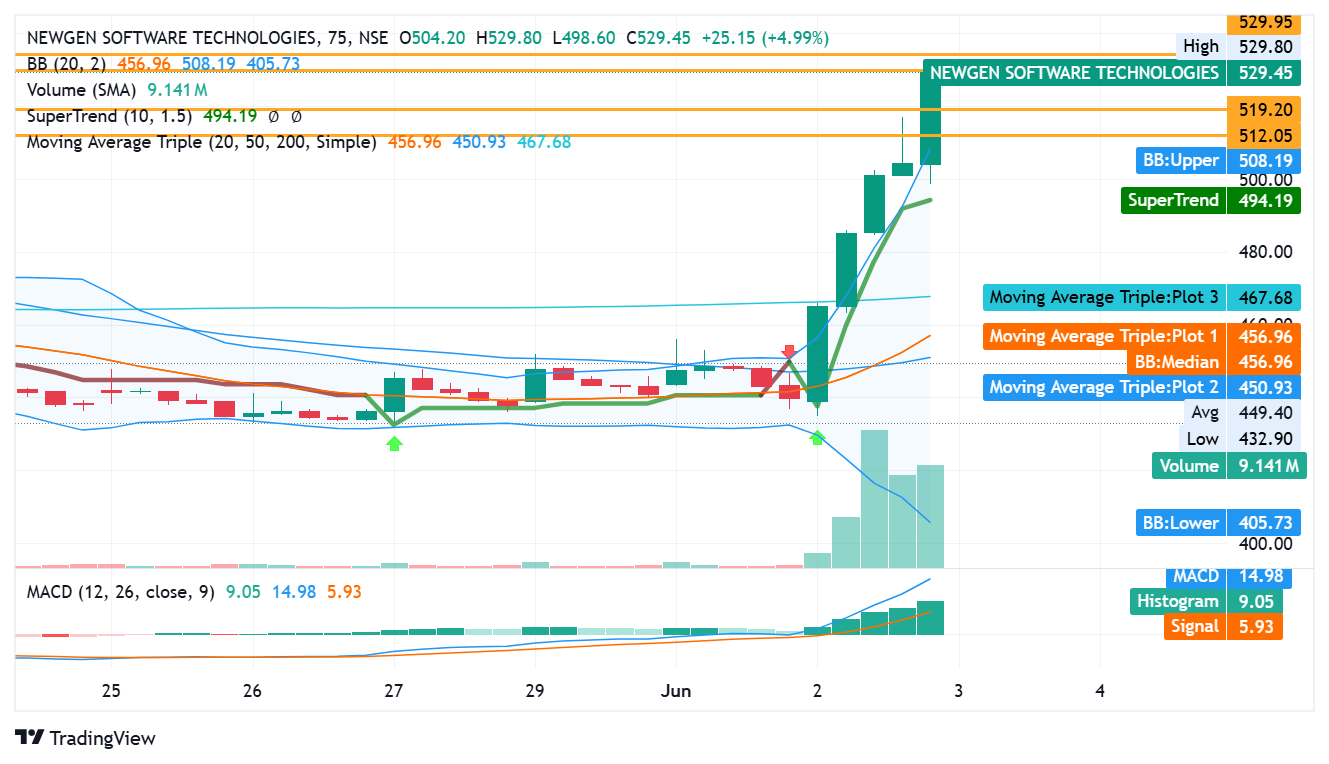
From a technical perspective, Newgen Software Technologies witnessed a powerful breakout rally supported by strong price action, rising volumes, and momentum-based buying activity. The stock rallied sharply toward the ₹530 zone after successfully breaking above multiple short-term resistance levels, indicating aggressive bullish participation during the session.
Trend Structure on the 75-Minute Timeframe
The broader trend structure still reflects a mixed setup despite today’s explosive move. On the 75-minute timeframe, the 200-period moving average remains above the 20-period moving average, while the 50-period moving average is positioned below the 20-period moving average. This setup suggests that although the stock remains technically bearish from a long-term trend perspective, the current rally may represent a strong short-term bullish recovery within a larger downtrend structure.
The sharp move above the short-term averages indicates improving momentum, but confirmation of a complete trend reversal would require sustained price action above key resistance zones over the coming sessions.
ALSO READ: Duro Pack Q4 FY26 Results Show Stable Profit Growth
Bollinger Band and SuperTrend Breakout
The stock traded significantly above the upper Bollinger Band level near ₹508, signaling extremely strong momentum and volatility expansion. Such moves typically indicate aggressive buying pressure and heightened trader participation.
In addition, the stock remained firmly above the SuperTrend indicator positioned near ₹494, reinforcing the ongoing bullish momentum in the near term. Sustaining above this level could help the stock maintain positive sentiment in upcoming sessions.
MACD Signals Strong Bullish Momentum
Momentum indicators also supported the breakout structure. The MACD line remained well above the signal line with expanding histogram bars, indicating strengthening bullish momentum and continuation buying.
The sharp increase in volume alongside the MACD crossover further confirms that today’s rally was backed by strong market participation rather than low-volume speculative movement.
Key Support and Resistance Levels
Immediate Support Zone: ₹512 – ₹519
On the 15-minute timeframe, the ₹512–₹519 range is acting as the immediate support zone. Holding above this region may keep short-term bullish momentum intact and could encourage further buying interest.
This zone may also act as a potential accumulation area if the stock witnesses minor profit-booking after the sharp rally.
Immediate Resistance Zone: ₹529 – ₹534
The immediate resistance range stands between ₹529 and ₹534. The stock tested this zone during the session, and a decisive breakout above this level could open the door for further upside momentum in the short term.
However, failure to sustain above resistance may trigger temporary consolidation or mild retracement after the steep intraday move.
Volume and Market Participation
Trading activity remained exceptionally strong throughout the session. The stock recorded traded volumes of more than 352 lakh shares with traded value crossing ₹1,762 crore, reflecting aggressive participation from traders and institutions.
At the same time, the low impact cost of 0.05 suggests strong liquidity and efficient execution, which often attracts momentum-based institutional trading activity.
Long-Term Performance Snapshot
Despite today’s rally, the stock continues to trade significantly below its long-term highs. Newgen Software remains nearly 57% lower on a one-year basis and over 36% down on a year-to-date basis, highlighting the extent of the previous correction.
However, the company still maintains strong long-term wealth creation credentials with returns of more than 155% over five years and nearly 57% over three years, reflecting its historical growth potential despite medium-term volatility.
Overall Outlook
Technically, Newgen Software Technologies appears to be undergoing a strong short-term recovery supported by bullish momentum indicators, rising volumes, and aggressive buying activity. While the broader trend still remains cautious due to the long-term bearish moving average structure, the current setup favors near-term strength as long as the stock sustains above the ₹512 support zone.
A decisive breakout above ₹534 could further strengthen bullish sentiment, while inability to hold recent gains may lead to consolidation after the sharp rally.
2. Alkyl Amines Chemicals Limited Rallies Nearly 10% Amid Recovery Optimism
Alkyl Amines Chemicals Limited emerged as one of the top-performing chemical stocks in today’s trading session, with the stock surging nearly 10% as investors showed renewed confidence in the company’s recovery prospects and improving industry outlook.
The strong rally came after market sentiment improved around global raw material supply conditions, especially related to ammonia availability. Earlier, the company had faced operational challenges due to supply disruptions affecting ammonia-dependent production at some of its manufacturing plants. However, easing concerns around global supply chains and expectations of production normalization helped boost investor confidence.
Improving Sentiment in the Specialty Chemicals Sector
The broader specialty chemicals sector also witnessed improving sentiment as investors turned optimistic about gradual recovery in global demand. Alkyl Amines, which supplies products to pharmaceutical, agrochemical, water treatment, and specialty chemical industries, is expected to benefit if industrial demand continues to improve in both domestic and export markets.
Investors are also viewing the recent correction in the stock as a potential recovery opportunity. After facing pressure in previous months due to operational disruptions and weak sentiment in the chemicals space, the stock attracted fresh buying interest as traders anticipated better earnings visibility in the coming quarters.
Dividend Announcement Adds Positive Sentiment
Another factor supporting today’s movement was the company’s recent dividend-related announcement and upcoming shareholder events. Such corporate actions often improve investor sentiment, especially in fundamentally strong companies with healthy balance sheets and long-term growth potential.
The stock also witnessed heavy trading activity during the session, indicating strong participation from both institutional and momentum-based traders. Rising volumes along with strong price action suggest that market participants are closely watching the stock for further recovery signals in the near term.
Technical Analysis: Bullish Recovery Supported by Strong Momentum
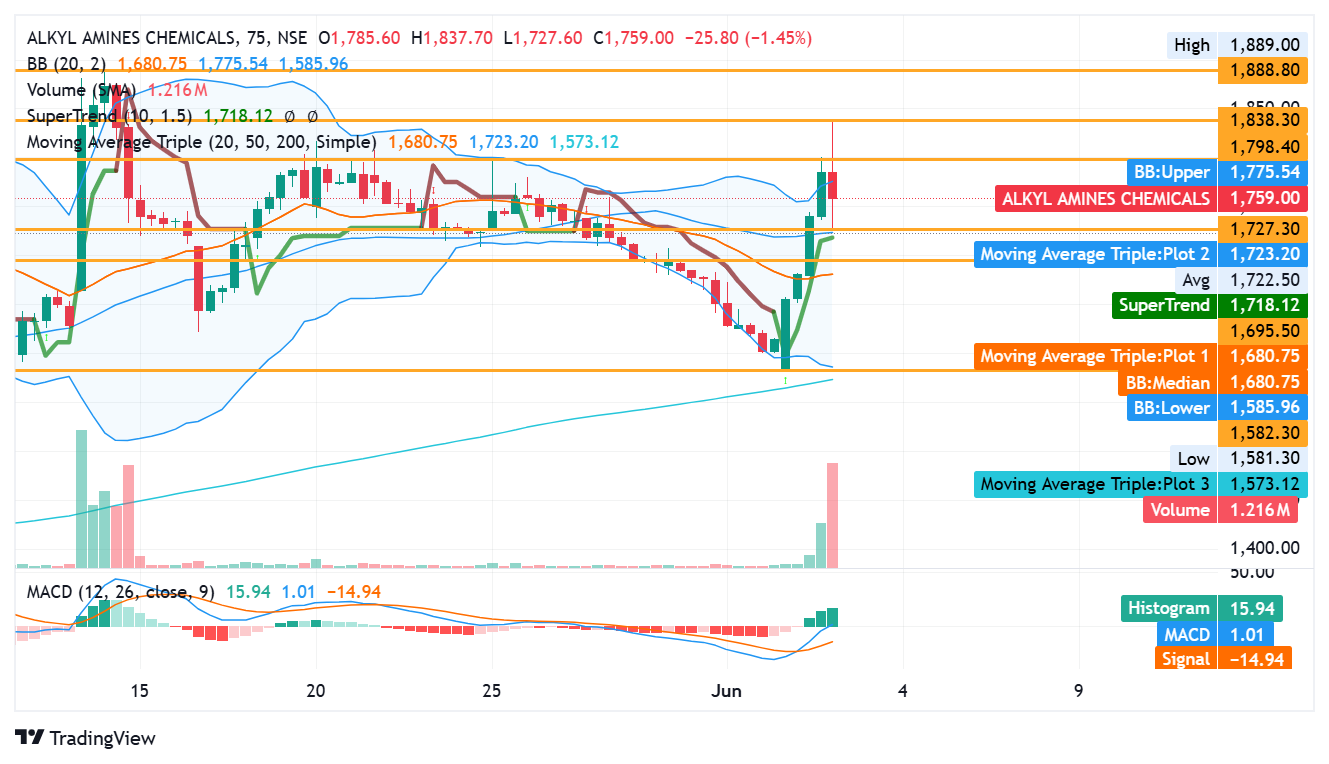
From a technical perspective, Alkyl Amines Chemicals witnessed a strong breakout rally supported by sharp price action, rising volumes, and improving momentum indicators. The stock surged nearly 10% during the session and moved aggressively toward the ₹1,838 resistance zone, reflecting renewed buying interest after recent consolidation.
The stock also traded near the upper Bollinger Band during the session, indicating strong momentum and increased volatility expansion as traders aggressively accumulated positions.
Trend Structure on the 75-Minute Timeframe
On the 75-minute timeframe, the technical setup currently reflects a broader bullish structure despite short-term consolidation phases. The 50-period moving average remains above the 20-period moving average, while the 200-period moving average stays below both averages.
This setup generally suggests that the stock remains in a bullish market structure but may currently be witnessing a temporary pullback or consolidation phase within the larger uptrend. The recent sharp recovery from lower levels indicates that buyers are regaining control after the previous correction.
The stock also moved above key moving average levels during the session, which further strengthened short-term bullish sentiment.
ALSO READ: Mohit Industries Q4 FY26 Results Analysis Report
Bollinger Band and SuperTrend Signals
The stock traded close to the upper Bollinger Band near ₹1,775, signaling strong bullish momentum and aggressive buying activity. Sustained movement near the upper band often indicates continuation strength when supported by volumes.
In addition, the price remained comfortably above the SuperTrend indicator positioned near ₹1,718, which reinforces the positive short-term trend structure. Holding above this level could help maintain bullish momentum in upcoming sessions.
MACD Indicates Strengthening Momentum
The MACD indicator also turned strongly positive, with the MACD line crossing above the signal line and histogram bars expanding in positive territory. This reflects strengthening momentum and confirms increasing buying pressure in the stock.
The sharp rise in volumes alongside the bullish MACD crossover suggests that today’s rally was supported by genuine market participation rather than low-volume speculative activity.
Key Support and Resistance Levels
Immediate Support Zone: ₹1,659 – ₹1,727
On the 15-minute timeframe, the ₹1,659–₹1,727 range is acting as the immediate support zone. As long as the stock sustains above this region, short-term bullish momentum may remain intact.
This area may also serve as an important accumulation zone if the stock witnesses temporary profit booking after the recent sharp rally.
Immediate Resistance Zone: ₹1,798 – ₹1,838
The immediate resistance range stands between ₹1,798 and ₹1,838. The stock tested this zone during the session and witnessed strong volatility near these levels.
A decisive breakout above ₹1,838 could trigger fresh momentum buying and potentially open the path for further upside in the short term. However, failure to sustain above resistance may lead to consolidation before the next directional move.
Volume and Market Participation
Trading activity remained significantly strong throughout the session. The stock recorded traded volumes of more than 19 lakh shares with traded value crossing ₹340 crore, reflecting strong institutional and trader participation.
The low impact cost of 0.08 also indicates healthy liquidity in the counter, making it attractive for momentum-based trading activity.
Long-Term Performance Snapshot
Despite today’s rally, Alkyl Amines continues to face pressure in longer-term performance metrics. The stock remains down over 10% on a one-year basis and nearly 51% lower over five years, highlighting the broader weakness seen in the specialty chemicals sector during previous market cycles.
However, the stock has shown improving short-term momentum with gains of more than 16% over the past month and positive year-to-date performance, suggesting that investor sentiment may gradually be stabilizing.
Overall Outlook
Technically, Alkyl Amines Chemicals appears to be witnessing a strong recovery phase supported by bullish momentum indicators, rising volumes, and improving sentiment in the specialty chemicals sector. While short-term volatility may remain elevated near resistance zones, the broader technical structure currently favors bullish continuation as long as the stock sustains above the ₹1,659–₹1,727 support range.
A sustained breakout above ₹1,838 could further strengthen the recovery trend and attract additional momentum-based buying interest in the coming sessions.
3. Concord Biotech Limited Surges Over 11% Amid Strong Recovery Buying
Concord Biotech Limited emerged as one of the top-performing pharmaceutical stocks in today’s trading session, with the stock rallying more than 11% as investors showed renewed confidence in the company’s long-term growth potential and improving market sentiment.
The sharp rise in the stock was largely driven by recovery buying after a prolonged correction from previous highs. The company had witnessed significant pressure in recent months, and today’s strong movement indicates that investors may be viewing current levels as an attractive entry opportunity in the pharmaceutical sector.
Positive Outlook for the Global Pharmaceutical API Industry
Investor sentiment also improved due to the positive long-term outlook for the global Active Pharmaceutical Ingredients (API) industry. Concord Biotech is a leading manufacturer of fermentation-based APIs and supplies products to both domestic and international pharmaceutical markets.
Growing global healthcare spending, increasing demand for specialty pharmaceutical products, and rising focus on complex drug manufacturing are expected to support long-term growth opportunities for companies operating in this segment.
Strategic Expansion and Growth Initiatives Support Sentiment
The company’s continued focus on expansion and biotechnology investments has also contributed to improving investor confidence. Concord Biotech has been strengthening its presence in advanced biotechnology and research-driven pharmaceutical solutions, which may help support future growth prospects.
Apart from industry optimism, the company’s recent dividend announcement also added positive sentiment among investors. Dividend-related developments often attract long-term investors, especially in companies with stable financial performance and strong cash generation.
Strong Buying Interest and Market Participation
The stock also witnessed strong trading activity during the session, indicating rising participation from both institutional and momentum-based traders. Improving technical momentum and increasing trading volumes suggest that market participants are closely monitoring the stock for further recovery potential in the coming sessions.
Technical Analysis: Recovery Momentum Strengthens After Sharp Rebound
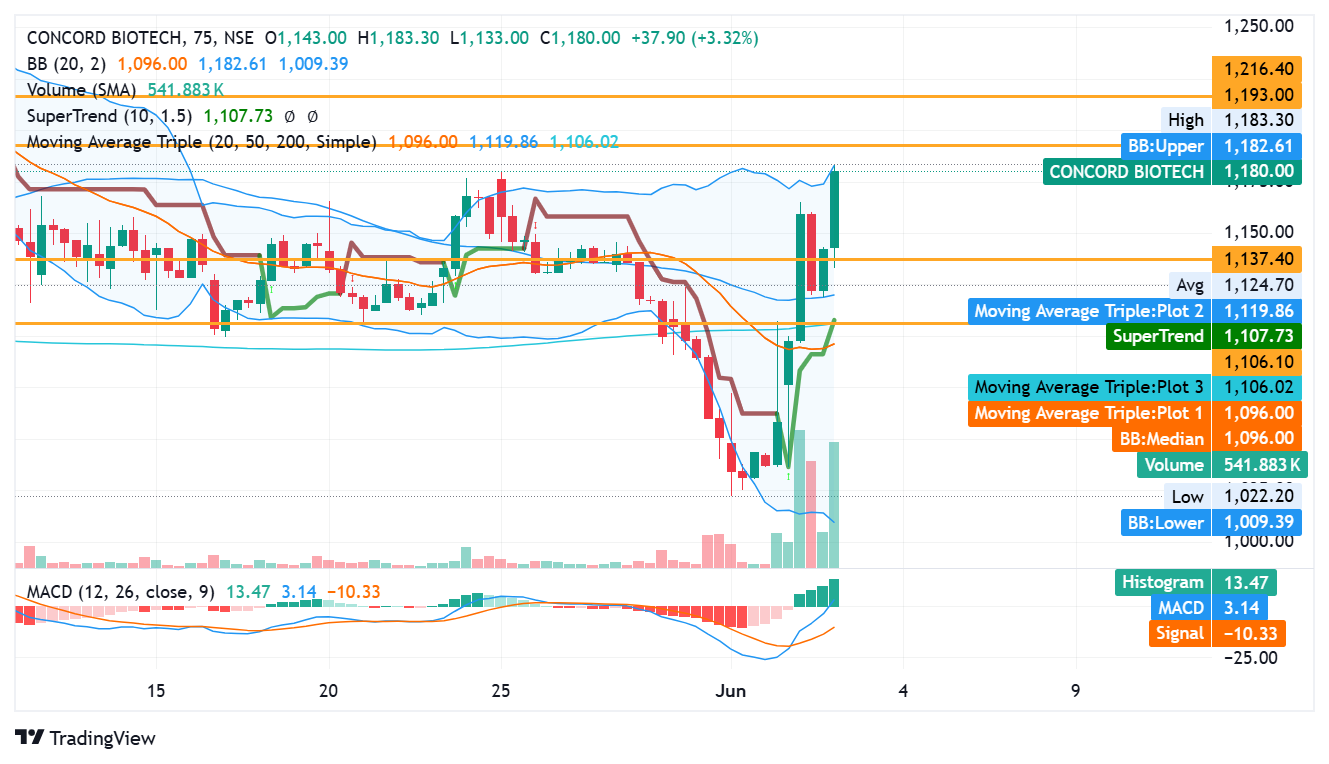
From a technical perspective, Concord Biotech witnessed a strong recovery rally supported by improving momentum indicators, rising trading volumes, and aggressive buying activity near lower levels. The stock surged sharply toward the ₹1,180 zone after recovering from recent weakness, indicating renewed investor interest in the pharmaceutical counter.
The stock also traded close to the upper Bollinger Band during the session, reflecting strong short-term momentum and increased volatility expansion as buyers regained control.
Trend Structure on the 75-Minute Timeframe
The broader technical setup currently reflects a mixed but cautiously positive structure. On the 75-minute timeframe, the 50-period moving average remains above the 200-period moving average, while the 20-period moving average is still positioned below the 200-period moving average.
This setup generally suggests that the broader long-term trend has not completely turned bearish, but short-term market sentiment remains weak and cautious. However, the recent sharp recovery indicates that buyers are attempting to regain momentum after the prolonged correction seen in previous months.
The stock also managed to move back above important short-term levels during the session, which improved near-term technical sentiment.
Bollinger Band and SuperTrend Signals
Concord Biotech traded near the upper Bollinger Band level around ₹1,182, signaling strong bullish momentum and increased trader participation. Sustained movement near the upper band often reflects continuation buying when supported by strong volume activity.
At the same time, the stock remained above the SuperTrend indicator positioned near ₹1,107, reinforcing the ongoing recovery trend in the short term. Holding above this level may help maintain bullish momentum in the coming sessions.
MACD Shows Strong Positive Crossover
The MACD indicator also reflected strengthening momentum. The MACD line crossed above the signal line while histogram bars continued expanding in positive territory, indicating increasing buying pressure and improving momentum strength.
The sharp rise in trading volumes alongside the bullish MACD crossover confirms that today’s rally was supported by strong market participation rather than low-volume speculative movement.
Key Support and Resistance Levels
ALSO READ: Motilal Oswal Microcap Fund Review 2026
Immediate Support Zone: ₹1,106 – ₹1,137
On the 75-minute timeframe, the ₹1,106–₹1,137 range is acting as the immediate support zone. As long as the stock sustains above this area, the short-term recovery structure may remain intact.
This zone may also serve as an important accumulation region if the stock witnesses temporary profit booking after the recent rally.
Immediate Resistance Zone: ₹1,193 – ₹1,216
The immediate resistance range stands between ₹1,193 and ₹1,216. The stock approached this zone during the session, and a decisive breakout above these levels could trigger fresh momentum buying in the near term.
However, failure to cross resistance decisively may lead to temporary consolidation before the next directional move.
Volume and Market Participation
Trading activity remained strong throughout the session. Concord Biotech recorded traded volumes of more than 18 lakh shares with traded value crossing ₹212 crore, reflecting healthy participation from institutional and momentum-based traders.
The low impact cost of 0.08 also highlights strong liquidity in the counter, which supports efficient execution and active trading participation.
Long-Term Performance Snapshot
Despite today’s sharp rally, the stock continues to trade significantly below its 52-week high of ₹2,150.40. Concord Biotech remains down more than 35% on a one-year basis and over 11% lower on a year-to-date basis, reflecting the broader correction seen in the pharmaceutical sector.
However, recent short-term performance has started showing signs of stabilization, with improving weekly and monthly returns indicating gradual recovery in investor sentiment.
Overall Outlook
Technically, Concord Biotech appears to be witnessing a strong short-term recovery supported by bullish momentum indicators, rising volumes, and improving sentiment in the pharmaceutical API sector. While the broader trend still requires confirmation for a full reversal, the current setup favors near-term strength as long as the stock sustains above the ₹1,106–₹1,137 support zone.
A sustained breakout above ₹1,216 could further strengthen bullish momentum and attract additional buying interest in the upcoming sessions.
Conclusion
Today’s trading session witnessed strong momentum across select mid-cap stocks, with Newgen Software Technologies, Alkyl Amines Chemicals, and Concord Biotech emerging as some of the biggest gainers in the market. Each of these stocks attracted heavy investor attention due to a combination of improving sector sentiment, recovery buying, strong technical setups, and company-specific developments.
Newgen Software Technologies benefited from optimism surrounding AI-driven enterprise software solutions, global digital transformation trends, and strong momentum-based buying. Alkyl Amines Chemicals gained strength as investors reacted positively to easing supply chain concerns and improving outlook for the specialty chemicals sector. Meanwhile, Concord Biotech rallied sharply on recovery buying, improving pharmaceutical API industry sentiment, and growing confidence in long-term biotechnology opportunities.
From a technical perspective, all three stocks showed strong short-term bullish momentum supported by rising volumes, positive MACD signals, and strong buying activity near important support levels. However, broader trend structures still indicate that investors should remain cautious, as some of these stocks continue to trade below major long-term resistance zones and previous yearly highs.
The coming sessions will remain important for determining whether these rallies can sustain further upside momentum or enter short-term consolidation phases near resistance levels. Traders and investors may continue closely monitoring support zones, volume activity, and overall market sentiment for confirmation of trend continuation.
The information provided in this article is for educational and informational purposes only and should not be considered financial or investment advice. Stock market investments are subject to market risks, volatility, and price fluctuations. Readers are advised to conduct their own research and consult with a qualified financial advisor before making any investment decisions. The technical analysis and market views mentioned in this article are based on publicly available data and chart observations and may change according to market conditions.
Frequently Asked Questions (FAQs)
1. Why did Newgen Software Technologies rally sharply today?
Newgen Software Technologies gained strongly due to positive sentiment around AI-based enterprise software, improving SaaS revenue outlook, international business expansion, and strong momentum buying supported by heavy trading volumes.
2. What triggered the rise in Alkyl Amines Chemicals shares?
The rally in Alkyl Amines Chemicals was mainly supported by easing concerns over ammonia supply disruptions, improving outlook for the specialty chemicals sector, recovery expectations, and strong buying interest from traders and investors.
3. Why did Concord Biotech witness strong buying today?
Concord Biotech attracted investor attention due to recovery buying after a major correction, improving pharmaceutical API sector sentiment, strategic biotechnology investments, and positive momentum in the healthcare sector.
4. Are these stocks currently in a bullish trend?
All three stocks are showing strong short-term bullish momentum based on technical indicators such as MACD, Bollinger Bands, and rising trading volumes. However, some broader long-term trend structures still remain cautious and require confirmation for a complete trend reversal.
5. What should investors monitor in the coming sessions?
Investors should closely watch key support and resistance levels, trading volumes, overall market sentiment, and sector-specific developments to determine whether the current rallies can sustain further upside momentum.
ALSO READ: Invesco Global Equity FoF Review and Returns 2026