
IFCI Limited surprised the market today with a strong rally. The stock opened around ₹72 and climbed all the way to nearly ₹82 during the trading session. Such a large move in a single day naturally caught the attention of investors, traders, and market watchers.
Whenever a stock rises this quickly, investors start asking an important question: what is driving the move?
In the case of IFCI, there does not appear to be a single major announcement that explains the entire rally. Instead, the move seems to be the result of several factors coming together at the same time. Some are related to the company’s business, while others are linked to market sentiment, investor expectations, and technical momentum.
Let us look at the major reasons that may have contributed to today’s sharp rise.
1. Growing Excitement Around the NSE IPO
The biggest reason behind the recent interest in IFCI is the growing excitement surrounding the expected IPO of the National Stock Exchange (NSE).
Investors have been searching for companies that could benefit from the NSE listing. IFCI is one of the names that has attracted attention because of its indirect exposure to valuable financial assets linked to the capital markets ecosystem.
Whenever a major institution like NSE moves closer to a public listing, investors start looking for companies that may gain from a revaluation of their holdings. This often creates a wave of buying interest even before the actual event takes place.
Many market participants believe that IFCI could be one of the indirect beneficiaries of this theme. As a result, the stock has become a popular choice among investors looking to participate in the broader NSE IPO story.
2. Investors Are Discovering Hidden Value
Another important factor is the market’s search for hidden-value opportunities.
Sometimes companies own assets, investments, or stakes that are not fully reflected in their share prices. When investors start noticing these assets, the stock can experience a sharp re-rating.
In recent months, there has been growing interest in companies connected to India’s financial infrastructure. Investors are paying closer attention to businesses that have links to exchanges, depositories, and other financial market institutions.
This trend has helped bring IFCI back into focus.
As more investors study the company’s assets and investments, some believe the market may have previously undervalued the company. Whether this view proves correct or not, the perception of hidden value can itself become a powerful driver of stock prices.
3. Improving Financial Performance
A company’s fundamentals always matter.
IFCI has reported improvement in its recent financial performance. Revenue growth has been encouraging, and investors have started viewing the company more positively compared to previous years.
For a long time, IFCI was seen mainly as a legacy financial institution with limited growth prospects. However, improving numbers can gradually change investor perception.
Markets do not only react to current profits. They also react to expectations about the future. If investors believe that earnings could improve further, they often start buying before the improvement becomes fully visible in financial statements.
This change in perception can lead to a strong rally, especially when the stock had previously been ignored.
4. Strong Interest in PSU Stocks
Government-owned companies have been a major theme in the Indian stock market over the last few years.
Many public sector companies have delivered impressive returns as investors started recognizing their improving balance sheets, stronger profitability, and strategic importance.
IFCI belongs to the broader PSU universe, and that connection matters.
Whenever investors become bullish on public sector stocks, money often flows into multiple companies within the sector. Even if the rally starts in a few large names, it can eventually spread to smaller companies as investors search for additional opportunities.
This broader PSU enthusiasm may have provided additional support to IFCI’s rally.
5. A Powerful Breakout Attracted Traders
Apart from fundamental factors, price action itself can become a reason for further buying.
When a stock breaks above important resistance levels or reaches a new high, traders often see it as a bullish signal.
Many short-term traders use chart-based systems to identify strong momentum stocks. Once IFCI started moving higher and crossed key levels, it likely appeared on the screens of momentum traders across the market.
This creates a cycle where rising prices attract more buyers, and those buyers push prices even higher.
In many cases, technical buying can significantly increase the speed of a rally.
ALSO READ: CMR Green IPO Draws Strong Early Market Demand
6. Huge Trading Volumes Created Attention
One of the most striking features of today’s move was the extremely high trading volume.
Volume is important because it shows how many shares are changing hands. A stock can rise on low volume, but when a large number of shares are traded, the move often attracts much greater attention.
High volume suggests that a large number of market participants are involved. It indicates that institutions, traders, investors, and speculators are all actively participating.
As market participants noticed the unusually high activity in IFCI, more people started following the stock. This increased visibility often brings additional buying interest.
In stock markets, attention itself can become a catalyst.
7. Short Covering May Have Added Fuel
Whenever a stock rises unexpectedly, traders who were betting on a decline can come under pressure.
These traders eventually need to buy back shares to close their positions. This process is known as short covering.
Short covering can accelerate an existing rally because it creates additional demand at a time when the stock is already moving higher.
Although it is difficult to measure the exact contribution of short covering during the day, it is likely that some traders were forced to exit bearish positions as IFCI continued to climb.
This may have added extra momentum to the move.
8. Positive Market Psychology
Markets are driven by both numbers and emotions.
Once a stock starts appearing in headlines, trading terminals, and investor discussions, curiosity grows rapidly.
Investors who had never looked at IFCI before suddenly begin researching the company. Traders start monitoring every price movement. Social media discussions increase. Financial forums become more active.
This rise in attention often creates a positive feedback loop.
As more people notice the stock, more people buy it. As more people buy it, the stock gains even more attention.
This psychological effect can be surprisingly powerful, especially in stocks that are already showing strong momentum.
The combination of improving fundamentals, market themes, rising volumes, and growing investor interest appears to have created the perfect environment for IFCI’s sharp rally today.
Charts Now Show Strong Momentum Across Multiple Indicators
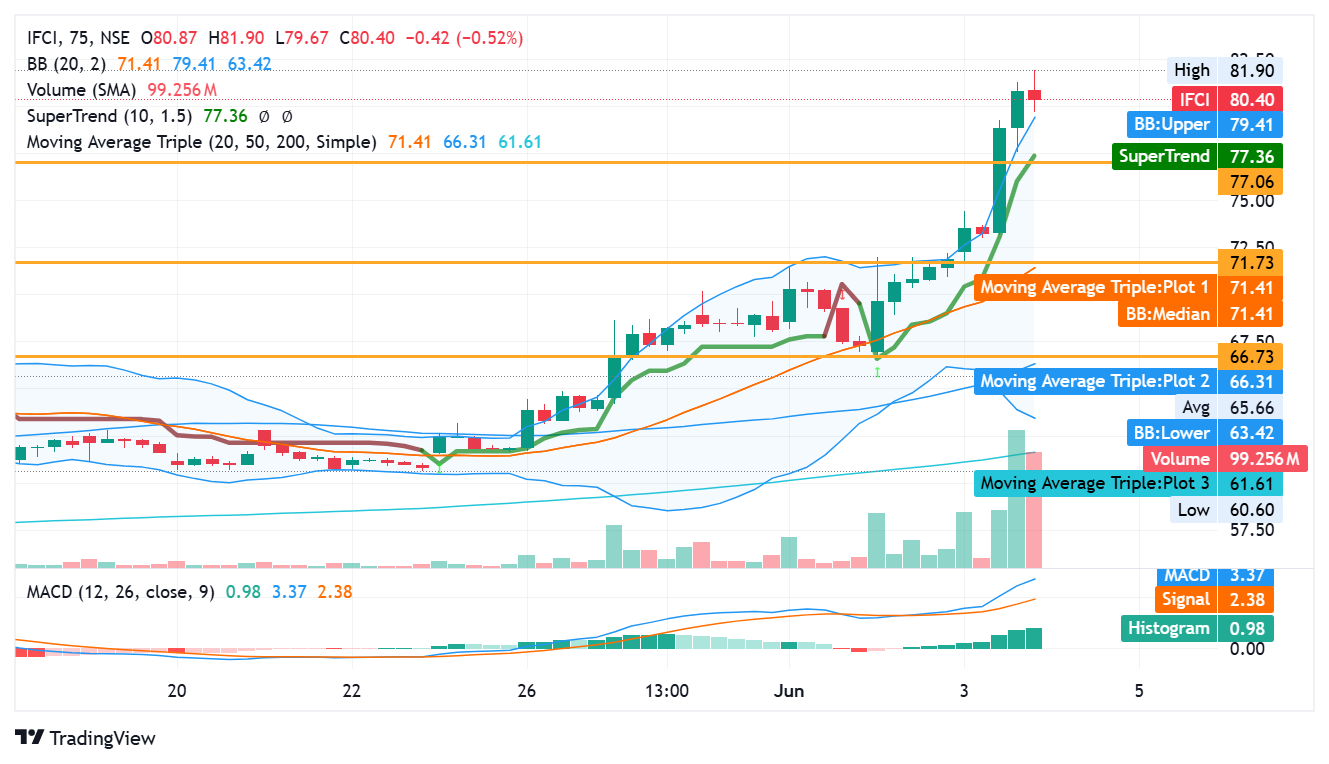
The latest chart structure of IFCI is showing a very strong bullish setup. Almost every major technical indicator is currently supporting the upward trend. This is one of the main reasons why traders have become highly active in the stock during the last few sessions.
The 75-minute chart clearly shows that buying momentum increased sharply after the stock crossed the important resistance area near ₹71–72.
Once that breakout happened, the stock moved very quickly toward the ₹80 zone with strong green candles and rising volumes. This type of price action usually indicates aggressive buying interest.
The speed of the rally also shows that sellers were unable to control the stock after the breakout.
Bollinger Bands Show Strong Expansion
One important indicator visible on the chart is the Bollinger Bands.
Currently, the upper Bollinger Band is near ₹79.41, while the middle band is around ₹71.41 and the lower band is near ₹63.42.
The stock price moved above the upper Bollinger Band during the rally. This usually happens when momentum becomes extremely strong.
In simple words, the stock moved so fast that it pushed beyond its normal trading range.
When Bollinger Bands start expanding after staying narrow for some time, it often signals the beginning of a strong directional move. That is exactly what appears to have happened in IFCI.
However, traders should also remember that stocks trading outside the upper Bollinger Band can sometimes become temporarily overextended. This does not automatically mean the trend will reverse, but it increases the possibility of short-term profit booking or sideways movement.
SuperTrend Indicator Remains Bullish
Another strong bullish signal on the chart comes from the SuperTrend indicator.
The SuperTrend level is currently near ₹77.36, while the stock price is trading above it.
In technical analysis, when the price remains above the SuperTrend line, the market is usually considered bullish.
The fact that IFCI is comfortably trading above this level suggests that buyers are still controlling the trend.
As long as the stock remains above the SuperTrend support area, traders may continue viewing the structure positively.
If the price starts closing below the SuperTrend line, then short-term weakness may begin to appear. But at the moment, the trend remains clearly bullish.
Moving Averages Are Giving Strong Confirmation
The chart also shows a very healthy moving average structure.
The 20-period moving average is around ₹71.41.
The 50-period moving average is near ₹66.31.
The 200-period moving average is around ₹61.61.
The most important point is that the smaller moving averages are positioned above the larger moving averages.
This means:
- The 20 MA is above the 50 MA
- The 50 MA is above the 200 MA
This structure is considered one of the strongest bullish signals in technical analysis.
It shows that:
- Short-term momentum is strong
- Medium-term trend is healthy
- Long-term trend is also positive
Many institutional traders and algorithmic systems closely monitor this type of alignment.
As long as this structure remains intact, the overall market trend is likely to remain positive.
MACD Indicator Also Supports the Rally
The MACD indicator is another important signal currently supporting the bullish view.
On the chart:
- MACD line is near 3.37
- Signal line is around 2.38
- Histogram is positive near 0.98
The MACD line is trading above the signal line, which is considered a bullish crossover.
At the same time, the positive histogram bars are expanding. This usually indicates increasing momentum.
In simple language, the MACD is telling traders that bullish strength is still growing.
This is important because momentum indicators often help traders understand whether the trend still has energy left or whether it is starting to weaken.
Right now, the indicator suggests momentum is still strong.
Price Action Shows Aggressive Buying
One of the clearest signs on the chart is the size of the recent green candles.
Large bullish candles generally indicate aggressive buying activity. They show that buyers were willing to purchase shares even at higher prices.
The rally from the ₹71 area toward ₹81 happened very quickly with very little hesitation. This suggests strong confidence among short-term market participants.
Another important observation is that every small dip during the rally was quickly bought.
This type of behavior is common during strong trending phases where traders are waiting for even small pullbacks to enter positions.
ALSO READ: NSE Market Activity Shows Mixed Trade Mood
Volume Expansion Confirms Participation
Volume is one of the most important factors in technical analysis.
The chart clearly shows that volume increased sharply during the breakout phase.
Large volume during a price breakout is usually considered a healthy signal because it confirms participation from a larger number of traders and investors.
If prices rise without strong volume, the rally may become weak or unreliable.
But in IFCI’s case, the volume expansion supports the strength of the move.
The traded volume crossed 3,200 lakh shares with traded value above ₹2,500 crore. This level of activity clearly shows that the stock has become one of the major focus areas for traders.
Resistance Near ₹91 May Become Important
Although the trend remains bullish, traders are already watching the next important resistance area.
The monthly resistance near ₹91.70 is now becoming a key level.
If the stock continues its upward momentum and crosses this area in the future, it could open the door for another major rally phase.
However, resistance zones are also areas where profit booking can increase sharply.
Many traders who entered at lower prices may choose to lock profits near resistance levels.
Therefore, investors should expect volatility to remain high as the stock approaches higher zones.
Important Support Zones Traders Are Watching
Even in strong bull markets, stocks do not move up every day.
Temporary corrections and pullbacks are completely normal.
Right now, the first major support zone remains near ₹71.73.
This area is important because it represents the recent breakout region and is also close to the 20-period moving average.
If IFCI remains above this level, the short-term trend is likely to stay positive.
The next major support is near ₹66.73.
This support zone becomes important if the stock experiences deeper profit booking.
Traders often watch these support areas carefully because strong stocks frequently bounce back from such levels during healthy uptrends.
Volatility Can Remain Extremely High
One important thing investors should understand is that IFCI remains a highly volatile stock.
The annualized volatility is already above 63%, which is considered very high.
This means sharp price swings can happen very quickly.
A stock that can rise 10–15% in a short time can also witness sudden corrections.
Therefore, traders should avoid emotional decisions and focus on proper risk management.
Strong trends can continue longer than expected, but volatility can also surprise market participants.
Overall Trend Still Favors Bulls
At the moment, almost every major technical signal is supporting the bullish case for IFCI.
The stock is:
- Trading above important moving averages
- Trading above the SuperTrend line
- Showing strong MACD momentum
- Breaking important resistance levels
- Witnessing strong volume participation
- Making fresh 52-week highs
All these factors together create a strong bullish technical structure.
However, after such a sharp rally, volatility and profit booking are natural possibilities.
For now, the trend remains strongly positive unless the stock starts falling below important support zones.
The coming sessions will be important because traders will closely watch whether IFCI can sustain above the breakout area and continue building momentum toward higher resistance levels.
Disclaimer
This article is meant only for educational and informational purposes. It should not be considered financial advice, investment advice, or a recommendation to buy or sell any stock.
Stock markets are subject to risks, and prices can move sharply in both directions. IFCI is a highly volatile small-cap stock, and investors should understand the risks before making any investment decisions.
Frequently Asked Questions (FAQs)
1. Why did IFCI shares rise so sharply today?
IFCI shares rallied sharply because several positive factors came together at the same time.
The biggest trigger appears to be the growing excitement around the expected NSE IPO theme and the market’s increasing focus on companies connected to India’s financial ecosystem.
Apart from this, strong technical momentum, breakout above important resistance levels, rising trading volumes, and bullish market sentiment also supported the rally.
The stock also touched a fresh 52-week high, which attracted momentum traders and short-term investors.
In simple words, the rally was driven by a combination of:
- Strong market sentiment
- Technical breakout
- High trading activity
- PSU stock interest
- Momentum buying
- NSE IPO-related optimism
2. Is IFCI still bullish after this big rally?
Technically, the stock still looks bullish at the moment.
Several indicators are supporting the positive trend:
- Price is trading above key moving averages
- SuperTrend indicator remains bullish
- MACD momentum is positive
- Volume participation remains strong
- The stock has broken major resistance zones
The moving average structure is especially strong because:
- 20 MA is above 50 MA
- 50 MA is above 200 MA
This alignment usually indicates a healthy bullish trend.
However, investors should also remember that no stock moves upward continuously. After a strong rally, temporary corrections and profit booking are normal.
The bullish structure may remain intact as long as important support zones continue to hold.
3. What are the important support and resistance levels for IFCI now?
Currently, traders are closely watching the following levels:
Important Resistance Levels
- ₹77.06 — Already crossed, now acting as support
- ₹91.70 — Next major monthly resistance zone
Important Support Levels
- ₹71.73 — First key short-term support
- ₹66.73 — Stronger support if deeper correction happens
If the stock sustains above the ₹77 zone, traders may continue expecting strength toward higher levels.
However, if the stock falls below important support zones, short-term weakness may increase.
These levels are important because traders use them to identify possible buying and selling areas.
4. Is IFCI a good stock for long-term investors?
That depends on the investor’s risk profile and investment strategy.
IFCI has delivered extremely strong returns over the last three years, with gains of more than 600%. This shows that the stock has already created significant wealth for investors who entered early.
The company is also benefiting from:
- Improved market sentiment
- PSU re-rating
- Financial sector interest
- Rising investor attention
However, IFCI is still considered a high-risk small-cap financial stock. Its price movements can be extremely volatile.
Long-term investors should therefore study:
- Company fundamentals
- Earnings quality
- Business growth
- Asset quality
- Debt position
- Future outlook
before making any investment decision.
Investors should avoid investing only because of short-term price movements.
5. Can IFCI continue rising further from current levels?
Yes, technically the stock can continue moving higher if bullish momentum remains strong.
Several factors are currently supporting the uptrend:
- Strong volume participation
- Fresh breakout structure
- Positive technical indicators
- Strong PSU market sentiment
- Momentum trading activity
The next major resistance near ₹91.70 may become an important target area if buying continues.
However, investors should also understand that after such sharp rallies, volatility often increases significantly.
Even during strong bull trends, temporary pullbacks and corrections are very common.
The key factor traders will watch is whether the stock can hold above important support levels while maintaining strong volume and momentum.
As long as the broader trend remains positive, traders may continue viewing dips as potential buying opportunities.
ALSO READ: Mangaluru Youth Loses Rs 5.3 Lakh in Online Trading Scam
DATA SOURCE: NSE INDIA