Bitcoin once again stands at a major turning point. After a huge rally that pushed the price above $120,000, the market suddenly changed direction. Fear returned fast. Heavy selling entered the market. Traders who once expected a move toward $150,000 now worry about a deep crash.
Many investors ask the same question today.
Will Bitcoin fall to $40,000?
This question now dominates the crypto market. Social media posts, trading groups, YouTube channels, and financial news outlets all focus on the same topic. Some analysts warn about another bear market. Others believe this drop is only a normal correction before the next rally.
The truth sits somewhere in the middle.
Bitcoin currently trades near one of the most important support zones of this cycle. The next few weeks may decide whether Bitcoin starts a fresh rally or enters a much deeper decline.
The charts show fear. The news adds pressure. Yet history tells a more balanced story.
This article explains the full situation in very simple English. We will study the technical charts, latest market news, investor sentiment, ETF flows, institutional activity, support levels, resistance zones, and the real chance of a move toward $40,000.
Bitcoin Faces Heavy Pressure
Bitcoin enjoyed one of its strongest rallies in history during the past cycle. Huge institutional demand entered the market after spot Bitcoin ETFs received approval. Big companies bought Bitcoin. Hedge funds joined the market. Retail traders returned with excitement.
The rally pushed Bitcoin above $120,000.
At that time, many traders believed the market would continue upward without major trouble. Optimism reached extreme levels. Every dip looked small. Every correction quickly recovered.
But markets never move in one direction forever.
After the huge rise came a sharp reversal. Bitcoin lost momentum. Buyers became weaker. Selling pressure increased. Profit booking started across the market.
Now Bitcoin trades close to the $60,000 area.
That decline shocked many investors because the fall happened quickly. Fear spread across the market within days.
Still, panic often appears near important support levels.
What the Monthly Chart Shows
The monthly chart gives the clearest picture of Bitcoin’s long-term trend.
The chart uses Bollinger Bands, which help traders understand volatility and price extremes.
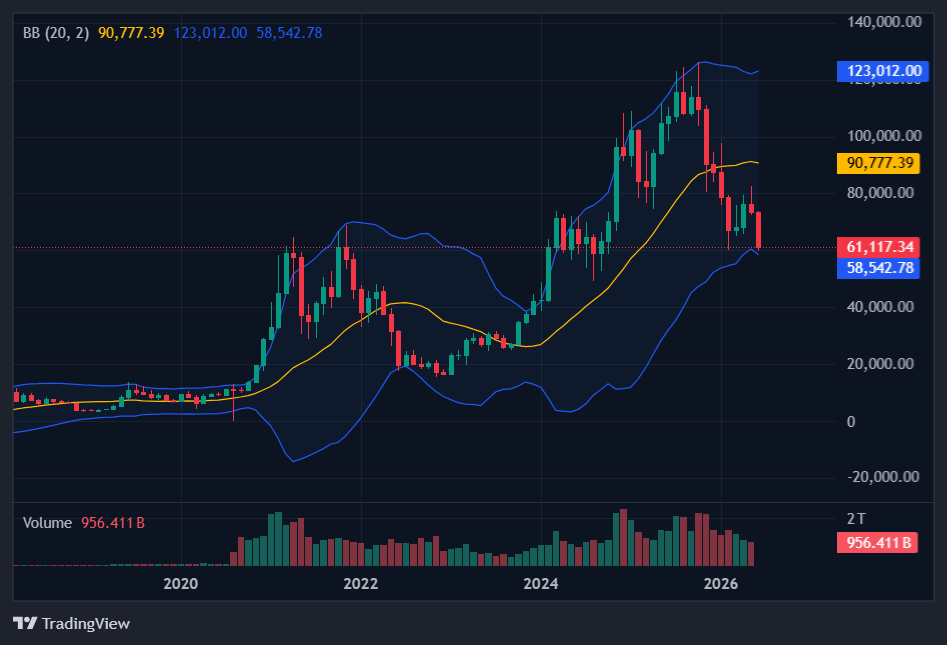
The data from the chart shows:
Upper Bollinger Band near $123,012
Middle Bollinger Band near $90,777
Lower Bollinger Band near $58,542
Current Bitcoin price near $61,000
This information matters a lot.
Bitcoin now trades close to the lower Bollinger Band. In past market cycles, Bitcoin often touched this area during strong corrections.
That does not automatically mean a crash will happen.
In many cases, Bitcoin found support near the lower Bollinger Band before another rally started.
This zone near $58,000 to $62,000 now acts as a key support area.
If buyers defend this region, Bitcoin may recover toward higher levels again.
But if sellers break this support with strong momentum, the market could enter a larger decline.
That is why traders closely watch every weekly and monthly candle.
Why the $60,000 Zone Matters
The current support zone contains several strong technical signals at the same time.
This creates a major battlefield between buyers and sellers.
The lower monthly Bollinger Band sits near this region.
The 200-week moving average also stands near this area.
Past breakout levels from earlier rallies remain close as well.
Psychological support near round numbers like $60,000 also attracts attention from traders and institutions.
When several support indicators gather in one place, markets usually react strongly.
That is exactly what happens now.
Large trading volume appears around this level because both bulls and bears understand its importance.
If Bitcoin holds above this zone, confidence may slowly return.
If Bitcoin falls below it, panic could spread much faster.
Weekly Chart Signals Turn Bearish
The weekly chart shows more short-term weakness.
Bitcoin now trades below many major moving averages.
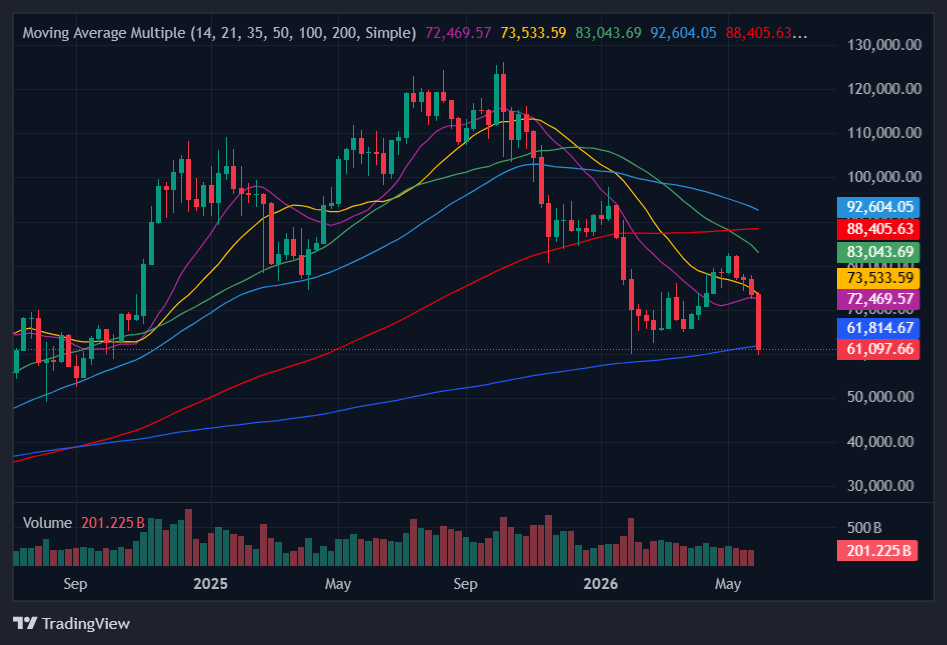
The chart data shows:
14-week moving average near $72,469
21-week moving average near $73,534
35-week moving average near $83,043
50-week moving average near $92,604
100-week moving average near $88,405
200-week moving average near $61,815
Bitcoin currently trades under almost all these averages.
That usually signals weakness in market momentum.
Short-term traders often sell when price falls below major moving averages. Algorithmic systems also react to these breaks.
This creates additional pressure.
Still, one level remains extremely important.
The 200-week moving average.
The Importance of the 200-Week Moving Average
The 200-week moving average has huge importance in Bitcoin history.
During earlier bear markets, Bitcoin often found strong support near this indicator.
This happened in:
2015
2018
2022
Each time, fear reached extreme levels before Bitcoin eventually recovered.
Now Bitcoin again trades near the same historical support.
That does not guarantee a bounce.
But it does show that Bitcoin has reached an area where long-term investors often become interested.
Many institutions watch this indicator carefully because it helps identify long-term value zones.
If Bitcoin stays above the 200-week moving average, long-term market structure may remain healthy.
If Bitcoin closes below it for several weeks, bearish pressure may become much stronger.
Could Bitcoin Really Fall to $40,000?
Yes, it is possible.
But traders must understand that possibility does not mean certainty.
For Bitcoin to reach $40,000, several bearish conditions would likely need to happen together.
The first requirement would be a clear breakdown below the $58,000 support zone.
After that, Bitcoin may target:
$54,000
$50,000
$46,000
$42,000
Then possibly $40,000
Each lower support area may slow the decline.
Markets rarely move in straight lines.
Even during bear markets, sharp relief rallies often appear.
That means a move toward $40,000 would probably include many violent swings along the way.
What Could Cause a Bigger Crash?
Several market conditions may push Bitcoin lower.
One major factor involves ETF flows.
Spot Bitcoin ETFs became one of the strongest drivers of the recent rally. Huge institutional demand entered the market through these investment products.
Now the situation looks different.
Recent reports show large ETF outflows from crypto investment products. Billions of dollars left the market in recent weeks.
When money exits ETFs, selling pressure increases.
This weakens market confidence.
Another factor comes from global financial conditions.
High interest rates often hurt risky assets like crypto. Investors become more careful during uncertain economic periods.
If recession fears grow stronger, many traders may reduce exposure to volatile assets such as Bitcoin.
That could create another wave of selling.
AI Stocks Now Attract More Money
Another important market trend now affects Bitcoin.
Investors recently shifted large amounts of money into artificial intelligence companies and technology stocks.
AI became one of the hottest sectors in global markets.
Major tech companies continue to attract massive capital flows. Semiconductor stocks and AI-related firms now dominate investor attention.
Because of this shift, some money that once entered crypto now moves toward AI investments instead.
This does not mean Bitcoin lost importance forever.
Markets often rotate between sectors.
At one time crypto leads. At another time technology stocks dominate.
Right now AI attracts stronger momentum.
That weakens Bitcoin demand in the short term.
Strategy Sale Shocked Investors
Another major event recently affected market psychology.
Strategy, previously known as MicroStrategy, sold a small amount of Bitcoin.
This surprised many investors because the company and its founder Michael Saylor strongly supported a long-term “never sell” message for years.
The sale itself was small compared to total holdings.
But perception matters a lot in crypto markets.
Many traders saw this move as a warning sign.
Fear increased quickly after the news spread.
Sometimes market sentiment changes more from psychology than actual fundamentals.
That appears true in this situation.
Analysts Strongly Disagree
Current Bitcoin predictions vary widely.
Some analysts expect a crash toward $40,000 or lower.
Others still believe Bitcoin may eventually return toward $100,000 or beyond.
This disagreement shows how uncertain the market currently feels.
No analyst knows the exact future direction.
Charts help traders understand probabilities, not guarantees.
Many bearish analysts focus on broken moving averages and ETF outflows.
Bullish analysts focus on long-term adoption, limited supply, and historical recovery patterns.
Both sides present valid arguments.
Bitcoin Supply Still Remains Limited
Despite recent weakness, Bitcoin fundamentals still remain strong in several areas.
Bitcoin supply remains fixed at 21 million coins.
No government or central bank can create more Bitcoin.
That scarcity remains one of Bitcoin’s strongest long-term advantages.
The recent halving event also reduced the amount of new Bitcoin entering circulation.
Historically, Bitcoin often experienced large rallies after halving cycles, although those rallies did not happen immediately every time.
Limited supply combined with long-term demand still creates strong support for Bitcoin’s future value.
Institutional Adoption Continues
Even after recent selling pressure, institutional involvement in Bitcoin remains much stronger than earlier cycles.
Large financial firms now offer Bitcoin exposure.
Spot Bitcoin ETFs still hold huge amounts of BTC.
Major asset managers continue to study crypto investment opportunities.
Corporate treasury interest also remains alive.
This creates a very different environment compared to older bear markets.
Years ago, Bitcoin depended heavily on retail traders.
Now institutions play a much larger role.
That changes market behavior.
Institutional investors often think in longer timeframes than retail traders.
Because of this, large corrections do not always destroy long-term trends.
Fear Dominates the Market Again
Crypto markets often move through emotional cycles.
Excitement appears near tops.
Fear appears near bottoms.
Right now fear dominates sentiment once again.
Many traders who bought near all-time highs now face large losses.
Social media sentiment turned negative.
Bearish headlines spread quickly across financial websites.
This emotional environment often creates very volatile conditions.
Sharp selloffs become common.
At the same time, sudden relief rallies may also appear without warning.
That is why traders must avoid emotional decisions during periods of panic.
History Shows Bitcoin Often Recovers
Bitcoin history contains many major crashes.
In past cycles, Bitcoin experienced declines of:
50%
60%
70%
Even more in some cases.
Yet after many deep corrections, Bitcoin eventually recovered and reached new highs.
That does not guarantee future success.
But it reminds investors that volatility remains part of Bitcoin’s nature.
Every cycle creates fear that Bitcoin will never recover.
Every cycle also creates periods where optimism becomes excessive.
The current market may simply represent another stage of that long-term pattern.
What Bulls Need to See
Bullish traders now need several positive developments.
Bitcoin must defend the $58,000 to $62,000 support zone.
The market also needs stronger buying volume.
ETF inflows would help improve confidence again.
Bitcoin should eventually recover above the short-term moving averages near $72,000 and $73,000.
A move back above $90,000 would strongly improve long-term sentiment.
That would place Bitcoin above the monthly Bollinger Band middle line once again.
Until then, bulls still face challenges.
What Bears Want
Bearish traders want the opposite outcome.
They want Bitcoin to break below major support.
Strong weekly closes under the 200-week moving average may trigger more panic selling.
If ETF outflows continue and macroeconomic conditions worsen, bears may gain stronger control over the market.
In that situation, lower targets near $50,000 or even $40,000 may become realistic.
Still, bears also face risks because Bitcoin often produces violent short squeezes after large selloffs.
The Real Truth About the Market
The truth about Bitcoin today is simple.
The market sits at a major decision point.
Neither side has complete control.
The charts show weakness.
But the charts also show major historical support.
The news creates fear.
Yet long-term adoption continues.
Some traders panic.
Others quietly accumulate.
This creates a highly emotional and uncertain environment.
That uncertainty explains why opinions vary so widely right now.
Is Bitcoin Dead?
Many people ask this question during every major correction.
History shows that Bitcoin survived many earlier crashes.
Bitcoin survived exchange collapses, government bans, massive selloffs, and deep bear markets.
The current correction feels painful because emotions always become stronger during declines.
But Bitcoin still remains the largest cryptocurrency in the world.
Institutional participation remains active.
Global awareness continues to grow.
That does not guarantee endless price increases.
But it does show that Bitcoin still holds strong relevance in modern finance.
What Long-Term Investors Watch
Long-term investors usually focus less on daily price swings.
Instead, they watch broader trends such as:
Institutional adoption
Supply scarcity
Network strength
Global liquidity
Macroeconomic conditions
Regulatory developments
These factors often shape Bitcoin’s direction over many years.
Short-term price action may look chaotic.
Long-term trends usually develop more slowly.
Final Verdict
Bitcoin currently stands near one of the most important support zones of this entire cycle.
The area between $58,000 and $62,000 now acts as the key battlefield for the market.
The monthly Bollinger Band support and the 200-week moving average both sit near this region.
That gives bulls an important defense zone.
At the same time, Bitcoin remains below many short-term moving averages, which shows clear weakness in momentum.
ETF outflows, rising fear, and investor focus on AI stocks also create pressure on crypto markets.
Could Bitcoin fall to $40,000?
Yes, it remains possible if major support breaks and bearish conditions become stronger.
But current charts do not yet confirm a collapse.
Bitcoin still holds above one of the strongest historical support levels in its history.
That means the market may still recover if buyers regain confidence.
Right now the market waits for confirmation.
The next major move may decide Bitcoin’s direction for the rest of the cycle.
One thing remains certain.
The battle around $60,000 will likely shape Bitcoin’s future in the months ahead.
Also Read – So What if Rupee Touches 100 to A Dollar?