
The PSU Bank Index has shown a very strong price recovery over the last few weeks. Current chart structure suggests that the market remains in a bullish phase, with price action now close to an important resistance zone near 8,761. The overall setup reflects a healthy trend reversal after a prolonged correction phase. Momentum indicators, price structure, and wave formation together support a positive medium-term outlook.
At present, the index closed near 8,713 after a gain of almost 150 points during the latest trading session. This marks a daily rise of nearly 1.75 percent. The move has come with strong market participation, with total traded volume reported near 418 million shares. Higher price movement with strong volume usually reflects broad market confidence, which often supports trend continuation.
The present chart setup suggests that the market may remain strong over the coming sessions. However, since price now trades close to an established resistance area, traders should also watch for short-term price correction before the next upward move begins.
Current Price Structure Suggests Trend Reversal
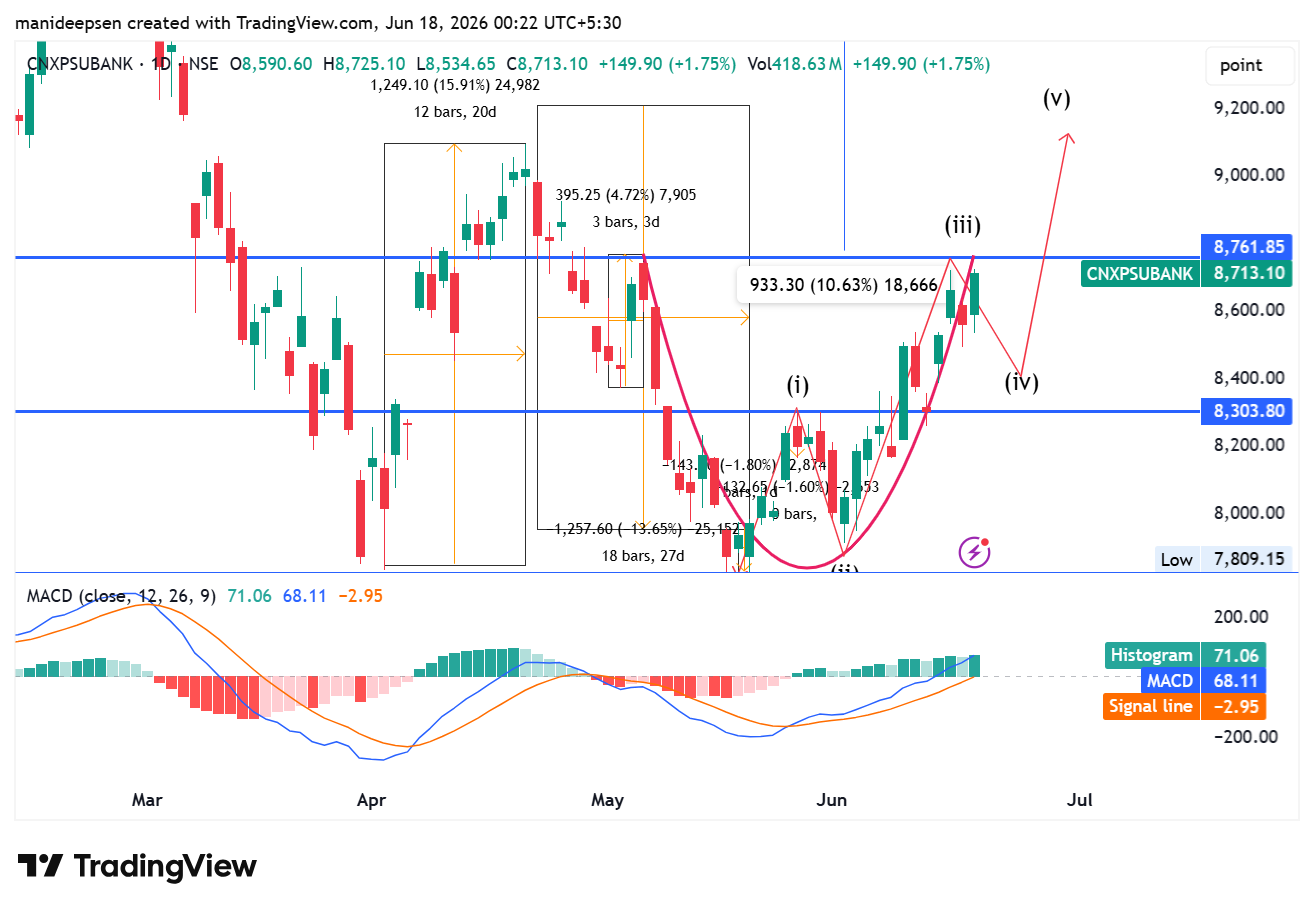
The chart clearly shows that the PSU Bank Index has completed a major corrective phase and has entered a fresh upward cycle. Earlier, the index moved downward from the 9,000 region and reached a low near 7,809. After this decline, price began to stabilize and slowly built a strong base.
Once the base formation completed, buyers returned to the market and pushed price upward. This upward move has now developed into a structured rally, where price continues to form higher lows followed by higher highs. In technical analysis, this pattern often reflects a shift from a bearish phase into a bullish phase.
The latest move has brought price back near earlier resistance zones, which means the market now stands at an important decision area.
Wave Structure Shows Healthy Bullish Development
The chart follows a visible Elliott Wave structure. Current market movement appears to fit a five-wave impulsive sequence, which often forms during strong bullish cycles.
The first upward leg, marked as Wave One, began after price reversal near the 7,800 region. After this rise, the market saw a short corrective phase known as Wave Two. This correction remained controlled and did not damage the larger structure.
After completion of this correction, the market entered Wave Three. This wave usually carries the strongest momentum in Elliott Wave theory. Current price action strongly supports the idea that Wave Three remains active.
A key characteristic of Wave Three is that it often extends beyond the size of Wave One. The present chart shows exactly this pattern. Current upward movement has already exceeded the earlier advance in both strength and momentum.
This creates a strong probability that institutional buyers remain active in the market.
Resistance Near 8,761 Remains Important
One of the most important observations on the chart is the resistance zone near 8,761. Price has now reached this level after a steady upward move over the last several sessions.
This resistance area has historical importance because earlier market rejection took place near the same zone. Whenever price returns to a previous rejection point, market participants closely watch buyer strength.
If the index closes decisively above 8,761, it may confirm fresh breakout strength. In such a case, the market may continue toward higher zones near 8,950, followed by possible extension toward 9,100 and 9,250.
If price fails near this level, the market may pause for short-term correction before the larger trend resumes.
Support Zone Near 8,303 Acts as Key Demand Area
The chart also highlights an important support zone near 8,303. This level now acts as the strongest near-term demand region.
Earlier consolidation developed around this area before the latest upward move started. When markets break above consolidation zones, these same areas often turn into future support.
If the index faces short-term weakness, buyers may return near this zone. Price stability near 8,300 would support continuation of the bullish structure.
However, a clean breakdown below 8,300 may weaken the present setup and force traders to reassess the broader trend.
At present, this support remains structurally important.
MACD Indicator Confirms Positive Momentum
Momentum study through the MACD indicator provides strong confirmation for the current bullish structure.
The MACD line now stands near 68.11 while the histogram value stands near 71.06. The signal line remains lower, near negative 2.95. This relationship confirms strong positive momentum.
A bullish crossover had already occurred earlier, where the MACD line crossed above the signal line. After this crossover, the histogram turned positive and continues to expand.
When histogram bars continue to rise while price moves upward, it usually reflects healthy momentum expansion. This means buyers continue to dominate market activity.
At present, there is no major sign of momentum weakness.
Time Cycle Study Supports Continuation
The chart also shows measured move comparison from previous price cycles.
An earlier rally phase lasted around 12 trading sessions and delivered price expansion of nearly 15.91 percent. After completion of that move, the market entered correction mode.
That corrective phase lasted close to 18 sessions and price fell nearly 13.65 percent.
The current upward move now shows similar time symmetry. Present price structure has developed over approximately 18 sessions, and market volume has also expanded significantly during this phase.
In technical market study, repeated time symmetry often suggests price respects historical rhythm.
Based on this structure, the current move may continue for several more sessions before exhaustion appears.
Probability of Short-Term Correction Exists
Although the larger trend remains bullish, short-term caution remains necessary.
Price has moved sharply higher over a relatively short period. Markets rarely move upward in a straight line for extended periods.
Since current price stands directly below major resistance, some profit booking may appear.
This may create a temporary pullback phase. Based on present chart structure, the correction may take price toward the 8,450 zone.
If weakness becomes slightly deeper, price may revisit the stronger support region near 8,300.
Such correction would not damage the larger bullish structure unless a breakdown occurs below key support.
At present, any moderate pullback may simply represent a pause rather than trend reversal.
Volume Pattern Supports Market Strength
Volume behavior remains another positive factor.
The latest session recorded nearly 418 million traded shares. Price closed strong and volume remained elevated.
When price rises together with volume expansion, market analysts often interpret this as genuine buyer participation.
This differs from short covering rallies, where price rises but volume remains weak.
The current setup suggests broad participation from buyers rather than temporary speculative movement.
This increases confidence in the present trend structure.
If future sessions show rising price with falling volume, that may indicate exhaustion.
At present, no such weakness appears.
Price Projection for Coming Sessions
Based on current technical structure, three possible market scenarios exist over the next few weeks.
The highest probability scenario suggests breakout continuation above resistance near 8,761. If this happens, price may gradually move toward 8,950 first, then attempt higher movement near 9,100 and eventually 9,250.
The second scenario assumes price rejection near resistance. In this case, the market may correct toward the 8,300 region before buyers return again.
The lowest probability scenario assumes breakdown below 8,300 support. Such movement would weaken the current bullish setup and may pull price toward 8,000 or even lower levels.
At present, the first scenario carries the highest probability.
Institutional Interpretation of Current Structure
The current price structure suggests strong participation from larger market participants.
The PSU banking sector appears to attract fresh capital after a long corrective period. Sector leaders such as public sector banks often lead this type of movement.
When institutional participants begin accumulation, price structure usually shows strong upward waves, stable corrections, and expanding volume.
The current chart reflects all three conditions.
This increases confidence that the present rally has structural support.
Risk Factors Investors Should Observe
Despite the positive outlook, several risks remain.
The first risk comes from failure near resistance around 8,761. If price repeatedly rejects from this area, short-term weakness may develop.
The second risk comes from loss of support near 8,303. If price closes below this level, market structure may weaken significantly.
The third risk comes from momentum slowdown. If MACD histogram starts declining while price continues upward, hidden weakness may begin to form.
At present, none of these risks have fully developed, but close observation remains necessary.
Final Market Assessment
The PSU Bank Index currently presents one of the stronger sectoral structures in the market.
Price action shows a healthy reversal after earlier correction. Elliott Wave structure suggests active bullish expansion. MACD confirms strong positive momentum. Volume remains supportive and no major weakness has appeared so far.
Current resistance near 8,761 may create temporary hesitation, but overall structure remains positive unless price falls below 8,300.
If breakout strength appears above resistance, the market may attempt movement toward the 9,100 to 9,250 region over the coming weeks.
From a pure technical perspective, the index currently remains in a favorable medium-term bullish phase with constructive market structure and strong momentum support.
The overall technical outlook therefore remains positive.
Disclaimer
This report reflects technical chart observations based on historical price action, momentum indicators, and market structure visible at the time of analysis. The study does not guarantee future price movement and should not be treated as investment advice, financial recommendation, or a promise of returns. Market conditions may change without warning, and readers should conduct independent research or consult a qualified financial advisor before making any trading or investment decision.
Frequently Asked Questions
1. Why is the PSU Bank Index currently bullish?
The index shows a strong upward price structure after a major correction. Higher highs and higher lows usually reflect buyer strength, which supports a bullish view.
2. Why is the 8,761 level so important?
This level acts as a major resistance zone because earlier price rejection happened near the same area. A breakout above this level may open room for fresh upside.
3. What does the 8,303 support zone indicate?
The 8,303 region acts as an important demand area where buyers previously entered the market. Price stability above this zone keeps the bullish structure intact.
4. What does the MACD indicator show right now?
MACD currently shows positive momentum. The indicator suggests that buyers still control market movement and trend strength remains healthy.
5. Can the index move above 9,000 soon?
If price closes strongly above 8,761 resistance, the probability of a move toward 9,000 and higher levels may increase significantly.
6. Is a short-term correction possible from current levels?
Yes. Since price has moved sharply upward in recent sessions, temporary correction or profit booking may happen before the next major move.
7. Why does volume matter in this analysis?
Strong volume during price rise usually shows genuine buyer participation. This often gives more confidence that the trend has support.
8. What happens if price falls below 8,300?
A breakdown below 8,300 may weaken the current bullish setup and could signal deeper correction toward lower support levels.
9. What does Elliott Wave structure suggest here?
The current structure suggests the market remains in a bullish expansion phase, with Wave Three or early Wave Four visible in the present cycle.
10. What is the broader outlook for PSU Bank stocks?
Based on present technical structure, the sector appears relatively strong. If momentum remains healthy, the index may continue its upward path over the medium term.
ALSO READ: Nifty India Defence Index Shows Strong Bullish Trend