
Tanla Platforms Ltd has built its business around enterprise communication technology. In simple terms, the company helps businesses communicate with customers through digital channels such as SMS alerts, OTP verification systems, cloud communication APIs, WhatsApp communication systems, and secure messaging infrastructure.
Whenever a bank sends an OTP, an e-commerce company sends order updates, or a digital platform sends account verification messages, companies like Tanla often operate in the background.
This business model has become important because digital communication has become a basic requirement for modern businesses. As more companies move online, the demand for communication infrastructure continues to rise.
The company has spent years building relationships with telecom operators and enterprise clients. This gives Tanla an important position inside India’s fast-growing digital ecosystem.
The sector itself carries long-term potential because customer communication volume continues to rise every year.
Revenue Growth Shows Business Expansion Continues
Revenue growth usually helps analysts understand whether a company continues to expand its business.
For financial year 2026, Tanla reported revenue of ₹4,418 crore.
This represents approximately 9.7 percent year-on-year growth compared with the previous period.
At first glance, revenue growth remains positive. The company continues to generate more business than earlier years. This shows demand for its services remains healthy.
However, deeper analysis tells a more balanced story.
Technology companies often receive higher market valuations when growth stays very strong. Investors generally expect faster expansion from companies operating in digital infrastructure businesses.
In Tanla’s case, revenue growth remains positive, but pace has slowed compared with earlier periods when the company showed much stronger expansion.
This slowdown does not automatically create concern, but it does show business momentum has become more moderate.
For market participants, the main question now becomes simple.
Can Tanla return to stronger growth levels in future years?
The answer to that question may shape long-term market sentiment toward the company.
Profitability Remains Healthy But Pressure Has Started To Appear
Revenue alone never gives the full picture.
Analysts also examine profitability because this shows how efficiently management converts business activity into earnings.
Tanla reported EBITDA of ₹724 crore during FY26.
EBITDA margin stood near 16.4 percent.
Net profit remained close to ₹509 crore.
These numbers confirm one positive fact.
The company continues to remain profitable at healthy levels.
The concern, however, comes from margin pressure.
Earlier financial periods showed stronger profitability margins. Recent financial data now shows margins have started to contract.
When margins begin to decline, analysts usually examine possible causes carefully.
Sometimes cost structure rises.
Sometimes competitive pressure increases.
Sometimes pricing power weakens.
At this stage, Tanla still remains profitable, but the margin trend deserves attention because sustained pressure can eventually affect overall earnings growth.
Profitability remains strong today, but future quarters may reveal whether this trend continues.
Earnings Growth Has Lost Earlier Momentum
Another important measure in fundamental analysis is earnings per share, often called EPS.
EPS helps investors understand how much profit the company generates on a per-share basis.
Tanla reported FY26 EPS of ₹38.36.
The previous financial year reported EPS of ₹37.76.
The increase remains positive, but growth has clearly slowed.
This is important because market valuations often depend heavily on earnings growth expectations.
When a company grows earnings rapidly, investors usually assign higher confidence levels.
When earnings growth slows, market excitement often declines.
Tanla now falls into a phase where earnings remain stable, but acceleration has reduced significantly.
This does not mean the company has become weak.
It simply means growth has become slower than earlier market expectations.
That difference often affects stock valuation.
The Balance Sheet Remains One Of Tanla’s Strongest Areas
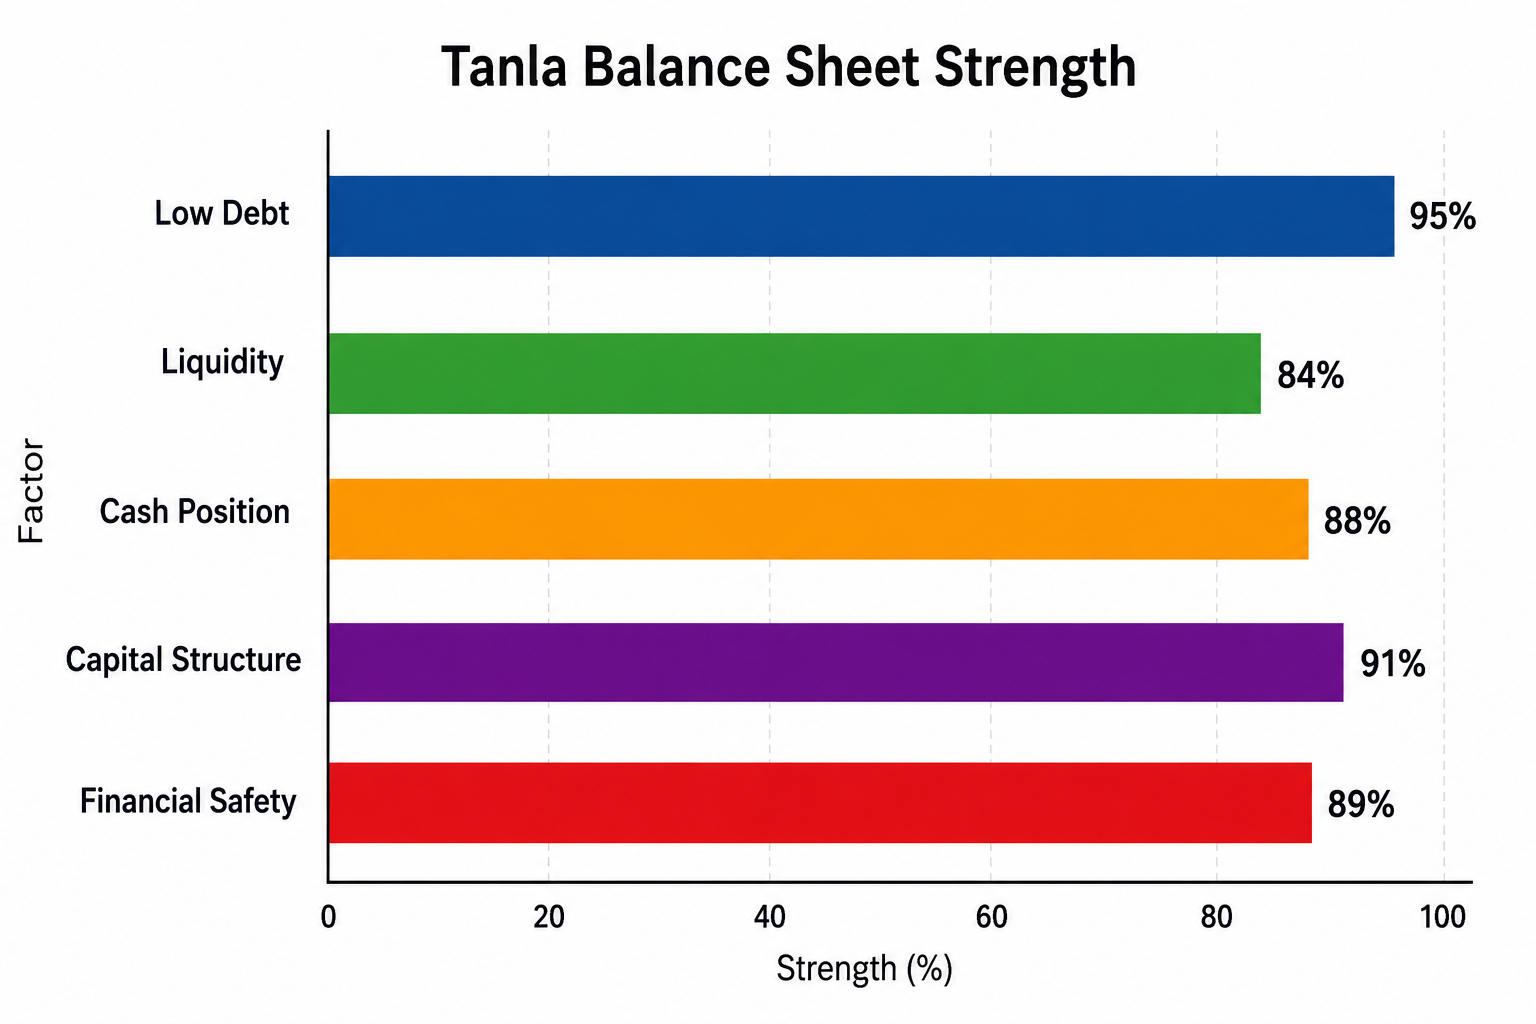
Balance sheet strength often separates strong businesses from weaker businesses.
Tanla performs very well in this area.
The company historically operates with very low debt, which immediately improves financial quality.
Low debt creates several advantages.
First, the company faces lower financial risk during difficult economic periods.
Second, management gains flexibility because there is little pressure from heavy interest payments.
Third, profit quality often remains cleaner when debt burden stays low.
Many technology businesses borrow heavily during expansion phases.
Tanla has avoided this problem.
This balance sheet structure gives investors additional confidence because the company does not depend heavily on borrowed capital to sustain operations.
Financial stability remains one of the company’s strongest positives today.
Business Position Inside The Industry Remains Strong
Tanla operates inside the CPaaS industry, also called Communication Platform as a Service.
This sector has become highly important because businesses now depend heavily on digital communication systems.
Within India, Tanla holds a strong position because it has built telecom partnerships over several years.
Such partnerships often create barriers for competitors.
New entrants may find it difficult to build relationships with telecom operators quickly.
This gives Tanla an operational advantage.
The company also focuses on enterprise communication infrastructure rather than simple SMS routing services.
This distinction matters because higher-value technology products often create stronger long-term margins.
Its role inside India’s enterprise communication ecosystem remains one of the company’s biggest strengths.
From a business quality perspective, the company continues to hold an important market position.
ALSO READ: 5 F&O Stocks Near Ban Zone Traders Must Watch
Sector Outlook Supports Long Term Opportunity
A company’s future often depends not only on management but also on industry growth itself.
Tanla operates in a sector where long-term demand trends remain positive.
Every year more businesses shift customer interaction toward digital channels.
Banking systems rely on OTP authentication.
E-commerce platforms depend on transaction alerts.
Fintech companies require secure customer verification systems.
Businesses now communicate with customers through mobile-first digital systems more than ever before.
Because of this shift, communication infrastructure demand continues to expand globally.
This broader industry trend creates long-term opportunity for companies operating inside this space.
Tanla benefits directly from this larger market transformation.
The company does not operate in a declining sector.
Instead, it remains part of an industry that still offers future expansion potential.
For long-term investors, this remains an important positive factor.
The Bigger Fundamental Picture So Far
The first half of Tanla’s financial picture presents a balanced story.
The company operates in a strong sector with long-term demand potential.
Revenue continues to grow, though pace has slowed compared with earlier years.
Profitability remains healthy, but margin pressure has started to appear.
Earnings growth remains positive, although expansion has become modest.
Balance sheet strength remains excellent because debt levels stay low.
Business positioning inside India’s communication infrastructure market remains solid.
At this stage, Tanla still qualifies as a fundamentally strong business.
The bigger question no longer focuses on survival.
The real question now focuses on future growth speed.
That answer will determine whether the company enters another strong expansion cycle or remains in a slower growth phase for the near future.
Tanla Faces a Crucial Price Zone After Recent Recovery
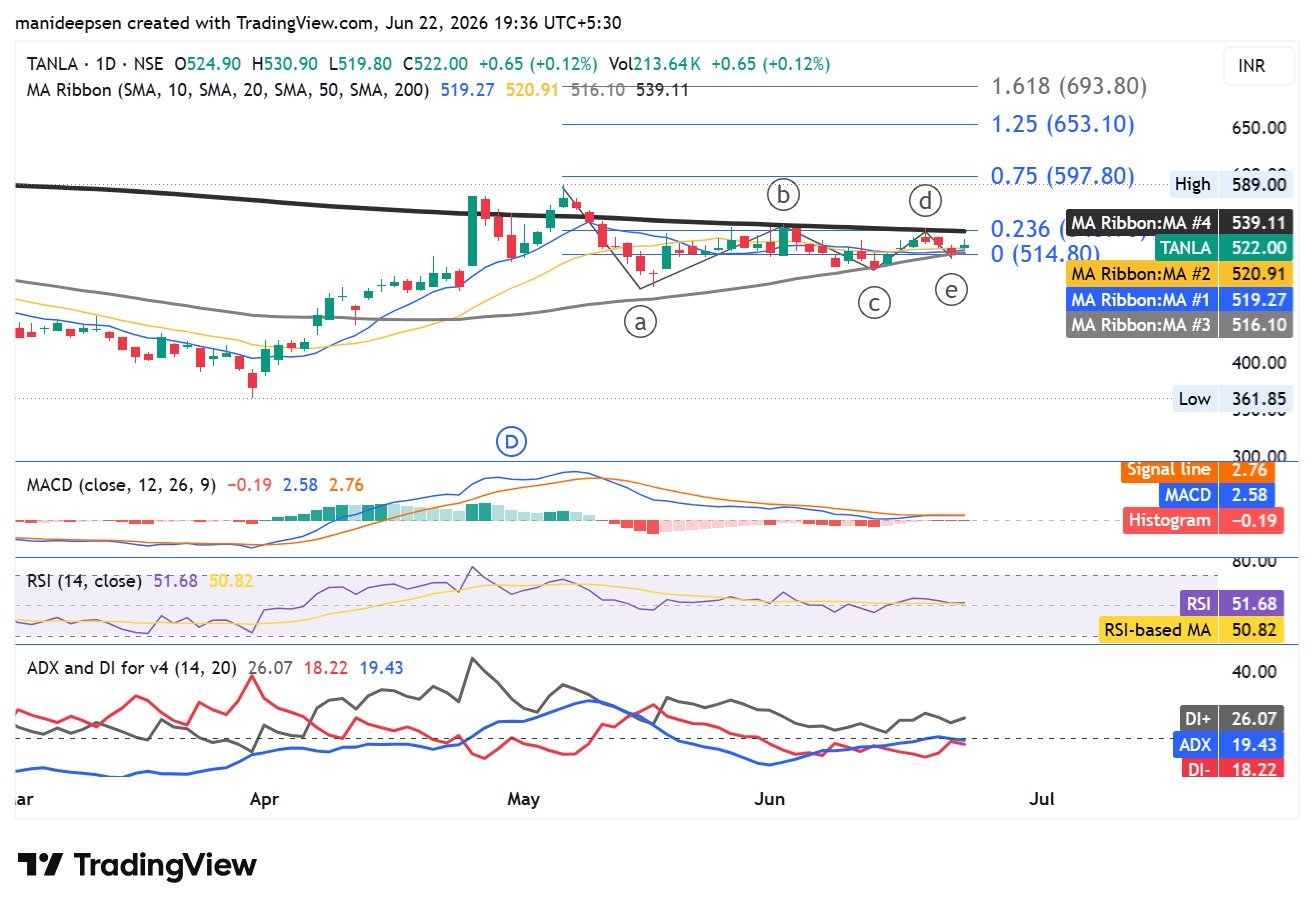
Tanla Platforms now trades at ₹522 after a phase of recovery that started several weeks ago. The stock had shown strength after a sharp rise from lower levels, but recent price action now shows hesitation near an important resistance area. This stage often becomes important because it helps traders understand whether buyers still hold control or whether sellers may return.
The broader structure on the daily chart shows a market that has moved upward earlier but has now entered a tight consolidation range. Such phases often come before a large move, but direction remains uncertain until price clearly moves outside the current range.
Price Structure Shows A Wait And Watch Situation
The stock has spent the last several sessions inside a narrow zone after a strong upward move in April and early May. Earlier momentum pushed price sharply higher, but that pace has now slowed near an overhead barrier.
The current structure resembles a compression pattern where price moves inside narrowing boundaries. This usually shows that market participants have become cautious. Buyers no longer push aggressively, while sellers have also failed to force a sharp decline.
At this stage, the market has not offered confirmation for the next trend. Because of that, traders usually wait for a clear breakout rather than assume direction too early.
Moving Average Setup Supports Short Term Strength
The moving average structure offers an interesting picture. Tanla now trades above the 10-day, 20-day, and 50-day moving averages. This normally suggests short-term strength remains intact.
The 10-day moving average sits near ₹519, while the 20-day average stands close to ₹520. The 50-day average remains lower near ₹516. Price above these levels often shows buyers still defend near-term support zones.
However, one major barrier remains above current price. The 200-day moving average stands near ₹539. This level carries importance because many market participants use it as a signal for long-term trend direction.
As long as price stays below this area, long-term trend recovery remains incomplete.
Resistance Zone Near ₹539 Holds Major Importance
The most important level on the chart now sits near ₹535 to ₹540. This area combines multiple technical factors, which makes it a strong resistance zone.
The 200-day moving average lies in this range. Fibonacci retracement data also places an important level near the same zone. Earlier price candles have already shown rejection near this area.
When multiple technical signals appear together, traders usually treat that zone with greater caution.
If price manages a daily close above ₹540 with stronger volume, market confidence may improve sharply. A successful breakout may open space toward higher levels near ₹560 and later around ₹598.
Support Zones Continue To Protect Near Term Trend
The nearest support area remains around ₹514 to ₹518. This range holds importance because short-term moving averages also sit close to this zone.
If price stays above this level, buyers still maintain near-term control.
A second important support zone exists near ₹500. This level often acts as a psychological price barrier where market participants usually react more actively.
Below that, the stronger technical support stands near ₹485. If price falls under this region, bearish pressure may rise significantly and market sentiment could weaken further.
Because of this structure, downside risk remains controlled for now, but traders must watch these levels closely.
Momentum Data Shows Strength Has Slowed
MACD indicators suggest momentum has weakened compared with previous weeks. The MACD line now sits at 2.58 while the signal line remains slightly higher at 2.76.
The histogram has moved into negative territory at minus 0.19.
This setup usually shows that earlier upward momentum has lost speed. It does not confirm bearish reversal by itself, but it does suggest buyers have become less aggressive.
Momentum indicators often help traders understand speed rather than direction alone. In this case, speed has clearly slowed.
RSI Shows Neutral Market Conditions
The Relative Strength Index now stands near 51.68.
This value places the stock in neutral territory. The indicator remains above the 50 level, which suggests slight bullish preference, but strength remains limited.
If RSI had moved much higher, it would suggest stronger demand. If it had dropped sharply below 50, bearish pressure would become more visible.
At present, RSI suggests the market has entered a balanced phase where neither side has complete control.
ADX Data Suggests Trend Lacks Strong Conviction
Trend strength indicators also support the idea of a cautious market.
The DI+ value stands at 26.07 while DI- remains lower at 18.22. This usually suggests buyers still maintain slight control over sellers.
However, the ADX value stands near 19.43.
ADX below 20 often suggests weak trend strength. In simple terms, market direction exists, but conviction remains limited.
This means buyers still hold advantage, but strength behind the move does not look powerful enough to confirm a major trend continuation.
Market Waits For A Confirmed Breakout
The chart now presents two possible scenarios.
If Tanla closes strongly above ₹540 with stronger volume participation, the market may shift into a fresh bullish phase. In that case, price may attempt a move toward ₹560 first and later approach ₹598.
On the other hand, if price drops below ₹514, market weakness may become visible. That may pull price toward ₹500 first, followed by deeper support near ₹485.
The current setup does not support aggressive positioning before confirmation.
Final Technical Outlook
Tanla now sits near one of its most important technical zones in recent weeks.
Short-term trend structure remains positive because price continues to stay above major short-term moving averages. At the same time, momentum indicators show weakness, while long-term resistance near ₹539 continues to block upward progress.
This combination creates uncertainty.
At present, the chart suggests patience rather than aggressive action. The next major move will likely depend on whether buyers successfully push price above resistance or whether sellers force price below support.
Until one of these levels breaks clearly, Tanla remains in a wait-and-watch phase.
The technical picture currently leans slightly positive, but confirmation has not arrived yet.
Disclaimer
The information presented in this article is purely for educational and informational purposes only and should not be treated as financial, investment, or trading advice. The analysis is based on publicly available financial data, historical performance, and general market observations at the time of writing. Stock market investments are subject to market risks, and future performance may differ from past trends. Readers are advised to conduct their own research and consult a qualified financial advisor before making any investment decisions. The views expressed here are analytical opinions and do not represent any recommendation to buy, sell, or hold any security.
Frequently Asked Questions (FAQs)
1. What does Tanla Platforms do?
Tanla Platforms Ltd Tanla Platforms operates in the cloud communication sector and helps businesses send OTPs, SMS alerts, customer notifications, and secure digital communication through enterprise messaging platforms.
2. Is Tanla Platforms fundamentally a strong company?
Tanla currently shows strong fundamentals in certain areas such as low debt, healthy profitability, and a stable balance sheet. However, recent financial reports show slower growth compared with earlier years.
3. Why do analysts consider Tanla’s balance sheet strong?
The company operates with very low debt levels and maintains good financial stability. This reduces financial risk and gives management more flexibility during uncertain business conditions.
4. Has Tanla’s revenue growth slowed recently?
Yes. The company reported FY26 revenue of ₹4,418 crore with approximately 9.7 percent yearly growth. Revenue continues to expand, but the pace has become slower compared with previous growth phases.
5. Is Tanla Platforms profitable?
Yes. The company reported EBITDA of ₹724 crore and net profit close to ₹509 crore in FY26, which shows that the business remains profitable despite some margin pressure.
6. Why is margin pressure becoming important for Tanla?
Profit margins have started to decline compared with earlier financial periods. This may happen due to higher operating costs, competitive pricing pressure, or changes in business mix.
7. Does Tanla Platforms have debt risk?
At present, debt risk appears relatively low because the company historically maintains a low leverage structure and does not depend heavily on borrowed capital.
8. What sector does Tanla Platforms operate in?
Tanla operates in the CPaaS sector, also known as Communication Platform as a Service. This industry focuses on enterprise communication infrastructure such as SMS APIs, customer authentication, and secure digital messaging.
9. What is the biggest challenge for Tanla right now?
The biggest challenge appears to be slower earnings growth and margin pressure. Investors are closely watching whether the company can return to faster business expansion.
10. Is Tanla Platforms a long-term growth company?
The company operates in a sector with long-term demand potential. However, future growth will depend largely on management execution, product expansion, and the company’s ability to improve earnings growth again.
ALSO READ: Major Corporate Actions Set Market Tone This Week


