
Financial markets often reveal subtle warning signals before large price movement begins. Most traders focus only on price charts, option premiums, or open interest data. However, another important layer exists beneath visible market activity. That layer comes from exchange infrastructure itself.
Internal exchange behavior can often reveal how aggressively market participants operate even before price action fully reflects that activity. When unusual pressure begins to build inside derivatives infrastructure, it can sometimes indicate that large traders have already started adjusting positions ahead of expected volatility.
Recent internal exchange-level observations from the derivatives segment of the National Stock Exchange of India reveal several unusual patterns that deserve attention. Three separate areas stand out. The first comes from latency behavior within futures and options infrastructure. The second comes from exceptionally high message traffic inside the derivatives ecosystem. The third comes from broad contract distribution across listed derivatives instruments.
When all three patterns appear together, the market often enters a phase where volatility risk starts rising.
This observation does not predict market direction. It does not indicate whether the index will move higher or lower. Instead, it suggests that underlying market conditions currently resemble patterns historically associated with higher volatility sessions.
Exchange Latency Data Reveals Signs of Internal System Stress
One of the most important indicators inside any electronic exchange comes from latency measurements. Latency measures how quickly exchange infrastructure processes incoming orders after market participants send them into the system.
Under stable conditions, latency distribution usually remains relatively smooth. Most transactions pass through the exchange within a narrow time range, and extreme delays remain rare.
Recent exchange data shows a different picture.
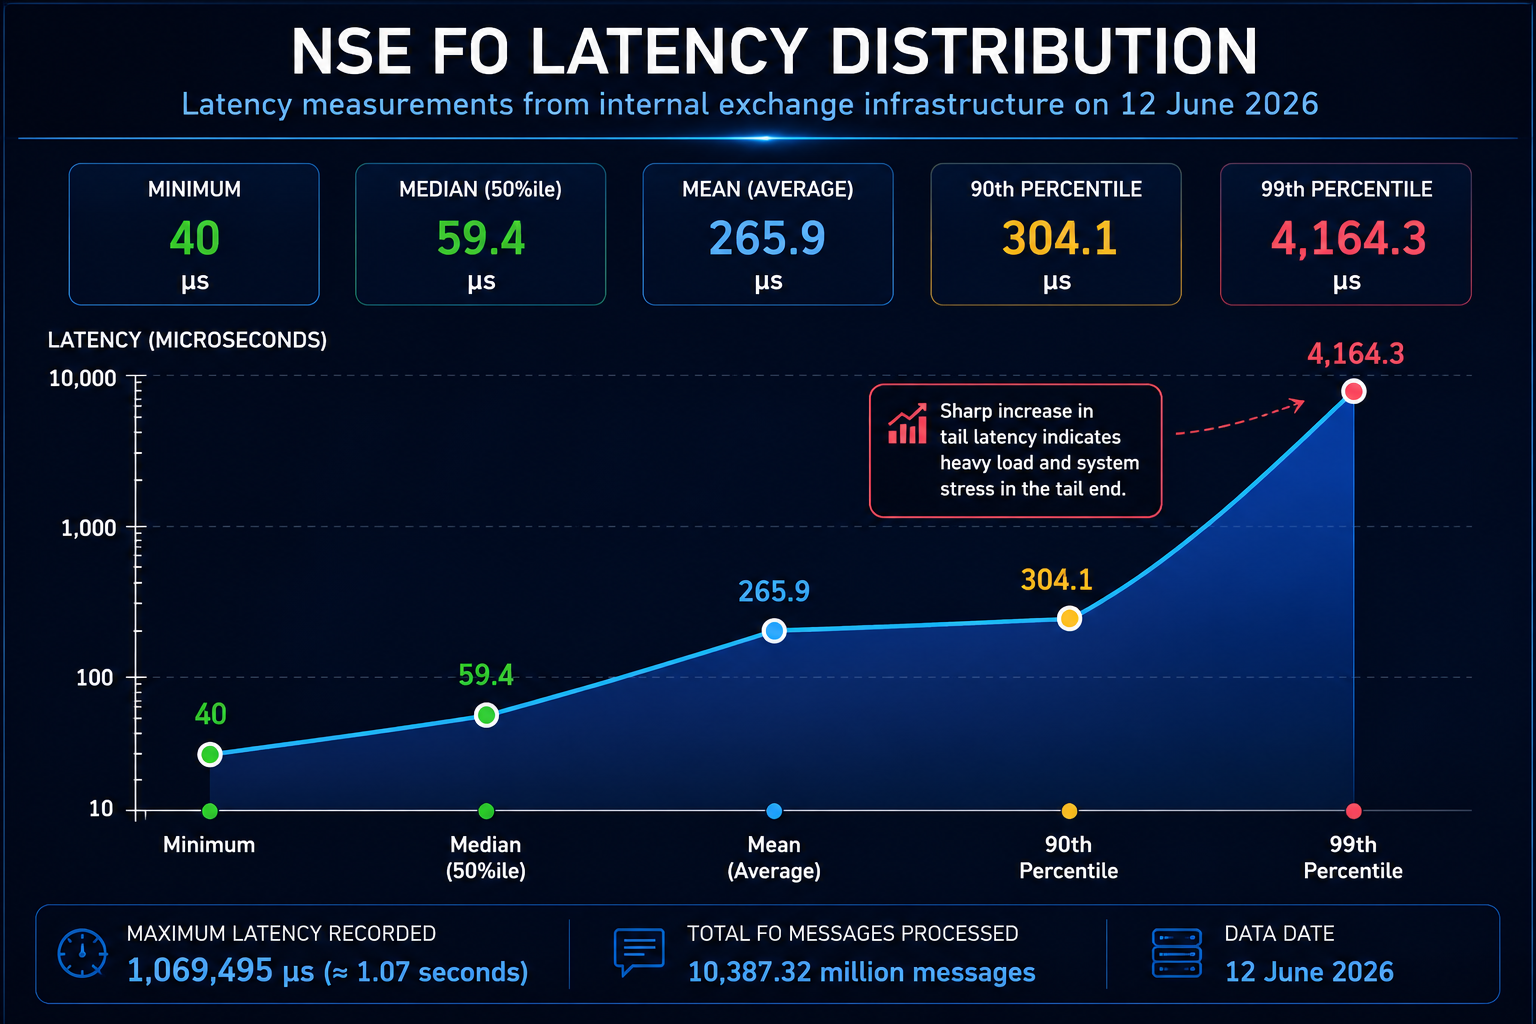
The lowest recorded latency stood at 40 microseconds, which indicates that at its fastest point the exchange infrastructure performed efficiently. The average latency across processed traffic reached 265.9 microseconds. Meanwhile, the median latency remained far lower at 59.4 microseconds.
At first glance this appears normal.
However, deeper statistical distribution reveals unusual divergence.
The 90th percentile latency reached 304.1 microseconds. More importantly, the 99th percentile jumped sharply to 4164.3 microseconds. The highest observed latency reached 1,069,495 microseconds, which equals roughly 1.07 seconds.
This statistical gap matters significantly.
In a healthy exchange environment, higher percentile latency usually rises gradually above the median. Here, median latency remains extremely low while tail-end latency rises dramatically.
This tells us that although most transactions continue processing normally, a smaller percentage of exchange traffic experiences unusually severe delays.
Such patterns often suggest temporary stress pockets within exchange infrastructure.
These stress pockets can emerge when certain systems suddenly face excessive order flow beyond ordinary conditions.
The Tail Latency Spike Is The Most Important Signal
The sharp rise between median latency and tail latency deserves particular attention.
A median of 59.4 microseconds indicates smooth normal operation for most orders. However, a jump toward 4164.3 microseconds at the 99th percentile shows that some orders encountered processing delays nearly seventy times higher than median levels.
This type of imbalance usually appears when exchange systems handle sudden bursts of concentrated order traffic.
Electronic exchanges process millions of requests simultaneously through several infrastructure layers. These include order routing gateways, matching engines, pre-trade risk systems, validation modules, and contract broadcast systems.
When message flow increases sharply, certain infrastructure layers may temporarily experience queue buildup.
This does not imply technical malfunction.
Rather, it suggests unusually heavy demand reached specific parts of the exchange at the same time.
From a market structure perspective, this usually reflects elevated trading intensity.
Extremely High Message Traffic Suggests Aggressive Market Participation
A second major signal comes from message traffic volume inside the derivatives segment.
Exchange infrastructure recorded 10,387.32 million futures and options messages during the observed session.
This number is exceptionally large.
Modern exchanges count every market interaction as message traffic. Each new order creates one message. Every cancellation creates another message. Every modification, quote update, risk check, or automated adjustment contributes additional traffic.
High message traffic generally reflects active market participation.
However, traffic at this scale deserves closer examination.
Retail investors rarely generate this volume.
Such extremely large message counts usually come from algorithmic trading firms, institutional execution desks, proprietary trading firms, market makers, and quantitative trading systems.
These participants constantly adjust orders at extremely high speed.
When message traffic reaches unusually elevated levels, it often indicates aggressive repositioning activity.
Large participants may adjust portfolios, rebalance hedges, or prepare for anticipated market movement.
Heavy message traffic alone does not automatically signal future volatility.
But when large traffic volume appears alongside unusual latency stress, the probability of meaningful market activity generally rises.
ALSO READ: OI Data Shows Key Institutional Bets for Tuesday
Large Institutions Usually Drive This Type Of Exchange Activity
Market structure data strongly suggests that activity at this scale rarely originates from smaller retail participants.
Institutional participants dominate high-frequency exchange traffic.
Large trading firms frequently deploy automated systems that continuously place and cancel orders within milliseconds. Market makers constantly update bid and ask prices across option chains. Quantitative trading systems rapidly adjust exposures based on changing market conditions.
As a result, infrastructure pressure often reflects behavior from sophisticated market participants rather than ordinary speculative traders.
This becomes important because institutional positioning often occurs before broader market movement becomes visible.
Large firms typically adjust risk exposure ahead of expected volatility rather than after volatility begins.
In simple terms, sophisticated participants often react first.
Exchange infrastructure sometimes reflects that behavior before price charts reveal it.
Broad Derivatives Contract Activity Suggests Wide Position Distribution
Another important observation comes from derivatives contract activity.
Exchange systems recorded approximately 42,881 active derivatives contract entries across the futures and options ecosystem.
This number is notable because it suggests broad contract participation.
A large portion of these entries came from options contracts distributed across multiple strike prices.
Examples include contract structures similar to:
ABB26AUG5800CE
ABB26AUG5800PE
ABB26AUG6000CE
The significance here lies not in individual contracts but in overall distribution behavior.
When traders concentrate only around a narrow range of strike prices, market expectations often remain relatively stable.
However, when participation spreads broadly across many strikes, it frequently indicates wider uncertainty regarding future price movement.
Participants begin positioning across multiple price levels instead of focusing on one narrow direction.
This often happens when traders anticipate stronger volatility.
Rather than betting on a simple directional move, participants prepare for multiple possible market outcomes.
That behavior often reflects uncertainty.
Contract Density Often Reflects Growing Market Uncertainty
Wide options contract distribution frequently acts as an early warning sign.
When traders expect calm market conditions, option activity usually remains concentrated around near-the-money strikes.
But when uncertainty rises, activity often spreads outward.
Participants may begin building protective hedges further away from spot price levels. Others may establish volatility-based option strategies rather than directional positions.
This causes contract density to expand across a broader strike range.
Broad participation across many strike levels therefore becomes an indirect indicator of rising uncertainty inside derivatives markets.
The recent exchange data strongly suggests this pattern.
Combined System Load Suggests Localized Infrastructure Pressure
The most important observation appears when all available signals are studied together.
The exchange processed more than 10.3 billion derivatives messages.
At the same time, latency spikes crossed 4164.3 microseconds at the 99th percentile.
The maximum recorded delay reached 1.07 seconds.
Meanwhile, contract participation remained spread across approximately 42,881 derivatives contract entries.
Individually, each metric offers useful information.
Together, they create a much stronger signal.
Exchange systems appear to have experienced unusually concentrated demand within derivatives infrastructure.
This does not suggest exchange failure.
There is no evidence of technical breakdown.
However, it strongly suggests certain infrastructure layers experienced temporary pressure due to elevated market activity.
Matching engines may have encountered queue buildup. Routing gateways may have processed unusually heavy order traffic. Risk validation systems may have faced higher throughput demand than normal operating conditions.
From a systems perspective, infrastructure appears stressed but operational.
From a market perspective, participation intensity appears elevated.
Why Infrastructure Stress Can Matter For Future Price Action
Market behavior often changes before price itself reacts.
Sophisticated participants usually adjust exposure before major market moves begin.
Heavy derivatives participation can sometimes indicate traders prepare for an upcoming event, expected price shock, or anticipated increase in uncertainty.
When this happens, infrastructure begins processing significantly more order traffic.
Latency pressure rises.
Order modifications increase.
Quote activity accelerates.
System load expands.
By the time retail traders notice unusual price movement, institutional positioning may already be underway.
This is why exchange infrastructure data can sometimes act as an early warning mechanism.
It does not predict exact market direction.
But it helps reveal underlying market intensity.
Potential Market Implications For The Next Session
Current exchange-level observations suggest the market may enter a period of elevated activity.
The next trading session may experience wider intraday price ranges.
Option premiums may adjust more rapidly than usual as traders reprice short-term uncertainty.
Index futures may show stronger directional movement if institutional positioning continues.
Bid-ask spreads could temporarily widen under heavier market activity.
Intraday reversals may become sharper as option dealers adjust exposures dynamically.
Again, this does not guarantee a market move.
Calm sessions sometimes follow periods of elevated exchange activity.
However, historical patterns show that similar combinations of infrastructure pressure, heavy message traffic, and dense derivatives participation often appear before volatility expansion.
Final Market Interpretation
The recent internal exchange behavior creates a meaningful early warning signal.
Latency distribution shows unusual stress concentrated within the tail end of the system.
Message traffic exceeding 10,387.32 million transactions indicates exceptionally heavy derivatives activity.
Broad contract participation across approximately 42,881 derivatives instruments suggests wide market positioning rather than narrow directional trading.
Together these three signals point toward one broad conclusion.
Derivatives market activity appears unusually elevated.
Sophisticated market participants may already be adjusting positions ahead of anticipated price movement.
There is no evidence that this guarantees bullish or bearish direction.
However, the probability of above-average volatility appears meaningfully higher than ordinary market conditions.
Historically, exchange infrastructure patterns similar to these often emerge before sessions where price movement accelerates sharply.
The market may therefore approach the next session with a heightened probability of stronger volatility.
Direction remains uncertain.
But internal exchange behavior suggests underlying market pressure is building.
And when pressure builds beneath the surface, volatility often follows shortly after.
FAQs
1. What does NSE latency data actually measure?
NSE latency data measures how quickly the exchange processes orders after traders send them into the futures and options system. Lower latency usually means smoother exchange performance.
2. Why is a high 99th percentile latency important?
A high 99th percentile means a small portion of orders faced unusually large delays. This often shows temporary pressure inside exchange systems when activity rises sharply.
3. Does higher latency mean the exchange had technical problems?
Not necessarily. Higher latency can simply mean the exchange handled very heavy order traffic at certain moments. It does not automatically indicate a system failure.
4. Why were more than 10.38 billion FO messages recorded?
This usually happens when large traders actively place, cancel, and modify orders at very high speed. Algorithmic trading systems often create large message volumes.
5. What does heavy derivatives activity tell us about the market?
Heavy derivatives activity may suggest that traders expect bigger price movement soon. It often reflects increased hedging or speculative positioning.
6. Why does contract broadcast data matter in market analysis?
Contract broadcast data shows how many futures and options contracts remain active. A wider spread across many strike prices can signal growing uncertainty in the market.
7. Can this data predict whether the market will rise or fall tomorrow?
No. This data does not predict direction. It only shows market conditions that may increase the probability of stronger price movement.
8. Why do institutional traders affect exchange data more than retail traders?
Large institutions use automated systems that send thousands of orders very quickly. This creates much higher exchange traffic compared to normal retail trading activity.
9. Does high exchange activity always lead to market volatility?
Not always. However, when high message traffic, latency spikes, and heavy derivatives activity appear together, volatility often rises in upcoming sessions.
10. What is the main takeaway from this NSE internal data?
The combined exchange data suggests unusually heavy derivatives participation. Historically, similar patterns often appear before sessions with above-average market volatility.
ALSO READ: Crypto Crash Shows Rising Danger of AI Powered Hacking
DATA SOURCE: NSE INDIA