
The MCX Crude Oil July Futures chart on the 75-minute time frame shows a positive technical structure. Price has moved up after a long fall and has almost reached an important resistance area. The chart also shows a cup pattern, which many traders watch as a possible continuation pattern. At the same time, the moving averages show a positive order, while the RSI stays in a healthy zone. These signals together present a constructive market picture. Even so, no chart pattern can promise a future result. Every technical setup needs price confirmation before traders treat it as a valid breakout.
This analysis explains the current market structure in very simple English. It looks at the cup pattern, moving averages, RSI, support and resistance levels, volume, and possible price targets. The discussion is only for educational and analytical purposes and should not be treated as financial or investment advice.
Current Price Position
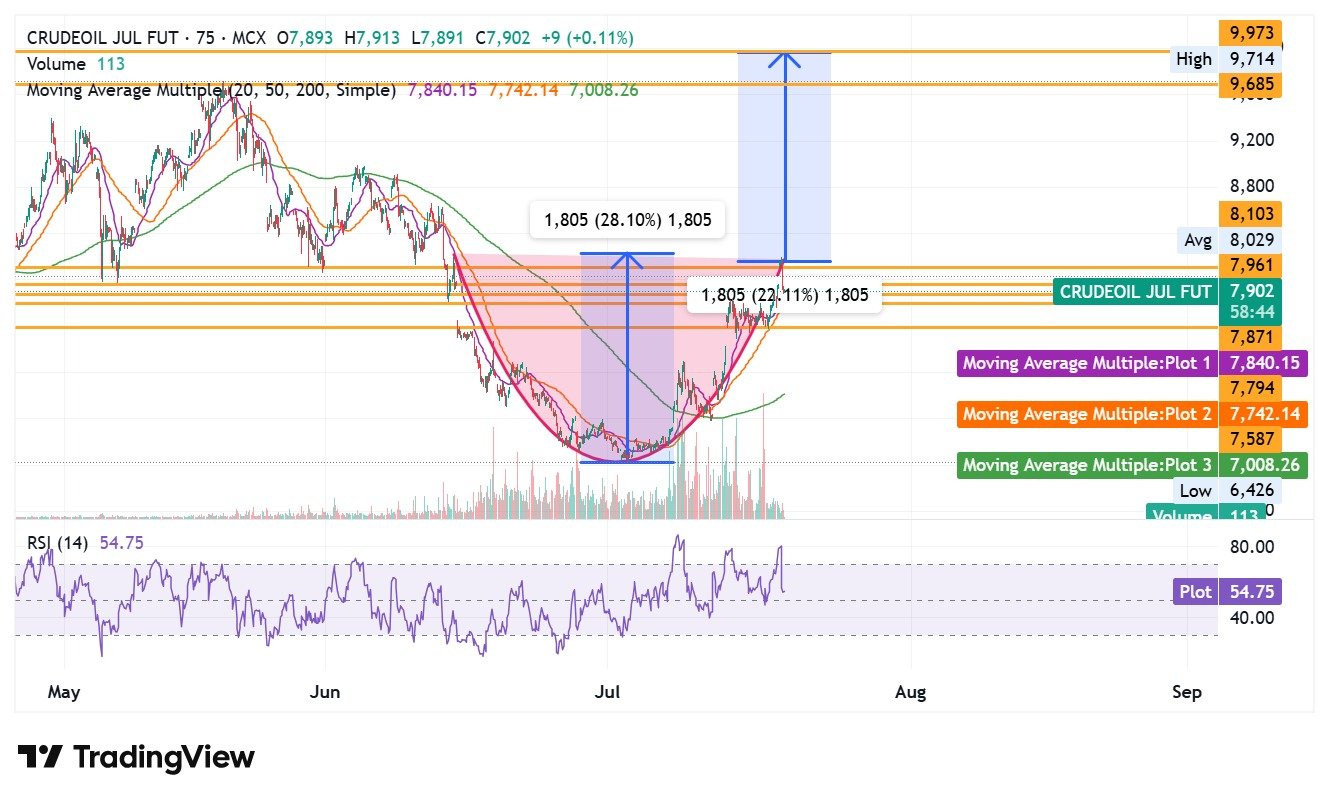
The current price stands near 7,902. This level places the market very close to a major resistance zone around 7,950 to 8,000. Price has reached this area after a steady rise from the recent bottom. This move shows that buyers have regained control over the short term.
At present, the market has not yet moved clearly above resistance. This means the chart still waits for confirmation. A strong close above this zone may improve the positive outlook. On the other hand, failure near this level may lead to another pullback before the next move.
Cup Pattern Shows Positive Structure
One of the most noticeable features on the chart is the cup pattern. This pattern develops after a long decline and a gradual recovery. The left side of the cup shows the earlier fall in price. The middle section forms a rounded bottom. The right side shows the recovery back toward the previous resistance area.
The rounded shape often reflects a slow change in market sentiment. Sellers lose control while buyers slowly return. As confidence grows, price moves back toward the earlier high.
In this chart, the measured depth of the cup is about 1,805 points, which equals roughly 28%. The same distance appears above the neckline as a possible technical target after a successful breakout.
The neckline of the pattern sits close to 7,960 to 8,000. Price has almost reached this level. The next few candles may decide whether the pattern receives confirmation or whether more consolidation takes place.
Measured Move Suggests Higher Levels
Technical analysis often uses the depth of a chart pattern to estimate a possible target after a breakout. In this case, the cup depth measures about 1,805 points.
When this distance moves above the neckline, the projected objective reaches close to 9,973. This target does not guarantee that price will reach this level. It simply shows the potential move based on the size of the pattern.
Markets rarely move in a straight line. Price usually meets resistance at several stages before it reaches a final objective. Traders therefore watch each resistance zone one after another instead of assuming that the final target will arrive without difficulty.
Moving Averages Show Strong Bullish Alignment
The moving averages present one of the strongest positive signals on this chart.
The 20-period Simple Moving Average stands near 7,840.15.
The 50-period Simple Moving Average stands near 7,742.14.
The 200-period Simple Moving Average stands near 7,008.26.
The order of these averages is very important.
The 20 SMA stays above the 50 SMA.
The 50 SMA stays above the 200 SMA.
This arrangement reflects a healthy trend across short, medium, and long time periods. It shows that recent prices remain stronger than older prices. Many traders consider this type of alignment as a sign that buyers hold control across different time frames.
Price also trades above all three moving averages. This adds more strength to the overall structure because each average may act as support during normal market corrections.
The upward direction of the shorter averages also shows that momentum has improved after the earlier decline.
Table of Moving Average Values
| Moving Average | Value | Market View |
|---|---|---|
| 20 SMA | 7,840.15 | Short-term trend stays positive |
| 50 SMA | 7,742.14 | Medium-term trend remains strong |
| 200 SMA | 7,008.26 | Long-term trend stays positive |
| MA Alignment | 20 > 50 > 200 | Strong bullish structure |
This alignment gives additional confidence to the current technical picture. However, price action always remains the final confirmation.
RSI Shows Healthy Momentum
The Relative Strength Index, also known as RSI, stands near 54.75.
This value places the indicator above the middle level of 50 but below the overbought area near 70.
This position often suggests balanced momentum with room for further movement. Buyers appear active, but the market does not yet look overheated.
If price breaks above resistance and RSI moves above 60 or 65, many technical traders may treat that as extra confirmation that buying strength has improved.
If RSI starts to fall while price struggles near resistance, momentum may weaken and a short-term pullback may become more likely.
Volume Supports the Recovery
Volume also plays an important role in technical analysis.
The chart shows better trading activity during the recovery from the recent lows. This increase suggests that more market participants have taken interest as price moved higher.
Even so, the most important volume signal has not yet arrived.
A breakout above the neckline becomes more reliable when volume also rises above normal levels. Strong participation from buyers often supports a sustained move.
If price crosses resistance with weak volume, the chance of a false breakout may become higher.
Important Resistance Levels
Several resistance zones appear above the current market price.
The first and most important area stands between 7,950 and 8,000. This zone forms the neckline of the cup pattern.
Above this area, the next resistance stands near 8,103.
Higher levels appear around 9,685 and 9,714.
The final projected target based on the cup pattern reaches close to 9,973.
Each of these areas may slow price movement because sellers may return near earlier resistance zones.
Important Support Levels
Support levels remain equally important because they help traders understand where buyers may return.
The nearest support stands around 7,870.
The next important level comes near the 20 SMA at 7,840.15.
Below that, the 50 SMA at 7,742.14 becomes another important support area.
Further support appears near 7,587.
The 200 SMA around 7,008.26 represents the major long-term support level.
If price stays above these support areas after a breakout, the overall bullish structure remains healthier.
Table of Key Price Levels
| Type | Price Level |
|---|---|
| Current Price | 7,902 |
| First Support | 7,870 |
| 20 SMA | 7,840.15 |
| 50 SMA | 7,742.14 |
| Major Support | 7,587 |
| 200 SMA | 7,008.26 |
| Neckline Resistance | 7,950–8,000 |
| Next Resistance | 8,103 |
| Higher Resistance | 9,685 |
| Higher Resistance | 9,714 |
| Pattern Target | 9,973 |
Bullish Scenario
The positive outlook depends on confirmation above the neckline.
If price closes above 7,950 to 8,000 with strong volume, the cup pattern may receive technical confirmation.
Such a move may attract more buyers because many market participants watch this type of breakout.
After confirmation, price may first test 8,103.
If buying strength continues, the market may later move toward 9,685, followed by 9,714.
The measured move from the cup pattern places the longer-term objective close to 9,973.
These levels represent technical projections rather than guarantees.
Bearish Scenario
A different outcome also remains possible.
If price fails to move above the neckline, sellers may return.
The first support stands near 7,870.
If this level breaks, attention may shift toward the 20 SMA near 7,840.15.
Further weakness may bring price toward the 50 SMA near 7,742.14.
Another decline could test the support area near 7,587.
Even during a bullish trend, temporary corrections remain normal. A short pullback does not always mean that the larger trend has ended.
Overall Technical Picture
Several technical signals support the current market structure.
The cup pattern shows a rounded recovery after a long decline.
Price trades above all major moving averages.
The moving averages remain in a strong bullish order with the 20 SMA above the 50 SMA and the 50 SMA above the 200 SMA.
RSI stays above the neutral level and still leaves room for additional strength.
Volume has improved during the recovery, although traders may still look for stronger participation during any breakout.
The only missing element at this stage is a confirmed move above the neckline. Until price closes above resistance, the pattern remains incomplete.
Final View
The MCX Crude Oil July Futures chart currently presents a constructive technical picture with several positive signals. The cup pattern, healthy RSI, strong moving average alignment, and price above all major averages together suggest that buyers have gained strength after the earlier decline.
At the same time, the market stands directly below a major resistance zone near 7,950 to 8,000. This level may decide the next important move. A successful breakout with higher volume may strengthen the bullish case and open the path toward higher resistance levels, including the measured target near 9,973. If the breakout fails, price may return to nearby support areas before another attempt.
Technical analysis studies probabilities rather than certainty. Market conditions can change at any time because of news, global events, economic data, or changes in trader sentiment. For this reason, every chart pattern should receive confirmation through price action before any conclusion. This analysis reflects only the current technical structure visible on the chart and should not be considered financial, investment, or trading advice.