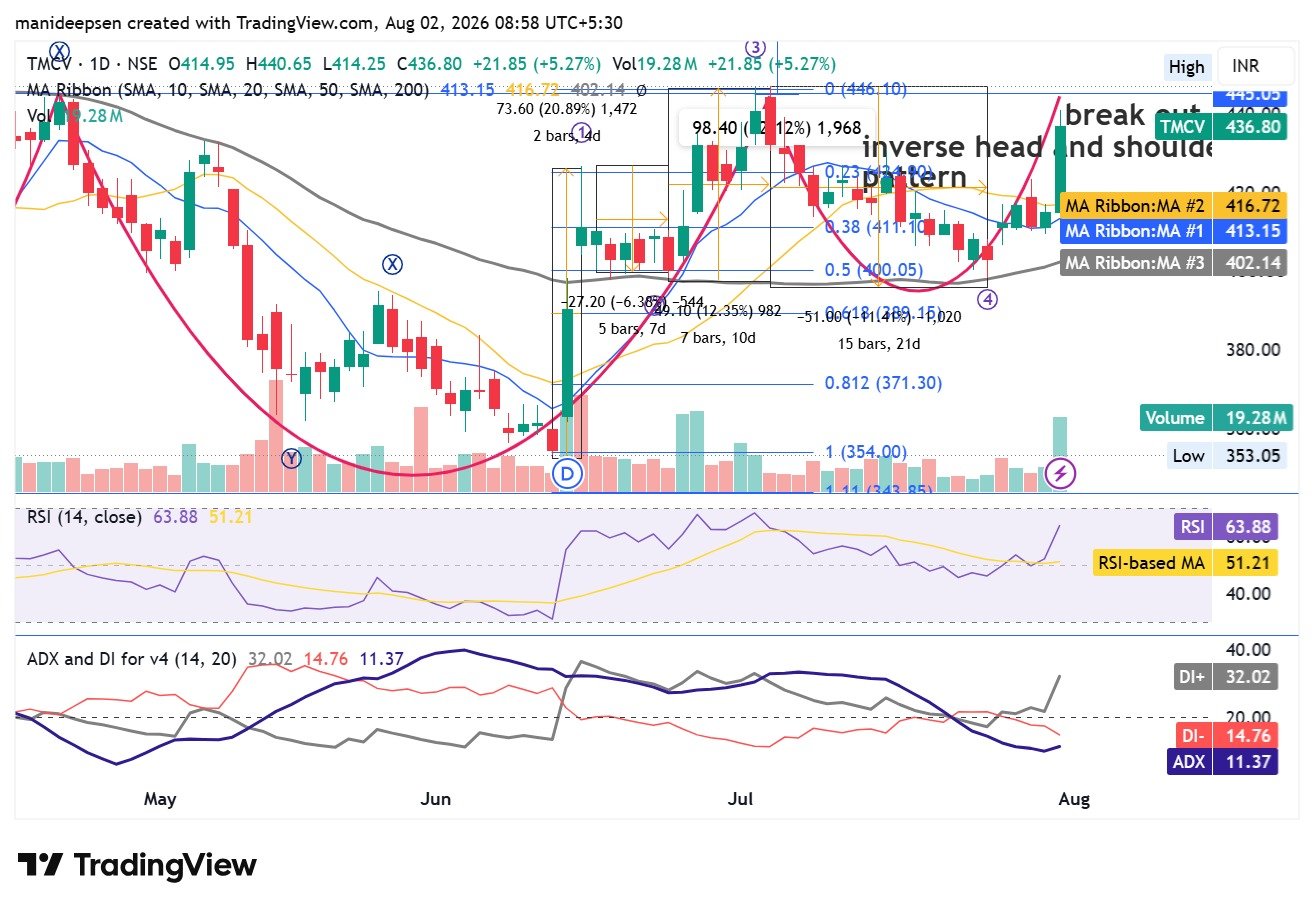
The daily chart of TMCV on the NSE shows a strong rise after a clear recovery from earlier weakness. The latest session closed at ₹436.80, with a gain of ₹21.85, or 5.27%. The stock opened at ₹414.95, reached a high of ₹440.65, and touched a low of ₹414.25 before the close.
The final candle has a large bullish body and ends close to the day’s high. This type of candle often shows that buyers had control for most of the session. Even so, one strong session alone does not confirm a long-term trend. Future price action will decide if this move has enough strength to continue.
Inverse Head and Shoulders Pattern
The chart shows what appears to be an inverse head and shoulders pattern. This pattern often appears after a period of weakness and may point to a possible change in trend. It has three main parts. The left shoulder came first, the head formed after a deeper fall, and the right shoulder appeared before the recent rise.
The neckline sat near the ₹420 to ₹425 area. The latest session closed above this zone. A close above the neckline may support the idea of a bullish reversal. Still, no chart pattern gives a certain result. A future move back below this level could weaken the setup.
Strong Breakout Above Resistance
The chart also marks the latest move as a breakout. Price moved above the neckline with a strong daily candle. This move came with much higher trading volume, which often adds support to a breakout.
Many traders watch volume during a breakout because it may show wider market participation. In this case, the daily volume reached 19.28 million shares, which stands well above many recent sessions. This rise in activity may suggest that buyers showed greater interest during the move.
Even so, a successful retest of the breakout area could offer more confidence than a single strong session. The market may still test this level in the days ahead.
Position Above Moving Averages
The chart shows price above all three major moving averages.
The blue moving average stands at ₹413.15. The yellow moving average stands at ₹416.72. The grey moving average stands at ₹402.14.
The latest close at ₹436.80 sits above each of these levels. This position often reflects positive price strength across the short, medium, and longer time frames.
The chart also suggests that the shorter moving averages have turned higher. This change may support the present trend if price remains above these levels. However, a move below these averages could reduce bullish momentum.
RSI Shows Healthy Momentum
The Relative Strength Index, or RSI, stands at 63.88.
An RSI above 50 often points to positive momentum. The current value also remains below 70, which many traders view as the traditional overbought zone.
This reading suggests that momentum has improved while still leaving room for more upside if buying pressure continues. At the same time, RSI alone cannot predict future price movement. It works best when viewed with price action, volume, and support levels.
ADX and DI Readings
The chart also includes the Average Directional Index, along with the positive and negative directional indicators.
The DI+ value stands at 32.02, while DI- stands at 14.76. This gap shows that buyers currently hold the stronger position.
The ADX value is 11.37. This level remains below 20, which often suggests that the trend has not yet reached strong strength.
If ADX rises above 20 while DI+ remains above DI-, the trend may gain more support. Until then, the current move may still need more time before traders view it as a fully established trend.
Fibonacci Levels
The chart also shows Fibonacci retracement levels.
The 0.236 level sits at ₹424.90.
The 0.382 level sits at ₹411.10.
The 0.500 level sits at ₹400.05.
The 0.618 level sits at ₹389.15.
The latest close remains above the first retracement level. This position may support the current bullish view. Even so, these levels should not be treated as guaranteed support or resistance. They simply mark areas that traders often watch.
Support Levels
The first important support area now sits near the breakout zone between ₹425 and ₹428. A successful hold above this range could support the present trend.
The next support appears near the moving averages. The yellow moving average sits near ₹416, while the blue moving average sits near ₹413.
The grey moving average near ₹402 forms another important support area. A close below several of these levels may weaken the current technical picture.
Resistance Levels
The next important resistance appears between ₹440 and ₹446. This area matches an earlier swing high on the chart.
A strong close above this zone may improve the bullish outlook. If that happens, some traders may watch possible upside areas near ₹455, ₹470, and ₹485 to ₹490.
These price levels are only technical projections based on the chart. They are not price targets or guarantees.
Overall Technical View
The daily chart presents several positive technical signals. The inverse head and shoulders pattern, strong breakout candle, higher trading volume, and close above all major moving averages together create a constructive picture.
The RSI also supports positive momentum, while DI+ remains well above DI-. The main point of caution comes from the ADX, which still sits below the level that many traders use to confirm a strong trend.
Based only on the chart, the current technical picture appears constructive. However, financial markets remain uncertain by nature. Price may continue higher, move sideways, or reverse. For that reason, this analysis should serve only as an educational review of the chart rather than financial, investment, or trading advice. Traders and investors should combine technical analysis with risk management, market conditions, and their own research before making any decision.
Frequently Asked Questions
1. What does the latest TMCV chart show?
The latest daily chart shows a strong bullish move. The stock closed at ₹436.80, up 5.27%, with a large green candle and higher trading volume. This may point to better market sentiment, although future price movement remains uncertain.
2. What is an inverse head and shoulders pattern?
An inverse head and shoulders pattern is a common technical chart pattern that may appear after a downtrend. It often suggests that selling pressure has eased and buyers may have started to take control. However, no chart pattern guarantees a future price move.
3. Why is the breakout important?
The stock moved above the neckline near ₹420–₹425, which marks a technical breakout. A breakout above resistance, along with strong volume, may improve the bullish outlook. Even so, traders often wait for more confirmation before reaching a conclusion.
4. Why does trading volume matter?
Volume helps show how much market participation supports a price move. TMCV recorded 19.28 million shares in volume during the latest session. Higher volume may add confidence to a breakout, but it does not guarantee that the move will continue.
5. What does the RSI value of 63.88 mean?
The Relative Strength Index (RSI) stands at 63.88, which is above the neutral level of 50 but below the traditional overbought level of 70. This reading suggests positive momentum while still leaving room for further movement if buying interest remains strong.
6. What do the moving averages indicate?
The stock trades above the 10-day, 20-day, and 200-day moving averages, with values at ₹413.15, ₹416.72, and ₹402.14, respectively. This position often reflects strength across different time frames, although moving averages should not be used alone.
7. What does the ADX reading tell us?
The ADX stands at 11.37, which remains below the level that many traders associate with a strong trend. While the current price action looks positive, the trend may need more strength before it gains wider technical confirmation.
8. What are the key support and resistance levels?
The first support area appears between ₹425 and ₹428. Additional support lies near ₹416, ₹413, and ₹402. The next important resistance zone sits between ₹440 and ₹446, where sellers may become active.
9. Can the stock continue to rise?
If the stock stays above the breakout area and moves above ₹440–₹446, the technical picture may improve further. However, market conditions can change quickly, and no outcome is certain.
10. Is this chart analysis financial advice?
No. This article provides an educational review of the technical chart based on visible price action and indicators. It should not be treated as financial, investment, or trading advice. Investors should conduct their own research and consider their financial goals before making any investment decision.