
Canara Bank has become one of the strongest public sector banks in India over the last few years. The bank has shown clear progress in profit, loan growth, and asset quality. At the same time, its stock price has started to show signs of strength after a period of weakness.
This article studies both the technical chart and the fundamental position of Canara Bank. The purpose is to understand what the stock currently tells investors and traders. The analysis uses the daily price chart along with the latest available financial data. It does not predict future price movement with certainty. Instead, it explains what the current evidence suggests and what investors may watch over the coming weeks and months.
Current Price Position
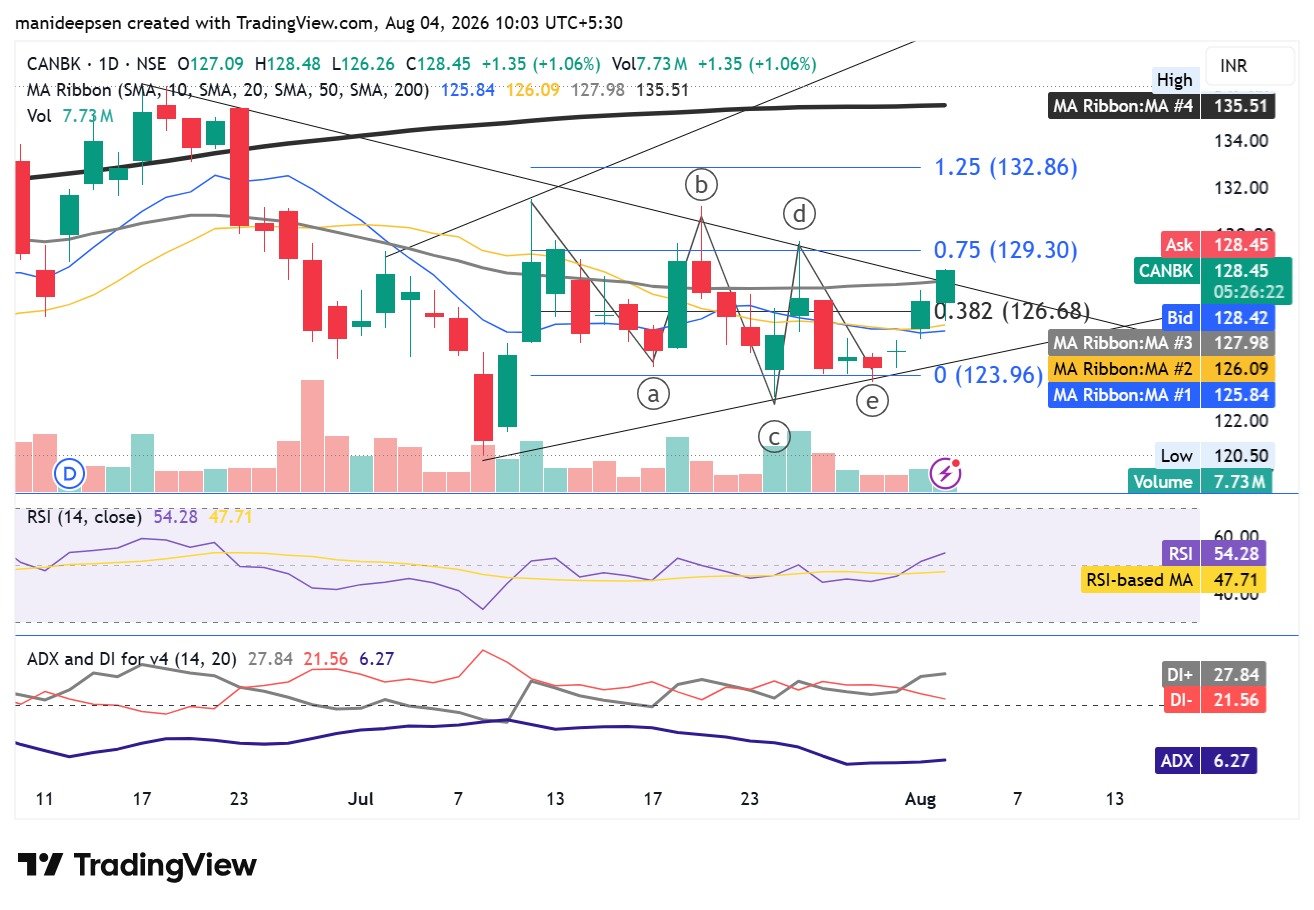
The daily chart shows that Canara Bank closed at ₹128.45 after a gain of 1.06%.
The stock traded between ₹126.26 and ₹128.48 during the session. Volume stood at 7.73 million shares, which was higher than several recent sessions.
The latest close places the stock above its short-term moving averages. This is often viewed as a positive sign because buyers have started to regain control after several weeks of sideways movement.
However, the stock still trades below its long-term moving averages. This means the larger trend has not yet changed completely.
Price Summary
| Indicator | Value |
|---|---|
| Closing Price | ₹128.45 |
| Day High | ₹128.48 |
| Day Low | ₹126.26 |
| Volume | 7.73 Million |
| Daily Change | +1.06% |
Price Structure Shows Improvement
The chart shows a long decline that started after the stock failed to hold higher levels during June. Sellers remained active for several weeks, but every fresh decline found support near ₹124.
This repeated support is important because it shows that buyers were willing to purchase shares near that level. Instead of making lower lows, the stock started to build higher lows.
This change in behaviour often suggests that selling pressure has started to weaken.
The latest bullish candle closed near the day’s high. Such candles usually indicate that buyers remained active until the market closed. One strong candle alone does not confirm a new trend, but it often becomes an early sign of strength when it appears after a period of consolidation.
Moving Averages Show a Better Short-Term Trend
Moving averages help investors understand the overall direction of a stock.
The current values are shown below.
| Moving Average | Value |
|---|---|
| 10-Day SMA | ₹125.84 |
| 20-Day SMA | ₹126.09 |
| 50-Day SMA | ₹127.98 |
| 200-Day SMA | ₹135.51 |
The stock currently trades above the 10-day and 20-day moving averages.
This suggests that short-term momentum has improved.
The 10-day average has also started to move closer to the 20-day average. If this relationship continues, it may strengthen the short-term trend.
However, the stock still trades below both the 50-day and the 200-day moving averages. These two averages often represent the medium-term and long-term trend.
Because the price remains below them, it would be too early to describe the overall trend as fully bullish.
The chart therefore presents three different views.
The short-term picture appears positive.
The medium-term picture remains neutral.
The long-term picture still needs further improvement.
Fibonacci Levels Highlight Important Price Zones
The chart includes Fibonacci retracement levels.
These levels often act as areas where buyers and sellers become active.
The important levels are shown below.
| Fibonacci Level | Price |
|---|---|
| 0 | ₹123.96 |
| 0.382 | ₹126.68 |
| 0.75 | ₹129.30 |
| 1.25 | ₹132.86 |
The stock has already moved above the 0.382 level at ₹126.68.
The next important level sits near ₹129.30.
A successful close above this level may improve market confidence. If buyers remain active after such a move, the next areas of interest could appear near ₹132.86 and later around ₹135.50, where the 200-day moving average currently sits.
At the same time, a failure near ₹129.30 could keep the stock inside its recent trading range.
Trendlines Show Buyers Have Become More Active
The chart contains two clear trendlines.
The lower trendline has supported price several times.
Every attempt to push the stock below ₹124 failed during recent weeks.
This repeated support suggests that buyers have defended this area with confidence.
The upper trendline still acts as resistance.
The stock has approached this line but has not yet produced a clear breakout.
A close above ₹129–130 may provide stronger evidence that buyers have taken control.
Until then, the breakout remains under observation rather than confirmed.
Volume Supports the Recent Move
Volume often helps investors judge the strength behind a price move.
The latest session recorded 7.73 million shares.
Higher volume during a positive trading session usually reflects stronger participation from market participants.
If future price gains also arrive with higher volume, confidence in the breakout may improve.
On the other hand, if price rises while volume becomes weak, the move may lose strength more quickly.
Volume alone never confirms a trend, but it often adds support to price action.
RSI Indicates Healthy Momentum
The Relative Strength Index, or RSI, measures price momentum.
The current readings are shown below.
| RSI Indicator | Value |
|---|---|
| RSI | 54.28 |
| RSI Moving Average | 47.71 |
An RSI above 50 generally suggests that buyers have a slight advantage.
The current reading also remains above its own moving average.
This relationship supports the idea that momentum has improved.
Another positive point is that RSI remains well below overbought territory.
This means the stock still has room for additional upside if buying interest continues.
ALSO READ:
ADX Shows One Area of Concern
The Average Directional Index measures trend strength rather than trend direction.
The current values are:
| Indicator | Value |
|---|---|
| DI+ | 27.84 |
| DI- | 21.56 |
| ADX | 6.27 |
The positive directional indicator remains above the negative indicator.
This suggests buyers currently have the upper hand.
However, the ADX value stands at only 6.27.
Such a low reading usually suggests that the current trend lacks strong strength.
This becomes the main caution in the technical picture.
Many strong market trends develop after the ADX rises above 20.
Until that happens, traders may continue to look for additional confirmation before expecting a sustained rally.
Important Support and Resistance Levels
Support and resistance levels often become important decision points.
The important levels are shown below.
| Support | Resistance |
|---|---|
| ₹127.98 | ₹129.30 |
| ₹126.68 | ₹132.86 |
| ₹126.09 | ₹135.51 |
| ₹124.00 | — |
The area near ₹124 remains the strongest support.
If the stock stays above this level, buyers may continue to hold the advantage.
A move below ₹124 could weaken the current recovery.
Possible Technical Outlook
The chart currently presents three possible scenarios.
The first scenario remains positive.
If the stock closes above ₹129.30 with strong volume, market confidence may improve further. In such a case, the next areas of interest could appear near ₹132.86 and later around ₹135.50.
The second scenario involves consolidation.
The stock may continue to trade between ₹124 and ₹129 while buyers and sellers compete for control. Such movement would allow the market to build a stronger base before the next major move.
The third scenario becomes negative.
A close below ₹124 would weaken the present recovery. Such a move may open the door for another decline toward ₹121 or ₹122.
At this stage, the first two scenarios appear more likely than the third, although future market conditions can always change.
Fundamental Analysis
Technical charts explain what price has done.
Fundamental analysis explains the strength of the business itself.
Canara Bank has shown major improvement over the last several years.
Its balance sheet has become stronger, profits have improved, and bad loans have reduced sharply.
These changes have helped improve investor confidence.
A Large and Diversified Bank
Canara Bank ranks among India’s largest public sector banks.
Its business covers retail banking, agriculture, MSME finance, corporate lending, and digital banking.
The bank also has a wide branch network across the country.
Such diversification helps reduce dependence on any one business segment.
Government ownership also provides additional stability, although it can sometimes influence market valuation.
Financial Performance Remains Healthy
The latest quarterly results show another healthy performance.
| Financial Metric | Latest Figure |
|---|---|
| Net Profit | ₹4,856 crore |
| Net Interest Income | ₹10,215 crore |
| Loan Growth | Around 19% YoY |
| Deposit Growth | Around 11.6% YoY |
Net profit increased by 2.2% compared with the same period last year.
Net Interest Income increased by 13.4%, which shows healthy growth in the bank’s core lending business.
Loan growth near 19% also reflects healthy demand across different sectors.
Deposit growth of around 11.6% provides support for future lending activity.
Overall, these numbers present a stable financial picture.
Asset Quality Has Improved Significantly
Asset quality was once one of the biggest concerns for many public sector banks.
Canara Bank has shown remarkable improvement in this area.
The latest reported figures are shown below.
| Asset Quality | Value |
|---|---|
| Gross NPA | 1.57% |
| Net NPA | 0.36% |
| Provision Coverage Ratio | 94.76% |
Both Gross NPA and Net NPA remain at comfortable levels.
A high Provision Coverage Ratio also provides an additional safety cushion against future credit losses.
This improvement reflects better loan recovery and stronger risk management.
Loan Growth Supports Future Earnings
Healthy loan growth often creates room for future income.
Canara Bank reported loan growth close to 19% year-on-year.
Management has also guided for 11% to 12% loan growth during FY27.
This guidance suggests that management expects business expansion to continue even after recent growth.
Profitability Remains Stable
The bank continues to generate healthy returns.
Return on Assets remains above one percent.
Return on Equity also compares well with many other public sector banks.
Management has stated that Net Interest Margins are expected to remain stable around current levels.
Stable margins often support consistent earnings over time.
Capital Position Appears Comfortable
The bank currently maintains comfortable capital levels.
Management has indicated that existing capital should remain sufficient even after expected accounting changes.
This reduces the possibility of fresh equity dilution in the near future.
Strong capital also provides flexibility for future business expansion.
Valuation Still Looks Reasonable
Even after recent gains, Canara Bank continues to trade at valuations that remain lower than many private sector banks.
This difference partly reflects the general valuation gap between public and private sector banks.
However, better earnings and improved asset quality may continue to attract investor attention if the bank maintains its financial performance.
Risks Still Exist
Every investment carries risk.
Canara Bank also faces several challenges.
Lower interest rates may reduce profit margins.
Economic weakness could affect loan demand.
Unexpected growth in bad loans could reduce future profits.
Government policy may also influence investor sentiment toward public sector banks.
These factors do not guarantee poor performance, but they remain important areas for investors to watch.
Overall Assessment
The technical chart and the fundamental picture currently support each other better than they did several months ago.
The chart shows higher lows, stronger momentum, healthy volume, and improving price structure.
The financial results show better asset quality, healthy loan growth, stable profits, and comfortable capital levels.
The biggest technical concern remains the weak ADX reading, which suggests that the new trend has not yet gained full strength.
The biggest fundamental challenge remains the broader environment for public sector banks, where changes in interest rates and government policy can influence market sentiment.
Final View
Based on the available evidence, Canara Bank presents a constructive picture for both traders and long-term investors.
The technical chart suggests that buyers have started to regain control after a long period of weakness. A decisive move above ₹129.30 may improve confidence and could shift attention toward ₹132.86 and later ₹135.50.
From a business perspective, the bank has become much stronger than it was a few years ago. Better asset quality, healthy loan growth, stable profitability, and comfortable capital levels provide support for the long-term investment case.
At the same time, investors should remember that no technical pattern or financial result guarantees future returns. Market conditions, economic developments, interest rate changes, and company performance can all influence future price movement.
Considering both technical and fundamental factors together, Canara Bank currently appears to have a positive short-term outlook and a healthy medium-term business profile. Continued strength above key resistance levels and consistent financial performance may improve investor confidence further over the coming months.
FAQs
1. Is Canara Bank a good stock to buy now?
Canara Bank currently shows improving technical and fundamental strength. The stock trades above its short-term moving averages, while the bank continues to report healthy financial performance. However, investors should wait for confirmation above key resistance levels and consider their own risk tolerance before making any investment decision.
2. What are the important support and resistance levels for Canara Bank?
The major support level is around ₹124, where buyers have stepped in multiple times. Immediate resistance is near ₹129.30, followed by ₹132.86 and ₹135.50, which also coincides with the 200-day moving average.
3. Why is the ₹129.30 level important for Canara Bank stock?
The ₹129.30 level represents a significant Fibonacci resistance and lies close to the descending trendline. A strong close above this level with healthy trading volume could improve the chances of a sustained upward move.
4. What does the RSI indicate for Canara Bank shares?
The Relative Strength Index (RSI) stands at 54.28, which is above the neutral level of 50. This suggests that bullish momentum has improved while the stock is still far from overbought territory.
5. Why is the ADX reading important in this analysis?
The ADX measures the strength of a trend. Although the positive directional indicator (DI+) is above the negative directional indicator (DI-), the ADX value of 6.27 suggests that the current trend is still weak and requires further confirmation.
6. How has Canara Bank improved its fundamentals in recent years?
Canara Bank has significantly improved its asset quality, reduced bad loans, increased profitability, maintained healthy loan growth, and strengthened its capital position. These improvements have enhanced investor confidence in the bank.
7. What are Canara Bank’s latest asset quality numbers?
According to the latest available financial results, Canara Bank reported a Gross NPA of 1.57%, Net NPA of 0.36%, and a Provision Coverage Ratio of 94.76%, reflecting strong improvement in asset quality.
8. Is Canara Bank fundamentally stronger than before?
Yes. Compared to previous years, Canara Bank now has lower non-performing assets, stronger earnings, healthy loan growth, stable profitability, and better capital adequacy. These factors indicate a much stronger financial position.
9. What are the biggest risks for Canara Bank stock?
The key risks include lower interest rates affecting net interest margins, slower economic growth reducing loan demand, a potential increase in bad loans, and policy-related uncertainties that can influence public sector banks.
10. Is Canara Bank better for short-term trading or long-term investing?
Canara Bank offers opportunities for both approaches. Short-term traders may focus on a breakout above ₹129.30, while long-term investors may find the stock attractive because of its improving financial performance, healthier balance sheet, and relatively reasonable valuation.
ALSO READ: Molbio Diagnostics IPO: Everything You Need to Know