
Capri Global Capital Limited has emerged as one of the fastest-growing non-banking financial companies (NBFCs) in India. The company has expanded its loan portfolio across several business segments and has reported strong financial growth over the last few years. At the same time, its stock has delivered healthy returns and continues to attract investor attention.
As of August 6, 2026, Capri Global Capital traded at ₹241.32, up 1.27% during the trading session. The stock remains below its recent 52-week high of ₹264.53, but recent price action shows fresh buying interest after a healthy correction.
This article combines both technical and fundamental analysis. The purpose is to provide an analytical view based on available data. Investors should use this information along with their own research before making any investment decision.
Company Overview
Capri Global Capital Limited operates as a diversified NBFC. The company provides loans to retail customers, businesses, housing borrowers, and micro, small, and medium enterprises (MSMEs). It also has a presence in gold loans and construction finance.
India’s credit market continues to expand due to higher demand from retail customers and businesses. Capri Global Capital has used this opportunity to grow its lending portfolio while keeping asset quality under control.
The company is listed on the National Stock Exchange (NSE) under the symbol CGCL and is part of the NIFTY Smallcap 100 Index.
Business Performance
Capri Global Capital reported another strong quarter in FY27.
The company’s Assets Under Management (AUM) reached ₹40,112 crore, which represents a 62% year-on-year increase. Such growth shows that loan demand remains healthy across its business segments.
Net profit after tax (PAT) stood at ₹353.4 crore, which increased by 102% compared to the same quarter last year. This sharp rise indicates strong earnings growth supported by higher lending activity and better operational performance.
Operating profit reached ₹532 crore, which reflects 71% annual growth.
Profitability also remained healthy.
| Fundamental Metric | Latest Value |
|---|---|
| Assets Under Management (AUM) | ₹40,112 crore |
| PAT Growth | 102% YoY |
| Operating Profit Growth | 71% YoY |
| Return on Average Equity (ROAE) | 19.1% |
| Return on Average Assets (ROAA) | 4.1% |
| Gross NPA | 1.1% |
| Capital Adequacy Ratio | 24.7% |
These figures suggest that the company continues to expand while maintain good profitability and asset quality.
Asset Quality
Asset quality remains one of the most important factors for any NBFC.
Capri Global Capital reported a Gross Non-Performing Asset (GNPA) ratio of 1.1%.
A lower GNPA usually reflects better loan recovery and careful credit selection. This level remains comfortable compared with many companies in the financial sector.
The company also reported a Capital Adequacy Ratio of 24.7%.
A strong capital position provides financial flexibility. It allows the company to expand its lending operations while maintain adequate capital buffers against future risks.
Growth Outlook
Management expects continued business expansion over the next few years.
The company has guided for an AUM target of around ₹65,000 crore by FY28, supported by an expected growth rate above 30% CAGR.
This outlook reflects confidence in retail lending, MSME finance, housing finance, and gold loans.
India’s long-term credit demand also remains positive due to urban growth, higher consumption, and greater financial inclusion.
If these trends continue, Capri Global Capital may continue its growth trajectory over the medium term.
Valuation
The stock currently trades at a Price-to-Earnings (P/E) ratio of 20.33.
For a company that has reported strong earnings growth, this valuation does not appear excessive. However, investors should remember that valuation depends on future earnings growth, credit quality, and economic conditions.
If earnings continue to rise at a healthy pace, current valuation could remain reasonable.
However, slower profit growth may reduce investor enthusiasm.
Market Performance
The company has delivered strong returns across several investment periods.
| Time Period | Stock Return | NIFTY 500 Return |
|---|---|---|
| 1 Week | 9.29% | 1.72% |
| 1 Month | -0.44% | 1.38% |
| Year to Date | 30.16% | -0.64% |
| 1 Year | 29.02% | 4.81% |
| 3 Years | 23.19% | 40.65% |
| 5 Years | 93.77% | 70.24% |
The data shows that the stock has outperformed the broader market over several periods, particularly during the past year and over five years.
Current Market Data
| Market Data | Value |
|---|---|
| Current Price | ₹241.32 |
| Previous Close | ₹238.30 |
| Day High | ₹243.87 |
| Day Low | ₹239.50 |
| VWAP | ₹241.67 |
| Market Capitalisation | ₹23,218.70 crore |
| Free Float Market Cap | ₹9,306.19 crore |
| Traded Volume | 15.59 lakh shares |
| Traded Value | ₹37.67 crore |
| Deliverable Quantity | 66.59% |
Market participation remains healthy as reflected by strong traded volume and good delivery percentage.
Technical Analysis
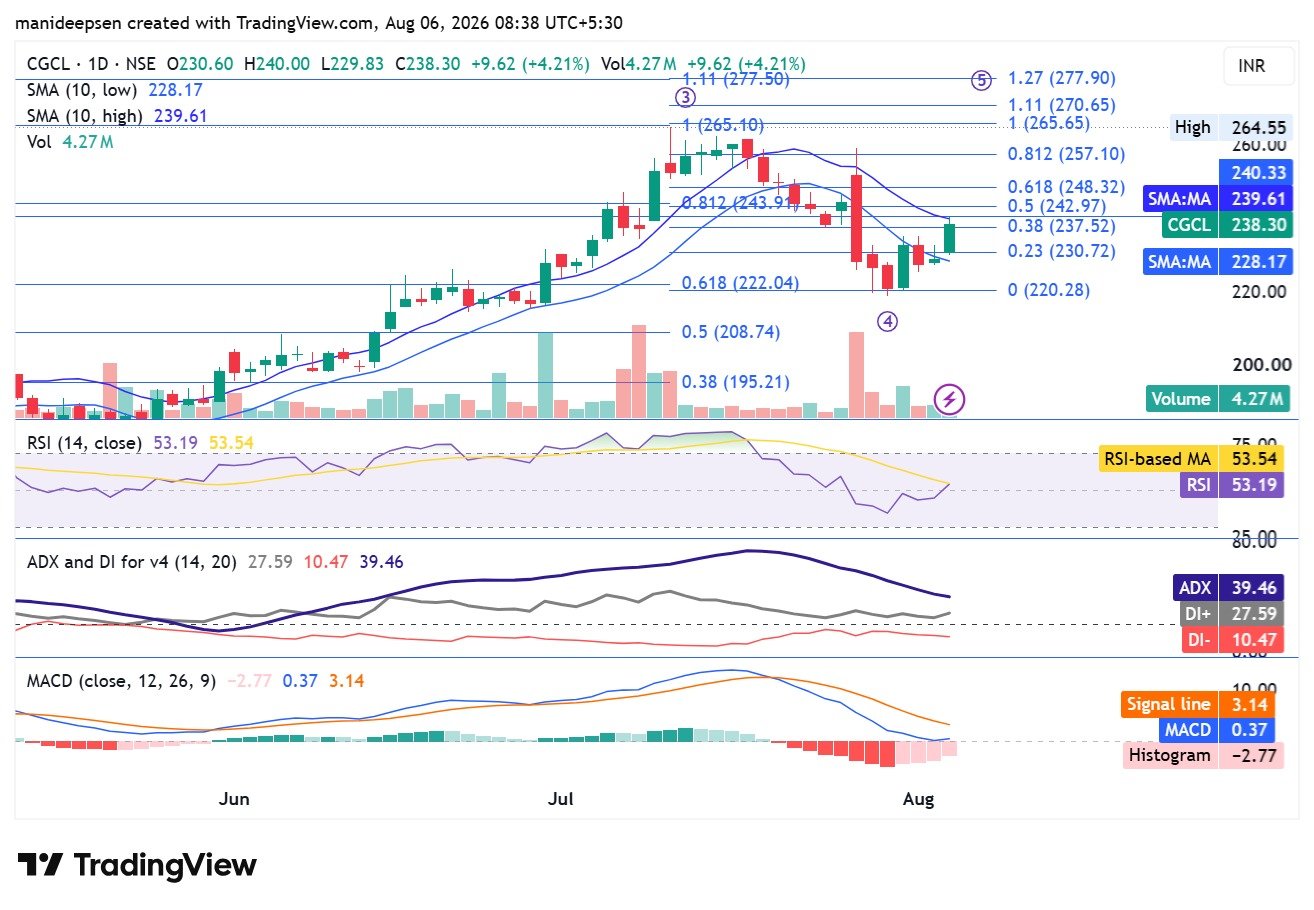
The daily chart presents a constructive picture after a healthy correction.
The stock rallied sharply from around ₹195 to nearly ₹265 before entering a correction phase.
Instead of a sharp breakdown, buyers entered near ₹220, which helped form a higher low.
The latest trading session produced a strong bullish candle supported by higher volume.
This price action suggests that buyers remain active.
Trend Analysis
The broader trend remains positive.
Although the stock has not crossed its recent high, the correction appears orderly rather than aggressive.
The recent recovery indicates that buyers continue to support the stock near important demand zones.
The price has also moved above short-term support levels.
Moving Average Analysis
The chart displays two short-term moving averages.
The stock has reclaimed the 10-period SMA Low at ₹228.17.
The second moving average near ₹239.61 now acts as immediate resistance.
A sustained close above this level could improve short-term momentum.
Fibonacci Analysis
The Fibonacci retracement levels help identify possible support and resistance zones.
| Fibonacci Level | Price |
|---|---|
| 23.6% | ₹230.72 |
| 38.2% | ₹237.52 |
| 50.0% | ₹242.97 |
| 61.8% | ₹248.32 |
| 81.2% | ₹257.10 |
| Previous High | ₹264.53 |
The stock has already reclaimed the 38.2% retracement level, which strengthens the recovery.
The next important challenge lies between ₹243 and ₹248.
RSI Analysis
The Relative Strength Index (RSI) stands at 53.19.
An RSI above 50 generally indicates that buyers hold a slight advantage.
The indicator remains well below the overbought zone.
This leaves room for additional upside if buying momentum continues.
ADX Analysis
The Average Directional Index (ADX) provides information about trend strength.
Current values are:
| Indicator | Value |
|---|---|
| ADX | 39.46 |
| DI+ | 27.59 |
| DI- | 10.47 |
An ADX above 25 usually indicates a strong trend.
DI+ remains well above DI-, which supports the current bullish structure.
Although ADX has eased slightly from earlier highs, the overall trend remains healthy.
MACD Analysis
The MACD indicator continues to improve.
Current values are:
| Indicator | Value |
|---|---|
| MACD | 0.37 |
| Signal Line | 3.14 |
| Histogram | -2.77 |
The MACD line remains below the signal line.
However, the histogram has become less negative.
This often suggests that bearish momentum has weakened.
A bullish crossover would provide stronger confirmation of renewed upward momentum.
Volume Analysis
Volume plays an important role in technical analysis.
Recent sessions have shown improved buying activity.
The latest bullish move also came with healthy volume.
Such price action generally provides greater confidence than a rally supported by weak participation.
Support and Resistance
| Level | Importance |
|---|---|
| ₹220 | Major Support |
| ₹228 | Moving Average Support |
| ₹231 | Fibonacci Support |
| ₹240 | Immediate Resistance |
| ₹243 | First Breakout Level |
| ₹248 | Major Resistance |
| ₹257 | Higher Resistance |
| ₹265 | Previous High |
A close above ₹248 could improve the probability of another move toward the previous high.
Failure to hold above ₹228 may result in another test of ₹220.
Risk Factors
Every investment carries risk.
Capri Global Capital operates in the financial sector, where earnings depend on credit demand, loan recovery, and interest rates.
Any rise in bad loans may affect profitability.
Higher borrowing costs may reduce lending margins.
Changes in RBI regulations may also influence future business performance.
Market volatility may create short-term price fluctuations even when business performance remains healthy.
Opportunities
The company continues to benefit from India’s expanding retail credit market.
Demand for housing finance, MSME loans, and secured lending remains healthy.
A strong capital base provides room for future expansion.
Low gross NPAs indicate disciplined lending practices.
If management achieves its AUM target over the next few years, earnings may continue to improve.
Overall Assessment
Both technical and fundamental indicators present a constructive picture.
The company continues to report strong business growth, healthy profitability, and controlled asset quality.
Its balance sheet remains well capitalised, which supports future expansion.
From a technical perspective, the recent correction appears normal within a larger upward trend.
Momentum indicators have started to improve, although confirmation above ₹243–248 would strengthen the bullish case further.
Investors should continue to monitor quarterly earnings, loan growth, asset quality, and market conditions before making investment decisions.
Conclusion
Capri Global Capital has established itself as a fast-growing NBFC with strong earnings momentum and disciplined execution. Recent financial performance reflects healthy expansion, while low stressed assets and solid capital adequacy provide confidence in the business model.
The stock has corrected from its recent high but has shown signs of renewed buying interest. Technical indicators suggest that momentum has started to improve, though a decisive move above the ₹243–248 zone would provide stronger confirmation of the next upward phase.
From a long-term perspective, continued loan growth, stable asset quality, and successful execution of management’s expansion plans will remain the key drivers for both business performance and shareholder returns. As with any equity investment, investors should consider their financial goals, risk tolerance, and conduct independent research before making investment decisions.
ALSO READ: Nava Ltd Sets Q1 FY27 Earnings Call for August 14, 2026