
Rail Vikas Nigam Limited (RVNL) has shown a sharp change in its recent price pattern, according to the technical report supplied for this analysis. The report places the stock at ₹214.29, after a 6.24% rise, with daily volume at 9.47 million shares. It marks ₹200.78 as the recent swing low, or Wave 0 level, and identifies the current phase as Wave 1.
The report also points to a change in short-term momentum. RVNL has moved above its 10-day simple moving average (SMA) at ₹206.00 and its 20-day SMA at ₹210.54. The 14-day Relative Strength Index (RSI) stands at 51.44, after a move above the 50 level. The MACD histogram has a positive value of +0.32, which the report describes as a bullish signal.
These figures form the main basis of the report’s technical view. It describes the recent price move as a possible shift away from a multi-week corrective decline. The report does not treat the move as proof of a longer-term trend change. Instead, it uses the price structure, volume, moving averages and momentum indicators as evidence for its Wave 1 interpretation.
The recent price move
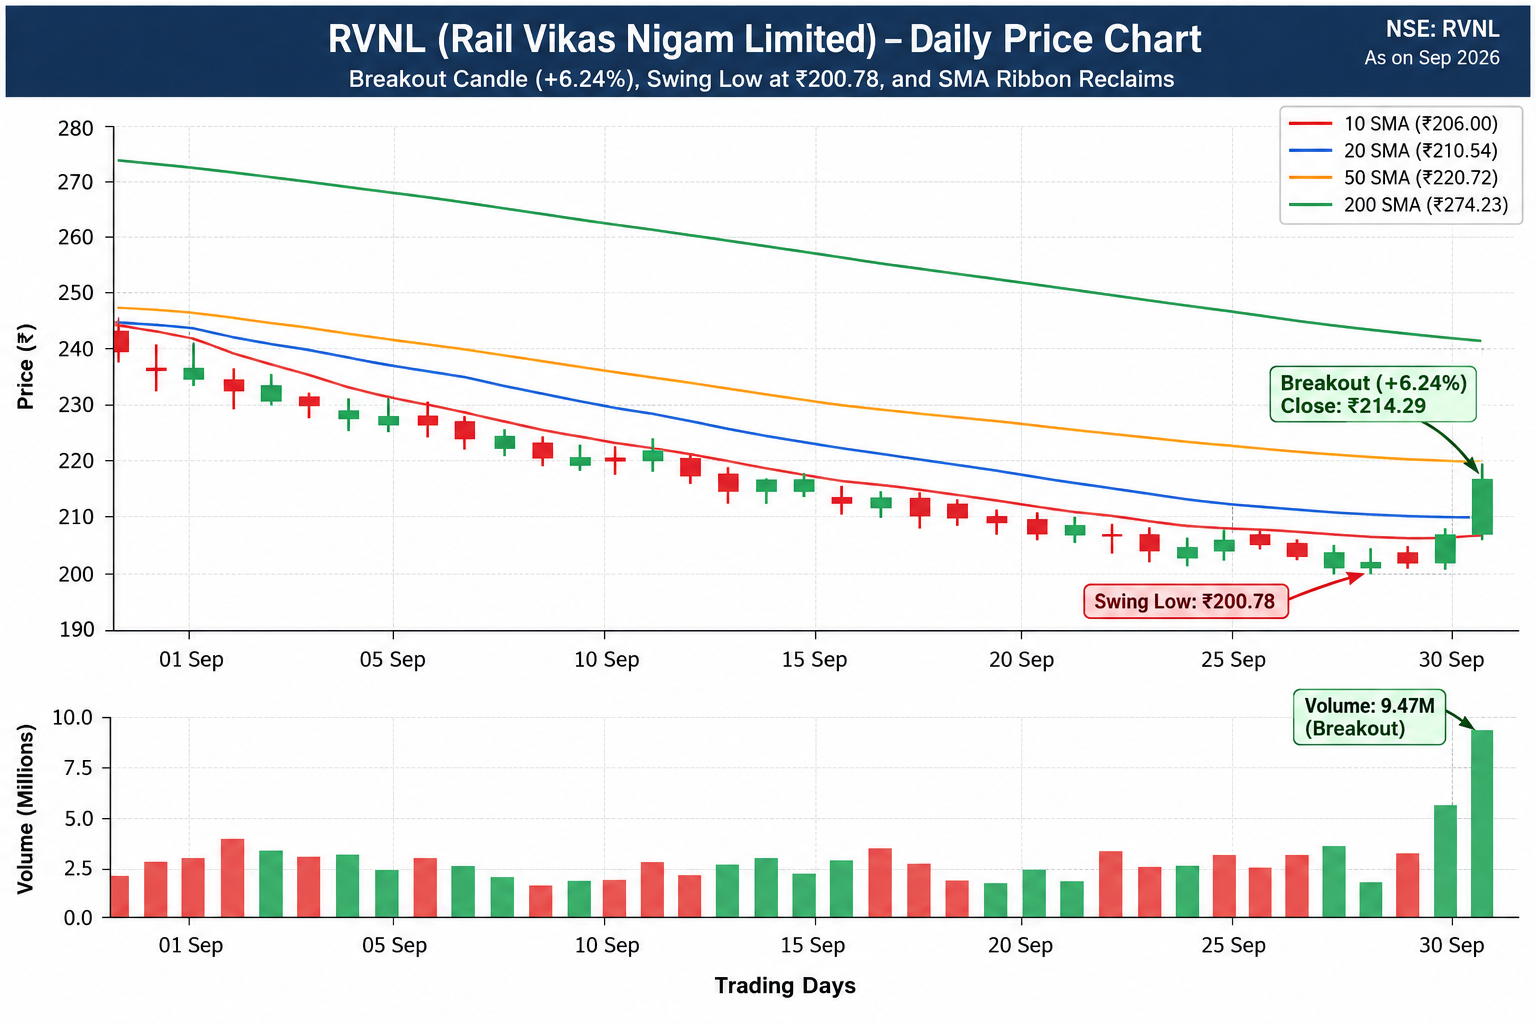
The report states that RVNL rose 6.24% to ₹214.29 on daily volume of 9.47 million shares. It views the volume level as part of the breakout signal. The move also took the stock above the 10-day and 20-day SMAs.
The 10-day SMA stands at ₹206.00, while the 20-day SMA stands at ₹210.54. These two levels are important in the report because the proposed Wave 2 pullback zone also sits close to them.
The chart on page one shows the earlier price decline from higher levels, followed by the move from the ₹200.78 swing low to ₹214.29. The same chart marks the rise above the short-term average levels and the large volume bar that came with the price move.
In simple terms, the report’s view is that the stock first fell to ₹200.78 and then made a strong move higher. It treats that rise as a possible first upward leg in a new Elliott Wave sequence.
What the momentum indicators show
The report uses two main momentum tools: RSI and MACD. The 14-day RSI is 51.44. A value above 50 is treated in the report as a positive shift because it suggests that short-term price momentum has moved above its neutral point.
The MACD also gives a positive signal in the report. The MACD had a bullish Golden Cross below the zero line, while the histogram moved to +0.32. The report treats this combination as evidence of a change in short-term momentum.
The chart on page two shows the RSI move above 50 and the MACD lines close to the lower part of the indicator range. It also shows the positive histogram after the crossover. These charts support the report’s stated interpretation of a short-term momentum shift.
At the same time, these indicators can change as new price data arrives. Their current values therefore describe the situation covered by the report and do not establish a fixed future outcome.
The 50-day and 200-day average levels
A major level in the report is the 50-day SMA at ₹220.72. The report treats this level as the immediate resistance area. RVNL’s reported price of ₹214.29 remains below ₹220.72.
The report states that a daily close above ₹220.72 could create a stronger move towards the 200-day SMA at ₹274.23. It calls the 200-day SMA the main long-term trend benchmark in its analysis.
This gives the report a clear set of reference levels. The current price is ₹214.29, the first major resistance is ₹220.72, and the longer-term average level is ₹274.23.
| Technical reference | Price |
|---|---|
| Current price | ₹214.29 |
| 10-day SMA | ₹206.00 |
| 20-day SMA | ₹210.54 |
| 50-day SMA | ₹220.72 |
| 200-day SMA | ₹274.23 |
| Swing low / Wave 0 | ₹200.78 |
Elliott Wave interpretation
The report’s central technical argument is based on Elliott Wave Theory. It identifies the move from ₹200.78 as the start of Wave 1.
Under this model, Wave 1 is the first upward price leg after the identified Wave 0 low. The report places the current Wave 1 path between ₹200.78 and the ₹214.29–₹220.72 resistance area.
The next stage in the report is Wave 2. It expects a possible shallow correction towards ₹206.00–₹209.10. The report states that, for its Wave 2 structure to remain valid, the price must stay above the ₹200.78 Wave 0 base.
The third stage is Wave 3. The report states that a move above the Wave 1 high could lead to a larger Wave 3 move towards ₹250.00 and ₹274.23. These are projections within the Elliott Wave model used in the report, not assured future prices.
The Wave chart on page two shows this structure in visual form. It marks Wave 0 at ₹200.78, Wave 1 at ₹214.29, the Wave 2 pullback zone at ₹206.00–₹209.10, and a Wave 3 target at ₹250.00. The chart later places the Wave 5 target near ₹274.23.
Fibonacci levels give a second price framework
The report also uses Fibonacci retracement levels to assess possible support during a Wave 2 correction. The calculation starts with the move from ₹200.78 to ₹214.29.
The first major Fibonacci level is the 23.6% retracement at ₹211.10, which the report calls immediate shallow support. The 38.2% level is ₹209.13, with a stated connection to the 20-day SMA at ₹210.54.
The 50% level is ₹207.54, which the report describes as the midpoint. The 61.8% level is ₹205.93, where the report notes a connection with the 10-day SMA at ₹206.00. The deeper 78.6% level is ₹203.67.
Finally, ₹200.78 represents the 100% retracement level. The report treats this price as both the Wave 0 base and the stated invalidation line for its Elliott Wave structure.
| Fibonacci level | Price | Role in the report |
|---|---|---|
| 23.6% | ₹211.10 | Immediate shallow support |
| 38.2% | ₹209.13 | 20-day SMA confluence |
| 50.0% | ₹207.54 | Equilibrium midpoint |
| 61.8% | ₹205.93 | Golden ratio and 10-day SMA confluence |
| 78.6% | ₹203.67 | Deep correction defence line |
| 100.0% | ₹200.78 | Wave 0 base and invalidation line |
The Fibonacci chart on page three places these levels on the same price scale. It shows the proposed support area between the upper retracement levels and the ₹200.78 base, along with higher extension levels for a possible Wave 3 move.
Fundamental factors cited in the report
The report does not rely only on chart signals. It also identifies several fundamental factors that, in its view, may support the longer-term picture for RVNL.
It refers to a robust order book backed by Indian Railways capital expenditure. It also cites line doubling, railway electrification and Vande Bharat manufacturing as areas that may support the company’s business outlook.
The report further identifies RVNL as a Navratna PSU and refers to low leverage and high execution capability as factors that support its long-term value case. These points are part of the report’s own fundamental assessment.
This distinction is important for a legally safer presentation. The report presents these factors as fundamental tailwinds, but the presence of a favourable business factor does not by itself establish a future share-price outcome.
Price zones stated in the report
The final section of the report sets out a specific technical setup. It places the proposed entry zone at ₹206.00–₹210.00, based on a possible Wave 2 pullback near the 10-day and 20-day SMAs.
It gives a stop-loss level of ₹200.00, with the report’s explanation that this sits below the Wave 0 base of ₹200.78. It then gives three price targets: ₹220.70, ₹245.00 and ₹274.00.
The report links ₹220.70 to the 50-day SMA, ₹245.00 to an intermediate Fibonacci extension and ₹274.00 to the 200-day SMA. It also states a risk-reward ratio of approximately 1:3.5 and describes the setup as asymmetric and favourable.
| Parameter | Price or value | Explanation in the report |
|---|---|---|
| Entry zone | ₹206.00–₹210.00 | Possible Wave 2 pullback area |
| Stop-loss | ₹200.00 | Level below the ₹200.78 Wave 0 base |
| Target 1 | ₹220.70 | Near-term 50-day SMA resistance |
| Target 2 | ₹245.00 | Intermediate Fibonacci extension |
| Target 3 | ₹274.00 | Major 200-day SMA level |
| Risk-reward | ~1:3.5 | Ratio stated by the report |
These levels should be read as part of the report’s stated technical setup. They are not a guarantee, forecast certainty or assurance of a particular market result.
What could change the technical view
The most important level for the report’s Elliott Wave structure is ₹200.78. The report calls this the Wave 0 base and the invalidation line. A move below that level would therefore conflict with the Wave structure described in the report.
The other important level is ₹220.72, the 50-day SMA. The report places this level between the current price of ₹214.29 and the higher levels of ₹245.00 and ₹274.00.
A possible pullback also has several reference points. These include ₹211.10, ₹209.13, ₹207.54, ₹205.93 and ₹203.67 under the Fibonacci model. The report places the expected Wave 2 area around ₹206.00–₹209.10, which broadly overlaps with the 38.2%, 50% and 61.8% Fibonacci levels.
This creates a relatively clear technical map, but the map depends on the assumptions used by the report. Elliott Wave analysis is an interpretive method, and future price action can alter the wave count.
A neutral reading of the report
Taken as a whole, the supplied report describes RVNL as a stock that has moved from a ₹200.78 swing low to ₹214.29, with a 6.24% daily rise and 9.47 million shares of volume. It identifies a move above the 10-day SMA of ₹206.00 and 20-day SMA of ₹210.54, while RSI has crossed above 50 and the MACD histogram has reached +0.32.
Its Elliott Wave model labels the current phase as Wave 1. A possible Wave 2 correction is placed at ₹206.00–₹209.10, while ₹200.78 acts as the key invalidation level in that model. A move above the Wave 1 high is linked to possible Wave 3 levels near ₹250.00 and ₹274.23.
The Fibonacci analysis adds further reference points between ₹211.10 and ₹203.67, with ₹200.78 as the full retracement level. The 50-day SMA at ₹220.72 is the immediate resistance cited by the report, while the 200-day SMA at ₹274.23 serves as its long-term trend reference.
The fundamental section adds the report’s view on the RVNL order book, Indian Railways capital expenditure, line doubling, electrification, Vande Bharat production, Navratna status, leverage and execution capability.
Overall, the document presents a defined technical scenario rather than a certainty about RVNL’s future price. Its central framework is built around the ₹200.78 Wave 0 level, ₹214.29 current price, ₹220.72 resistance, ₹206.00–₹209.10 potential pullback zone and ₹250.00–₹274.23 higher projections.
The original report states that it is prepared strictly for educational purposes and does not constitute financial advice or a buy/sell recommendation. The analysis above retains that distinction and presents the report’s stated technical and fundamental views without treating its projections as assured outcomes.
ALSO READ: Jyoti CNC: Growth, Orders and Wave Analysis
20 FAQs on RVNL Technical Analysis
1. What is the current RVNL share price mentioned in the report?
The report places RVNL at ₹214.29, after a 6.24% rise. It also records daily volume of 9.47 million shares.
2. What is the significance of ₹200.78 for RVNL?
The report identifies ₹200.78 as the recent swing low and marks it as the Wave 0 base. It is also described as the key invalidation level for the Elliott Wave structure.
3. Has RVNL started Wave 1 according to the report?
Yes. The report identifies the move from ₹200.78 towards ₹214.29 as the start of Wave 1 under its Elliott Wave analysis.
4. What is the expected Wave 2 level for RVNL?
The report places the possible Wave 2 pullback in the ₹206.00–₹209.10 range. It states that the price should remain above ₹200.78 for the proposed Wave 2 structure to remain valid.
5. What could happen after Wave 1, according to the report?
The report expects a possible Wave 2 correction after Wave 1. If the stock later moves above the Wave 1 high, the report maps a potential Wave 3 move towards ₹250.00 and ₹274.23.
6. What is RVNL’s 10-day moving average?
The report places the 10-day SMA at ₹206.00. This level also forms part of the proposed Wave 2 pullback area.
7. What is RVNL’s 20-day moving average?
The 20-day SMA is ₹210.54 according to the report. The report notes a technical connection between this level and the 38.2% Fibonacci retracement at ₹209.13.
8. What is the 50-day SMA for RVNL?
The report places the 50-day SMA at ₹220.72. It identifies this as the immediate resistance level for the stock.
9. What does the report say about the ₹220.72 level?
A daily close above ₹220.72 is described in the report as a possible signal for stronger momentum towards the 200-day SMA at ₹274.23. This is a technical scenario presented by the report, not a guaranteed outcome.
10. What is RVNL’s 200-day SMA?
The report places the 200-day SMA at ₹274.23 and uses it as the main long-term trend reference in its analysis.
11. What does the RSI indicate in the report?
The 14-day RSI stands at 51.44. The report highlights the move above 50 as a positive change in short-term momentum.
12. What does the MACD indicate?
The report states that the MACD produced a bullish Golden Cross below the zero line and that the MACD histogram reached +0.32. It treats this as another sign of improving momentum.
13. What are the key Fibonacci levels for RVNL?
The report identifies several Fibonacci retracement levels: ₹211.10 at 23.6%, ₹209.13 at 38.2%, ₹207.54 at 50%, ₹205.93 at 61.8%, ₹203.67 at 78.6%, and ₹200.78 at 100%.
14. Which Fibonacci level is linked to the 10-day SMA?
The 61.8% Fibonacci retracement is ₹205.93, which the report places close to the 10-day SMA at ₹206.00.
15. Which Fibonacci level is linked to the 20-day SMA?
The 38.2% Fibonacci retracement is ₹209.13. The report identifies a technical confluence with the 20-day SMA at ₹210.54.
16. What fundamental factors does the report identify for RVNL?
The report cites a robust order book backed by Indian Railways capital expenditure, along with line doubling, electrification and Vande Bharat manufacturing. It also mentions RVNL’s Navratna PSU status, low leverage and high execution capability.
17. What entry zone does the report mention?
The report gives an entry zone of ₹206.00–₹210.00. It connects this range with a possible Wave 2 pullback near the 10-day and 20-day SMAs.
18. What stop-loss level does the report mention?
The report gives a ₹200.00 stop-loss. It places this below the ₹200.78 Wave 0 base used in its Elliott Wave framework.
19. What price targets are mentioned in the report?
The report lists ₹220.70 as Target 1, ₹245.00 as Target 2 and ₹274.00 as Target 3. It associates these levels with the 50-day SMA, an intermediate Fibonacci extension and the 200-day SMA, respectively.
20. Is the RVNL analysis a buy or sell recommendation?
No. The original report states that it is prepared strictly for educational purposes and is not financial advice or a buy/sell recommendation. Its entry levels, stop-loss and targets describe the technical setup presented by the report and should not be treated as assured outcomes.