
A technical research report dated September 21, 2026, identifies five Indian stocks that were close to important short-term resistance levels: Cohance Lifesciences, Carborundum Universal, Usha Martin, EPack Prefab Tech and Mankind Pharma.
The analysis covers 62 stocks and selects these five for closer study. The common features are strong daily price action, higher trading volume, a weekly RSI in the 50–65 range, and prices close to their respective 20-day highs. The analysis also seeks to avoid stocks that have already seen an unusually sharp one-day rise.
The result is a group of stocks described as pre-breakout setups. In simple terms, the prices were close to levels that the analysis treats as resistance. A move above those levels could, under the stated technical scenarios, open the way toward higher price zones.
These levels are part of a technical framework. They should not be treated as certain future prices or as a guarantee of a breakout.
The Five Names at a Glance
| Rank | Stock | Price | 1-Day Change | Daily Volume | Breakout Level | Technical View |
|---|---|---|---|---|---|---|
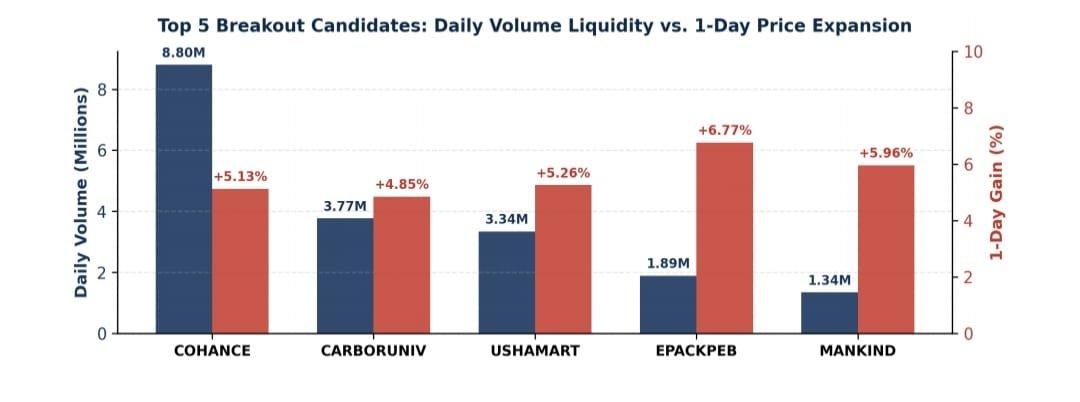
| 1 | Cohance Lifesciences | ₹460.45 | +5.13% | 8,798,590 | ~₹465 | Pre-Breakout |
| 2 | Carborundum Universal | ₹1,178.90 | +4.85% | 3,767,733 | ~₹1,190 | Pre-Breakout |
| 3 | Usha Martin | ₹533.90 | +5.26% | 3,336,342 | ~₹540 | Pre-Breakout |
| 4 | EPack Prefab Tech | ₹241.57 | +6.77% | 1,887,825 | ~₹245 | Pre-Breakout |
| 5 | Mankind Pharma | ₹2,437.80 | +5.96% | 1,342,757 | ~₹2,460 | Pre-Breakout |
A notable feature is the small distance between the reported prices and the stated breakout levels. Each stock was less than about 1.5% below its respective level on the report date.
That makes the central theme of the analysis quite clear: these were stocks close to resistance, rather than stocks that had already moved far beyond it.
Cohance Lifesciences: The Highest Volume Among the Five
Cohance Lifesciences, or COHANCE, had a reported price of ₹460.45 after a 5.13% rise on the day. Its daily volume was 8,798,590 shares, the highest among the five stocks.
The analysis places the 20-day high near ₹465. It describes the price structure as a high-volume base near that level and classifies the stock as a pre-breakout setup.
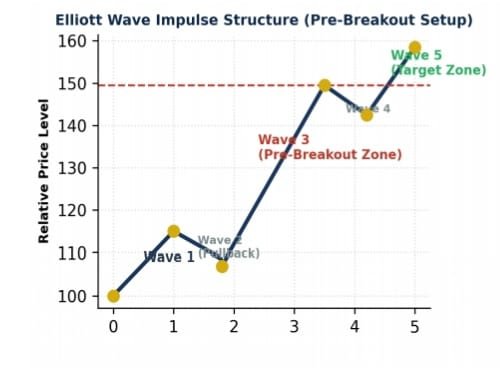
The Elliott Wave interpretation refers to a possible Wave 3 pre-breakout impulse. Under the stated technical scenario, a sustained move above ₹465 could lead toward a target zone of ₹488–₹525.
The price and volume combination is a key part of the setup. The stock had already posted a sizeable one-day rise, but the analysis still placed it within the pre-breakout group rather than the already-extended group.
That distinction matters. The analysis does not say that the ₹465 level will definitely break. It identifies that level as the point above which the stated technical scenario becomes relevant.
Carborundum Universal: Tight Consolidation Near ₹1,190
Carborundum Universal, or CARBORUNIV, stood at ₹1,178.90 after a 4.85% one-day rise. Its reported daily volume was 3,767,733 shares.
The key level in the analysis is approximately ₹1,190, which is also described as the stock’s 20-day high.
The report characterises the chart as a large-cap tight-range compression setup. Its Elliott Wave interpretation refers to a possible Wave 3 consolidation resolution.
Under the stated scenario, a sustained move above ₹1,190 could place the stock in a target zone of ₹1,240–₹1,350.
The report does not provide a separate fundamental valuation model to support those target levels. They are therefore best understood as technical price scenarios within the framework of the analysis.
Usha Martin: Price Structure Above Key Averages
Usha Martin, or USHAMART, was reported at ₹533.90, with a 5.26% rise for the day. Daily volume stood at 3,336,342 shares.
The analysis describes an ascending base above the 20-day and 50-day simple moving averages. The stated breakout level is approximately ₹540.
The technical interpretation refers to a possible Wave 3 / Wave 5 accumulation structure. If the price clears ₹540 under the report’s stated scenario, the target zone is ₹565–₹610.
The position above the two moving averages is an important part of the setup. It suggests that the analysis is looking at a stock that remains above key short-term trend references while it approaches resistance.
At the same time, the report does not contain enough long-term price history to establish the Elliott Wave classification as a definitive long-term wave count.
EPack Prefab Tech: Strongest One-Day Rise Among the Five
EPACKPEB had the strongest one-day percentage rise among the five selected names. Its reported price was ₹241.57, up 6.77%, with daily volume of 1,887,825 shares.
The analysis identifies approximately ₹245 as the relevant 20-day high and breakout level.
The chart structure is described as a volume-backed range expansion. The Elliott Wave interpretation refers to possible Wave 3 momentum acceleration.
A move above ₹245 is associated with a target zone of ₹258–₹275.
EPACKPEB is also listed in the wider 20-stock analysis as a pre-breakout setup. The report specifically notes the strong volume gain near the 20-day peak.
The 6.77% one-day move is worth noting because it places the stock closer to the upper end of the daily moves among the five names. Yet the analysis still considers it sufficiently close to its recent range to remain within the pre-breakout category.
Mankind Pharma: A High-Liquidity Setup
Mankind Pharma, or MANKIND, stood at ₹2,437.80 after a 5.96% one-day rise. Its reported daily volume was 1,342,757 shares.
The analysis identifies approximately ₹2,460 as the breakout level and describes the stock as a high-liquidity, steady-advance setup.
Its Elliott Wave interpretation refers to Wave 3 primary trend continuation.
Under the stated technical scenario, a move above ₹2,460 could lead toward a target zone of ₹2,580–₹2,780.
The report highlights the stock’s large-cap pharmaceutical profile and its liquidity. It does not, however, provide a detailed review of earnings, valuation, cash flow or the wider pharmaceutical sector. Those factors therefore remain outside the scope of this particular analysis.
Why These Stocks Appear Close to a Breakout
The technical structure behind the five names follows a simple sequence.
The stock first needs to show an established upward trend. It then needs to remain close to its recent high rather than fall well below it. Higher volume adds another layer of confirmation, while the RSI range provides a measure of momentum.
The analysis uses a daily close above the 20-day and 50-day SMA as part of its trend condition.
It also requires the daily close to remain at least 95% of the 20-day high. This condition is intended to identify stocks that remain close to their recent price ceiling.
The weekly RSI range of 50–65 forms another part of the technical framework. The report treats this as a momentum zone before the more extreme levels associated with overbought conditions.
Daily volume above the 20-day volume SMA is used as an additional sign of market participation.
Taken together, these conditions create the basic structure:
Trend strength + proximity to resistance + momentum + volume
The analysis then looks for a possible move through the resistance level.
The Elliott Wave Interpretation Requires Context
The report uses Elliott Wave language throughout its analysis. It refers to possible Wave 3, Wave 5 and consolidation structures for the five stocks.
There is an important qualification within the report itself. A single-day technical output does not provide the multi-year price history normally required for a detailed Elliott Wave count.
This means that terms such as “Wave 3 pre-breakout impulse” or “Wave 3 primary trend continuation” are best understood as interpretations of the current technical structure.
They should not be treated as independently established long-term wave counts.
This distinction also helps separate the measurable data from the interpretation. Price, volume and percentage change are direct figures in the report. The Elliott Wave labels are analytical interpretations based on those figures and the available price structure.
The Broader 20-Stock Picture
The wider analysis covers 20 stocks and places them into four categories: Already Extended, Pre-Breakout, Confirmation Required and Weak Setup.
The “Already Extended” group contains six stocks that had already recorded very large one-day gains.
Protean rose 20.00% to ₹588.35. Ashiana rose 14.32% to ₹405.55. Surajest rose 12.57% to ₹216.41. Zota rose 12.52% to ₹1,287.80. Jaykay rose 12.19% to ₹187.56. Tarsons rose 11.50% to ₹341.30.
The analysis considers such sharp one-day moves as evidence of short-term extension.
| Stock | Price | 1-Day Change | Volume | Classification |
|---|---|---|---|---|
| PROTEAN | ₹588.35 | +20.00% | 7,996,314 | Already Extended |
| ASHIANA | ₹405.55 | +14.32% | 1,011,498 | Already Extended |
| SURAJEST | ₹216.41 | +12.57% | 2,686,641 | Already Extended |
| ZOTA | ₹1,287.80 | +12.52% | 401,249 | Already Extended |
| JAYKAY | ₹187.56 | +12.19% | 4,432,715 | Already Extended |
| TARSONS | ₹341.30 | +11.50% | 5,943,251 | Already Extended |
| AAATECH | ₹94.16 | +8.29% | 118,069 | Confirmation Required |
| EPACKPEB | ₹241.57 | +6.77% | 1,887,825 | Pre-Breakout |
| SUNDROP | ₹707.95 | +6.72% | 220,799 | Confirmation Required |
| HARSHA | ₹467.90 | +6.23% | 776,655 | Pre-Breakout |
| MANKIND | ₹2,437.80 | +5.96% | 1,342,757 | Pre-Breakout |
| SUDARCOL | ₹402.00 | +5.90% | 13,352 | Weak Setup |
| CONCORDBIO | ₹1,579.40 | +5.69% | 561,323 | Pre-Breakout |
| SUPRIYA | ₹957.70 | +5.67% | 538,805 | Pre-Breakout |
| USHAMART | ₹533.90 | +5.26% | 3,336,342 | Pre-Breakout |
| COHANCE | ₹460.45 | +5.13% | 8,798,590 | Pre-Breakout |
| KILITCH | ₹201.02 | +5.00% | 46,481 | Weak Setup |
| STALLION | ₹231.50 | +4.99% | 440,410 | Confirmation Required |
| INDOAMIN | ₹132.87 | +4.99% | 118,165 | Confirmation Required |
| CARBORUNIV | ₹1,178.90 | +4.85% | 3,767,733 | Pre-Breakout |
The Confirmation Group
Four stocks were placed in the Confirmation Required category: AAATECH, SUNDROP, STALLION and INDOAMIN.
AAATECH was at ₹94.16, with a 8.29% daily rise and volume of 118,069 shares. The analysis says the price move needs stronger volume follow-through.
SUNDROP stood at ₹707.95, up 6.72%, with volume of 220,799 shares. It was close to resistance, but the report described its volume as moderate.
STALLION was at ₹231.50, up 4.99%, with volume of 440,410 shares. The report described the structure as controlled but said a breakout candle was still awaited.
INDOAMIN stood at ₹132.87, up 4.99%, with volume of 118,165 shares. It was close to its 20-day high, but the report described the volume expansion as modest.
The common point is that these four stocks showed some favourable technical conditions but did not meet the report’s full pre-breakout classification.
The Two Weak Setups
The analysis placed SUDARCOL and KILITCH in the Weak Setup category.
SUDARCOL was at ₹402.00, up 5.90%, but daily volume was only 13,352 shares. The report links this low volume with liquidity concerns.
KILITCH was at ₹201.02, up 5.00%, with daily volume of 46,481 shares. The report points to thin volume and possible execution slippage.
This comparison is useful because it shows that the analysis does not rely on price gains alone. A strong daily move without sufficient volume does not automatically result in a pre-breakout classification.
The Fundamental Data Is Not Part of the Five-Stock Assessment
The report states that its broader framework can track a range of financial measures. These include net sales, operating profit margin, profit before tax, profit after tax, total assets, debt-to-equity, net working capital, EPS, ROCE, RONW and current ratio.
It also refers to operating, investing and financing cash flow, order and trade book information, VWAP and shareholding data related to promoters, FIIs and DIIs.
However, the three-page analysis does not provide the detailed figures for these measures for the five selected stocks.
As a result, the report cannot by itself establish whether the five companies are attractively or unattractively valued from a fundamental perspective. It is primarily a technical study.
Understanding the Five Breakout Levels
The key levels identified in the report are:
| Stock | Reported Price | Breakout Level | Target Scenario |
|---|---|---|---|
| COHANCE | ₹460.45 | ₹465 | ₹488–₹525 |
| CARBORUNIV | ₹1,178.90 | ₹1,190 | ₹1,240–₹1,350 |
| USHAMART | ₹533.90 | ₹540 | ₹565–₹610 |
| EPACKPEB | ₹241.57 | ₹245 | ₹258–₹275 |
| MANKIND | ₹2,437.80 | ₹2,460 | ₹2,580–₹2,780 |
The breakout levels are not entry recommendations. They are the resistance points used by the report for its technical scenarios.
Likewise, the target ranges are not guaranteed outcomes. They represent the price zones described by the analysis if the respective breakout scenario develops.
Important Limits of the Analysis
The report does not provide a complete trading plan. It does not set out a fixed stop-loss method, position-size formula or maximum acceptable loss.
It also does not provide detailed rules for a false breakout, a gap-up move, a breakout with weak volume or a failure to hold above resistance.
The report does not include a detailed assessment of company earnings, valuation, cash flow, sector conditions or broader market direction for the five stocks.
These gaps do not invalidate the technical observations. They simply define the limits of what can be concluded from this particular report.
Final View
The September 21, 2026 analysis identifies five stocks with a similar technical structure: Cohance Lifesciences, Carborundum Universal, Usha Martin, EPack Prefab Tech and Mankind Pharma.
All five were close to their reported 20-day highs and had recorded positive one-day moves. Their daily volumes also met the conditions used in the analysis, while their weekly RSI fell within the stated 50–65 range.
The key levels were ₹465 for COHANCE, ₹1,190 for CARBORUNIV, ₹540 for USHAMART, ₹245 for EPACKPEB and ₹2,460 for MANKIND.
The associated target scenarios were ₹488–₹525, ₹1,240–₹1,350, ₹565–₹610, ₹258–₹275 and ₹2,580–₹2,780, respectively.
The analysis was prepared by Manideep Sen and is presented as educational technical research rather than financial advice.
The central message is straightforward: these five stocks had technical structures that placed them close to important resistance levels on the report date. The analysis identifies what could happen if those levels are cleared, but it does not establish that a breakout will occur.
For that reason, the figures are best treated as a dated technical snapshot, rather than a promise of future price action. Any later assessment would require fresh market data and a separate review of price behaviour, liquidity, company-specific information and market conditions.
ALSO READ: Crude Oil Falls: Why India Could Get Major Relief
Frequently Asked Questions
1. Which five stocks are highlighted in the analysis?
The five stocks are Cohance Lifesciences, Carborundum Universal, Usha Martin, EPack Prefab Tech and Mankind Pharma. The analysis places all five in the pre-breakout category.
2. What is the reported price of Cohance Lifesciences?
Cohance Lifesciences was reported at ₹460.45, after a 5.13% rise for the day.
3. What is the breakout level for Cohance Lifesciences?
The analysis identifies approximately ₹465 as the breakout level. Its stated technical target zone is ₹488–₹525.
4. What is the reported price of Carborundum Universal?
Carborundum Universal was reported at ₹1,178.90, with a 4.85% one-day rise.
5. What level is important for Carborundum Universal?
The report places the breakout level near ₹1,190. Its technical scenario gives a target zone of ₹1,240–₹1,350.
6. What is the setup for Usha Martin?
Usha Martin was at ₹533.90, after a 5.26% rise. The analysis describes an ascending base above the 20-day and 50-day simple moving averages.
7. What is the breakout level for Usha Martin?
The stated breakout level is approximately ₹540. The report gives a technical target zone of ₹565–₹610.
8. What is the setup for EPack Prefab Tech?
EPACKPEB was at ₹241.57, with a 6.77% one-day rise. The report describes the structure as a volume-backed range expansion.
9. What is the breakout level for EPACKPEB?
The analysis identifies approximately ₹245 as the breakout level. Its stated target zone is ₹258–₹275.
10. What is the reported price of Mankind Pharma?
Mankind Pharma was reported at ₹2,437.80, after a 5.96% one-day rise.
11. What is the breakout level for Mankind Pharma?
The report identifies approximately ₹2,460 as the breakout level. Its technical target scenario is ₹2,580–₹2,780.
12. Why are these stocks described as pre-breakout setups?
The five stocks were close to their 20-day highs and showed positive price action, higher volume and weekly RSI values within the stated 50–65 range. The analysis treats these conditions as signs of a possible breakout setup.
13. Does a pre-breakout setup mean a breakout is confirmed?
No. A pre-breakout classification only describes the technical position at the time of the analysis. It does not establish that the stock will cross its stated resistance level.
14. Why is trading volume important in this analysis?
Volume is used as a measure of market participation. The analysis looks for daily volume above the 20-day volume SMA. Higher volume alongside price strength forms part of the technical confirmation.
15. What role does the 20-day high play?
The 20-day high acts as a short-term resistance reference. The five selected stocks were close to this level, which is why the analysis treats a move above it as an important technical event.
16. Why does the analysis use the 20-day and 50-day moving averages?
The moving averages help describe the short-term and medium-term price trend. A daily close above both averages forms part of the conditions used in the technical analysis.
17. What does the weekly RSI range of 50–65 indicate?
The analysis uses a weekly RSI between 50 and 65 as its preferred momentum range. It treats this zone as a period of positive momentum without the more extreme conditions associated with higher RSI readings.
18. What does the Elliott Wave section say?
The analysis assigns possible Wave 3 or Wave 5 structures to the five stocks. For example, COHANCE is described as a possible Wave 3 pre-breakout impulse, while MANKIND is described as a possible Wave 3 primary trend continuation.
These descriptions are technical interpretations rather than confirmed long-term wave counts.
19. Are the target prices guaranteed?
No. The target figures are technical scenarios stated in the report. They do not guarantee that a stock will reach those levels. The analysis also does not provide a complete rule for stop-loss placement, position size or the handling of false breakouts.
20. Who prepared the analysis?
The analysis was prepared by Manideep Sen and is presented as educational technical research rather than financial advice. The figures relate to the market snapshot dated September 21, 2026.
ALSO READ: Crude Oil Falls: Why India Could Get Major Relief