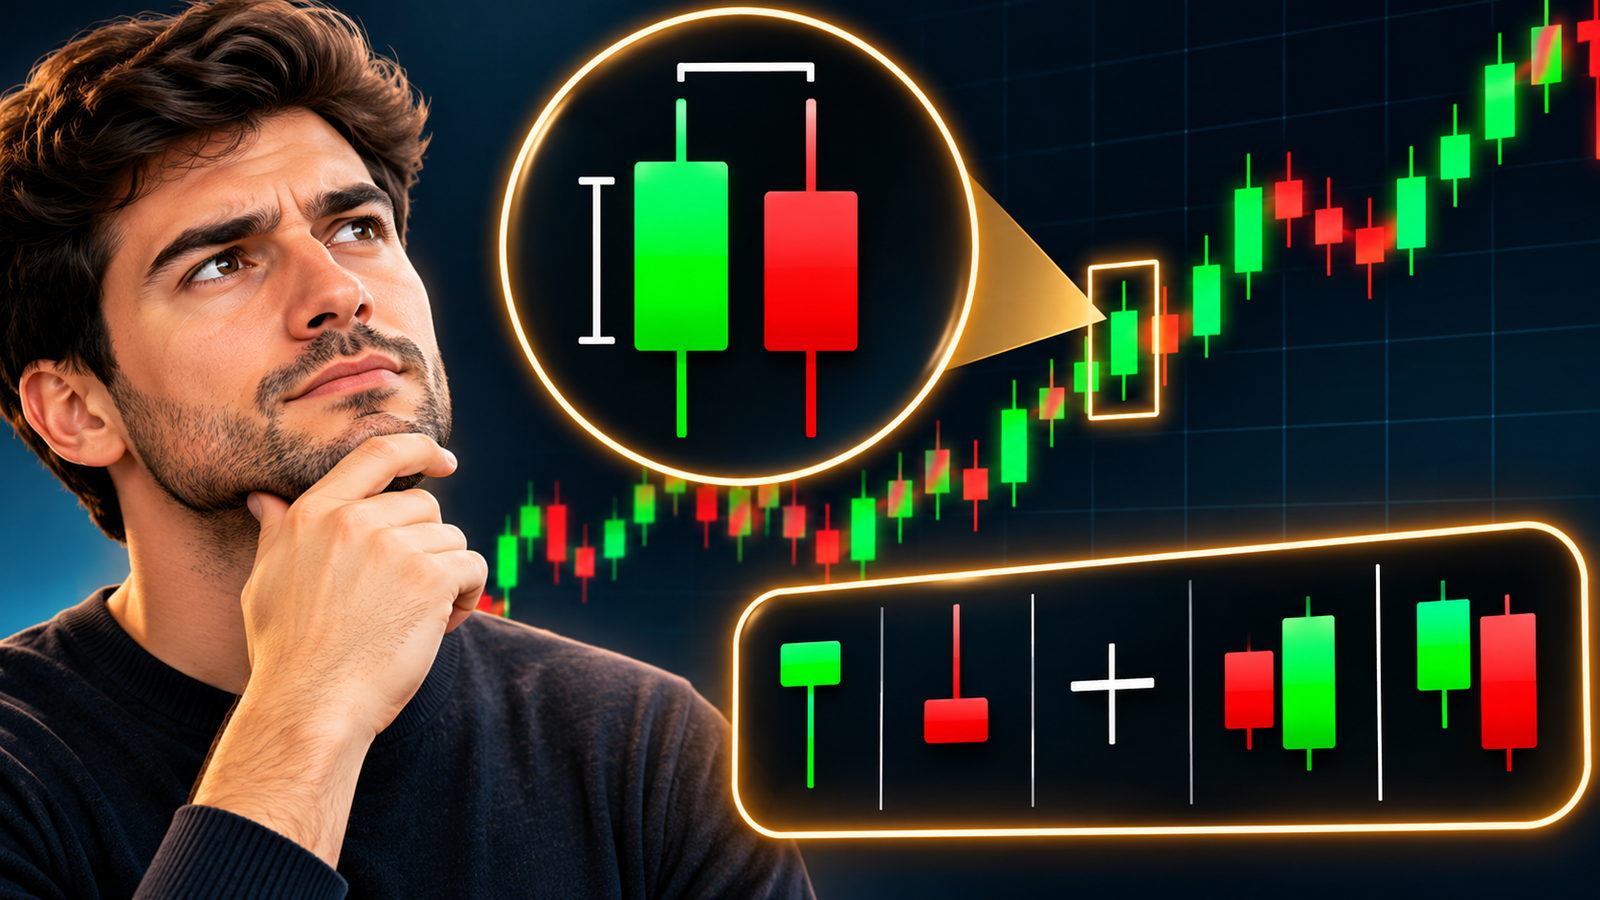
A candlestick chart is a simple tool that helps traders understand price changes in the stock market, forex market and cryptocurrency market. It shows how the price of an asset moves over a set period.
Each candle tells us four important things: the opening price, closing price, highest price and lowest price. These details help traders understand whether buyers or sellers had more control during that period.
At first, a candlestick chart may look confusing. However, once you understand its basic parts and common patterns, it becomes much easier to read.
What Is a Candlestick Chart?
A candlestick chart is a type of price chart. It uses red and green candles to show price changes over time. Each candle represents a set period, such as one minute, one hour or one day.
For example, a candle on a daily chart shows how the price changed during one trading day. It also shows the highest and lowest prices reached during that day.
By look at these candles, traders can get a better idea of market activity and possible price direction.
Parts of a Candlestick
Every candlestick has two main parts: the body and the wick. Both parts give useful information about price movement.
The Body
The body is the thick rectangular part of the candle. It shows the difference between the opening price and the closing price.
If the candle is green, the closing price is higher than the opening price. If the candle is red, the closing price is lower than the opening price.
A large body often shows a strong price move. A small body suggests that the price did not change much during that period.
The Wick
The wick is the thin line above or below the body. It is also called a shadow.
The upper wick shows the highest price reached during that period. The lower wick shows the lowest price.
A long upper wick may suggest that sellers pushed the price down after it reached a higher level. A long lower wick may suggest that buyers pushed the price up after it fell.
What Do Green and Red Candles Mean?
Green Candle: Price Increase
A green candle is also called a bullish candle. It means the asset closed at a higher price than its opening price.
For example, if a stock opens at $100 and closes at $110, the candle is green. This shows that buyers had more control during that period.
Red Candle: Price Decrease
A red candle is also called a bearish candle. It means the asset closed at a lower price than its opening price.
For example, if a stock opens at $100 and closes at $90, the candle is red. This shows that sellers had more control during that period.
Green and red candles help traders understand whether the price has moved up or down.
What Are Candlestick Time Frames?
A time frame tells you how much time one candle represents. Traders can choose different time frames based on their needs.
On a one-minute chart, each candle represents one minute. On a five-minute chart, each candle represents five minutes. A fifteen-minute candle shows price changes over fifteen minutes.
An hourly chart has one candle for each hour, while a daily chart has one candle for each trading day. On a weekly chart, each candle represents one week.
Short time frames show quick price changes. Longer time frames give a wider view of the market. The right choice depends on the trader’s plan and goals.
Five Common Candlestick Patterns
Candlestick patterns help traders understand possible changes in price direction. However, no pattern can promise that the price will move in a certain way.
Hammer
A hammer has a small body and a long lower wick. It often appears after a price fall.
This pattern may suggest that buyers have started to push the price up. It can be a sign of a possible upward move, but traders should wait for confirmation from later candles.
Shooting Star
A shooting star has a small body and a long upper wick. It often appears after a price rise.
This pattern may suggest that sellers have started to take control. It can warn traders about a possible price fall.
Doji
A Doji is a candle where the opening and closing prices are almost the same. Its body is very small, and it may have long or short wicks.
A Doji shows that buyers and sellers are not clearly in control. It often points to market indecision. Its meaning depends on where it appears on the chart.
Bullish Engulfing
A bullish engulfing pattern has two candles. The first candle is red, while the second is green. The body of the green candle covers the body of the red candle.
This pattern may show a shift from seller control to buyer control. It often appears after a price fall and may signal a possible upward move.
Bearish Engulfing
A bearish engulfing pattern also has two candles. The first candle is green, while the second is red. The body of the red candle covers the body of the green candle.
It may show that sellers have taken control from buyers. This pattern often appears after a price rise and may signal a possible downward move.
How to Read a Candlestick Chart
Start by look at the overall price direction. Check whether the market is in an upward trend, a downward trend or moving sideways.
Next, look at the red and green candles. A series of green candles may show strong buying activity, while several red candles may show strong selling activity.
Pay attention to the size of each candle’s body and wick. Large bodies show stronger price moves, while long wicks may show that the price faced pressure at certain levels.
You should also learn about support and resistance. Support is a price level where buyers may step in and stop a further fall. Resistance is a level where sellers may step in and stop a further rise.
Look for common candlestick patterns near these levels. A pattern near support or resistance may offer useful information about a possible price change.
It is also helpful to check trading volume. Volume shows how much of an asset was traded during a certain period. A strong price move with high volume may carry more weight than a move with low volume.
Before you make a trade, wait for the next candle to confirm the possible direction. Do not rely on just one candle or pattern.
Common Mistakes to Avoid
New traders often make quick decisions after they see a green or red candle. However, one candle does not tell the full story. Always look at the wider market trend before you make a choice.
Another common mistake is to ignore support, resistance and volume. These factors can help you understand whether a price move has real strength.
Do not assume that every hammer, Doji or engulfing pattern will lead to a reversal. Candlestick patterns can fail, so it is important to use proper risk management.
Conclusion
A candlestick chart is a useful tool that helps traders understand price changes and market activity. Each candle shows the opening, closing, highest and lowest prices for a set period.
Once you understand the body, wick, candle colours, time frames and common patterns, you can read a chart with more confidence.
Start with the basics and practise with simple charts. Learn about trends, support, resistance and volume before you try advanced trading methods. Most importantly, remember that candlestick patterns do not guarantee future price moves. Use them with care and always manage your risk.
ALSO READ: When Paying Off Debt Is Better Than Investing First