
Shares of Ola Electric Mobility Limited saw a strong rise during today’s trading session. The stock started the day near ₹40 and later moved sharply higher as buying activity increased across the market.
During the session, the share price touched a high of ₹43.81 after falling to a low of ₹39.14 earlier in the day. The stock finally closed at ₹43.74, very close to the highest level of the session. This strong closing has attracted attention from traders and investors.
Today’s movement was important because the stock showed a sharp recovery after early weakness. Many traders were watching closely to see whether the stock could hold above key price zones. Once buyers entered strongly, the direction changed quickly.
Early Weakness Created Uncertainty
The stock opened at ₹40, which was close to the previous closing price of ₹39.83. In the first part of the trading session, selling pressure pushed the stock lower.
As the price dropped to ₹39.14, some traders expected more weakness. Usually, when a stock falls below an important psychological level like ₹40, market sentiment can turn negative very fast.
However, the weakness did not continue for long. Buyers entered near the lower levels and slowly started pushing the price upward again. This recovery became one of the biggest highlights of the day.
Sharp Recovery Changed Market Sentiment
After touching the day’s low, Ola Electric shares started gaining momentum. The stock moved higher step by step as buying activity increased.
Once the price crossed important levels during the session, trader confidence improved further. More market participants entered fresh positions, which helped the stock maintain its upward movement.
The recovery from lower levels showed that buyers were active and ready to support the stock. Such movements are closely watched because they can sometimes signal improving short-term sentiment.
The speed of the recovery also surprised many traders. A stock moving from the day’s low to near the day’s high within the same session usually attracts strong market attention.
Closing Near Day’s High Is Seen as Positive
One of the strongest signals from today’s session was the closing price. Ola Electric closed at ₹43.74, which was very close to the intraday high of ₹43.81.
In stock market trading, closing near the day’s high is often considered a positive sign. It usually means buyers remained active till the final hours of trading.
This kind of closing pattern may indicate that market participants expect further movement in the coming sessions. However, traders also know that the next session becomes very important after a strong rally.
If the stock continues holding higher levels, confidence may improve further. On the other hand, profit booking can also create short-term volatility.
Increased Trading Interest Seen in the Stock
Today’s sharp move also brought higher market attention toward Ola Electric shares. Whenever a stock shows strong momentum in a short period, both retail traders and institutional investors begin tracking it more closely.
Momentum-based traders often look for such movements because they can create short-term trading opportunities. Stocks that recover strongly from lower levels and close near the top of the day’s range are usually watched carefully in the next session.
Higher price movement often increases trading activity as well. Traders become more active when they see strong volatility and quick directional moves during the day.
ALSO READ: CMR Green IPO Draws Strong Early Market Demand
Ola Electric Remains Important in India’s EV Sector
Ola Electric continues to remain one of the most discussed companies in India’s electric vehicle industry. The EV sector itself is growing rapidly as more consumers shift toward electric mobility solutions.
Because of this growing interest, stocks related to electric vehicles often see sharp price reactions in the market. Investors regularly track developments connected to EV demand, production growth, expansion plans, and future opportunities in the sector.
Ola Electric remains closely linked with the broader EV growth story in India. This is one of the reasons why movements in the stock continue to attract market attention.
Technical Analysis: What Charts Are Indicating for Ola Electric
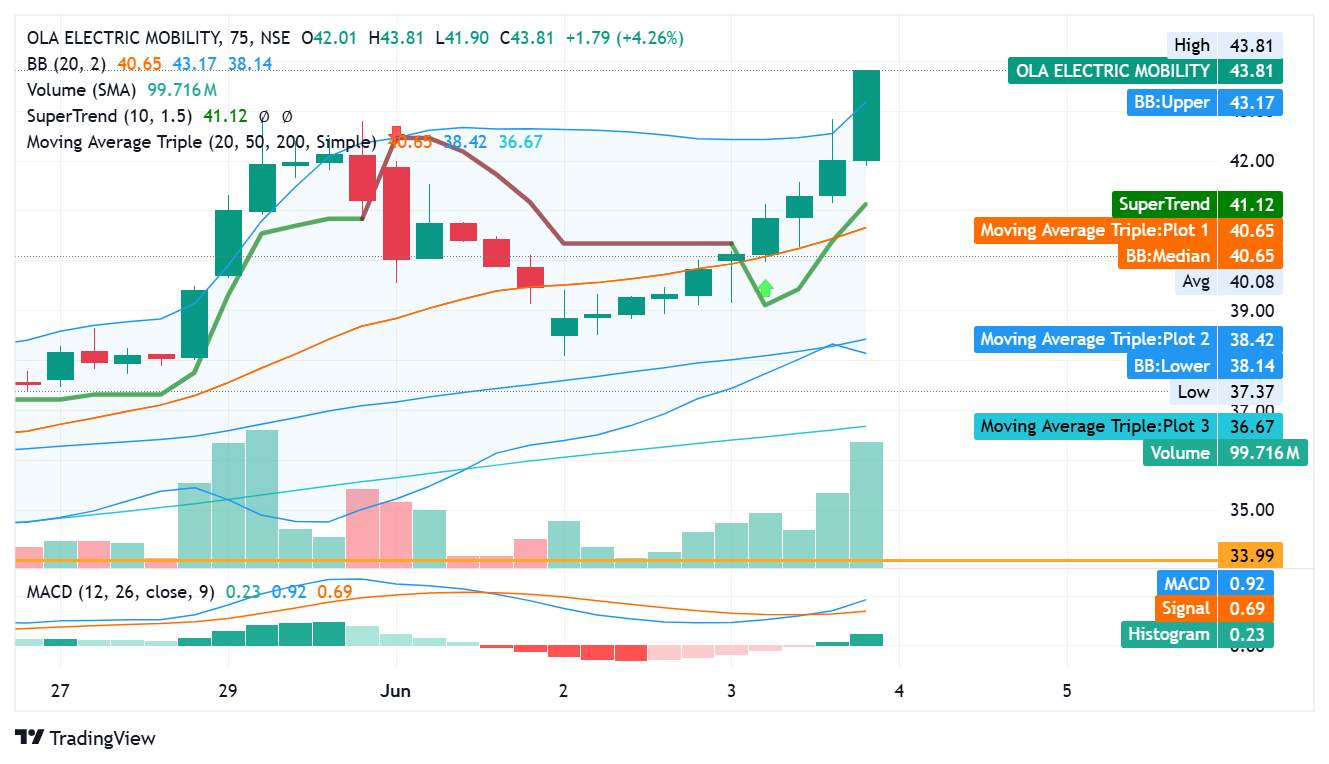
Ola Electric Mobility Limited saw a very strong trading session on the 75-minute chart. The stock closed at ₹43.81 after a sharp upward move during the day. The chart now shows positive momentum, rising volume, and a bullish technical structure. Traders and investors closely watched the stock because price action became very strong near the closing hours.
The stock opened at ₹42.01 and moved between ₹41.90 and ₹43.81 during the session. The final close came exactly near the day’s high. This type of closing usually shows strong buyer confidence. It also shows that sellers failed to push the stock lower before market close.
Strong Price Action Near Resistance Zone
The most important observation from the chart comes near the ₹43 to ₹45 area. The stock now trades very close to the first major weekly resistance level of ₹45. This zone may become important in the next few sessions.
If price stays above ₹43 and moves beyond ₹45 with strong volume support, market sentiment may improve further. A clean move above resistance often attracts fresh trader interest.
At the same time, resistance zones may also create temporary pressure because some traders prefer profit booking near higher levels. Because of this, price movement near ₹45 will remain important.
Weekly Trend Remains Positive
The broader weekly structure also supports the current bullish move.
The stock has gained 11.65% in one week and 19.83% in one month. These numbers show strong short-term recovery in market sentiment.
The year-to-date return stands at 16.76%, which reflects improving strength after earlier weakness. However, the one-year return remains negative at -11.19%. This means the stock still remains below some earlier higher levels despite recent recovery.
The chart also shows important weekly resistance zones at ₹45, ₹58, and ₹71. These levels may become important if bullish momentum continues during coming weeks.
On the downside, strong weekly support exists near ₹34 and ₹22. These areas may attract buyers if the stock faces correction later.
Moving Averages Support Bullish Structure
One of the strongest technical signals on the chart comes from the moving average structure.
The 20 moving average currently stays above the 50 moving average. At the same time, the 50 moving average remains above the 200 moving average.
This alignment normally reflects a strong bullish trend.
The chart shows the following moving average values:
The 20 moving average stands near ₹40.65.
The 50 moving average stands near ₹38.42.
The 200 moving average stands near ₹36.67.
This setup usually means short-term price momentum remains stronger than the longer-term trend. Traders often see this structure as a positive signal because it reflects steady upward direction.
The stock also trades above all three moving averages. This further supports the bullish technical setup visible on the chart.
ALSO READ: NSE Market Activity Shows Mixed Trade Mood
SuperTrend Indicator Gives Positive Signal
The SuperTrend indicator on the chart also supports bullish sentiment.
The SuperTrend level currently stands near ₹41.12. The stock price remains above this level, which usually reflects positive trend direction.
The green SuperTrend signal visible on the chart indicates that buyers currently control short-term momentum.
As long as price remains above the SuperTrend level, bullish sentiment may continue in the near term.
Bollinger Bands Show Strong Expansion
The Bollinger Bands on the chart also show an important development.
The upper Bollinger Band stands near ₹43.17.
The median band stands near ₹40.65.
The lower band stands near ₹38.14.
The stock closed above the upper Bollinger Band near ₹43.81. This normally shows strong momentum and aggressive buying activity.
When price closes near or above the upper Bollinger Band, it often reflects strong market participation. However, such moves may also create short-term volatility because fast rallies sometimes lead to temporary cooling periods.
The widening shape of the Bollinger Bands also suggests rising volatility in the stock.
Volume Shows Strong Market Participation
Volume remained one of the biggest highlights of the session.
The chart shows volume near 99.716 million shares on the 75-minute timeframe. This reflects strong trader participation during the rally.
The overall traded volume reached 2,669.48 lakh shares, while traded value crossed ₹1,118.25 crore.
Strong volume during an upward move usually gives more strength to the price trend. It shows that buyers actively participated during the rally instead of weak low-volume movement.
High volume near breakout levels also becomes important because it may support trend continuation.
MACD Indicator Supports Momentum
The MACD indicator on the chart also reflects improving momentum.
The MACD value stands at 0.92.
The Signal line stands at 0.69.
The Histogram stands at 0.23.
The MACD line remains above the Signal line, which usually reflects bullish momentum.
The positive histogram also supports the upward trend visible on the chart. This indicates that momentum strength improved during recent sessions.
Traders often watch MACD closely because it helps identify trend direction and possible continuation.
Volatility Remains Very High
Ola Electric continues to remain a highly volatile stock.
Daily volatility stands at 3.85%, while annualised volatility remains very high at 73.55%.
This means sharp price swings may continue during future sessions. High-volatility stocks often provide strong trading opportunities, but they also carry higher risk.
Because of this, traders usually monitor price action very carefully near major support and resistance zones.
Market Position and Stock Information
Ola Electric currently has a total market capitalisation of ₹19,323.85 crore. The free float market capitalisation stands at ₹8,777.05 crore.
The stock belongs to the NIFTY SMALLCAP 100 index and operates in the 2/3 wheelers segment.
The 52-week high remains ₹71.25, recorded on 04 September 2025.
The 52-week low remains ₹22.25, recorded on 16 March 2026.
The current upper circuit level stands at ₹48.11, while the lower circuit level remains ₹39.37.
These levels may become important during high-volatility sessions.
Overall Technical View
The overall chart structure currently reflects bullish momentum on the 75-minute timeframe. Price action, moving averages, SuperTrend, MACD, and volume all support short-term strength in the stock.
At the same time, the stock now trades near an important resistance area. Because of this, market participants may closely watch price behaviour near ₹45 in coming sessions.
If price sustains above resistance with continued volume support, positive sentiment may remain active. However, any sharp move in either direction may increase volatility because the stock already trades after a strong rally.
This analysis reflects only technical observations based on current chart structure and market data. Market conditions may change quickly, and future price movement may differ from current expectations.
Traders Now Watching the Next Session Carefully
After today’s strong move, traders are expected to closely monitor the stock in the next trading session. The market will watch whether Ola Electric can continue holding above important levels.
If buying momentum continues, the stock may remain active in the short term. However, if traders start booking profits after the rally, some price volatility may appear.
Market participants will also keep an eye on overall market conditions because broader sentiment can influence short-term stock movement significantly.
For now, today’s session has clearly placed Ola Electric back in focus among active traders and investors. The strong recovery, sharp upward movement, and bullish closing pattern have become the main talking points after today’s trading session.
Frequently Asked Questions (FAQs)
1. Why did Ola Electric shares rise strongly during the session?
Ola Electric shares saw strong buying interest during the trading session because the stock showed positive technical signals across multiple indicators. The price recovered sharply from lower levels and closed near the day’s high at ₹43.81. This type of movement usually reflects strong buyer confidence.
The stock also moved above important short-term resistance levels during the session. Volume remained very high, with traded volume crossing 2,669.48 lakh shares and traded value touching ₹1,118.25 crore. Strong volume often gives additional support to upward price movement.
Technical indicators such as moving averages, MACD, SuperTrend, and Bollinger Bands also reflected positive momentum. The stock remained above all major moving averages, while the MACD indicator stayed in bullish territory. These signals together helped improve market sentiment around the stock.
At the same time, the broader electric vehicle sector continues to attract market attention in India. This also adds interest toward EV-related stocks like Ola Electric.
2. What do the moving averages on the chart indicate?
The moving average structure currently reflects strong bullish momentum on the 75-minute timeframe chart.
The 20 moving average stands near ₹40.65.
The 50 moving average stands near ₹38.42.
The 200 moving average stands near ₹36.67.
The most important signal comes from the alignment of these averages. The 20 moving average remains above the 50 moving average, while the 50 moving average remains above the 200 moving average.
This setup usually reflects strong trend strength because short-term price momentum stays stronger than long-term price movement. Traders often consider this type of alignment as a bullish technical structure.
The stock also trades above all these moving averages. This further supports positive sentiment because price normally remains strong when it trades above key support averages.
However, moving averages only show historical trend direction. They do not guarantee future movement. Market conditions can change quickly depending on price action, volume, and overall market sentiment.
3. Why is the ₹45 level very important for Ola Electric shares?
The ₹45 level currently acts as the first major weekly resistance zone on the chart. Resistance levels are important because they often become areas where selling pressure increases.
At present, the stock trades very close to this zone after a strong rally. Because of this, traders are watching carefully to see whether price can sustain above ₹45.
If the stock moves above this level with strong volume support, bullish momentum may improve further. A breakout above resistance often attracts fresh market participation because traders see it as a positive signal.
At the same time, resistance zones may also create temporary slowdown or profit booking. Some traders prefer booking gains near higher levels after a sharp rally.
Beyond ₹45, the next important resistance levels remain near ₹58 and ₹71 on the weekly timeframe. These levels may become important if the stock continues its upward trend in coming weeks.
4. What does the MACD indicator currently show for the stock?
The MACD indicator currently reflects improving momentum for Ola Electric shares.
The MACD value stands at 0.92.
The Signal line stands at 0.69.
The Histogram stands at 0.23.
The MACD line remains above the Signal line, which usually reflects bullish momentum in technical analysis.
The positive histogram also supports this signal because it shows improving strength in upward price movement. Traders often use MACD to identify trend direction and momentum changes.
When MACD remains positive after a breakout move, it may indicate continuation of bullish sentiment in the short term. However, traders also watch closely for any crossover or weakening momentum because indicator direction can change quickly during volatile market conditions.
MACD works best when combined with other indicators such as volume, moving averages, and price action instead of using it alone.
5. Is Ola Electric currently a high-risk stock?
Ola Electric currently remains a high-volatility stock based on market data and chart structure.
The stock’s daily volatility stands at 3.85%, while annualised volatility remains very high at 73.55%. This means sharp price movement can happen within short periods.
High-volatility stocks often attract active traders because they create strong trading opportunities. However, they also carry higher market risk because prices can move quickly in both directions.
The stock has also seen a wide movement between its 52-week low of ₹22.25 and 52-week high of ₹71.25. This large price range reflects the level of volatility present in the stock.
Because of this, traders usually monitor support and resistance zones very carefully. Important support levels currently remain near ₹34 and ₹22, while key resistance levels remain near ₹45, ₹58, and ₹71.
Investors and traders generally use proper risk management while dealing with highly volatile stocks because sudden market changes can affect price direction quickly.
This discussion reflects technical observations based on current chart data and market conditions. It should not be treated as financial advice or a guarantee of future stock performance.
ALSO READ: CMR Green IPO Draws Strong Early Market Demand
DATA SOURCE: NSE INDIA