
Power Finance Corporation (PFC) has shown a noticeable recovery after a sharp correction from recent highs. The stock now trades at ₹431.75, which places it near an important decision zone. Price action on the daily chart suggests that buyers have returned, but the overall structure still requires confirmation before a strong bullish move can take shape.
At the present stage, the stock remains in a recovery phase after a major upward move that started earlier this year. Market participants now watch whether this recovery can develop into a fresh uptrend or whether sellers regain control near resistance levels.
Price Structure Shows Earlier Strong Rally
The broader structure of the chart reflects a st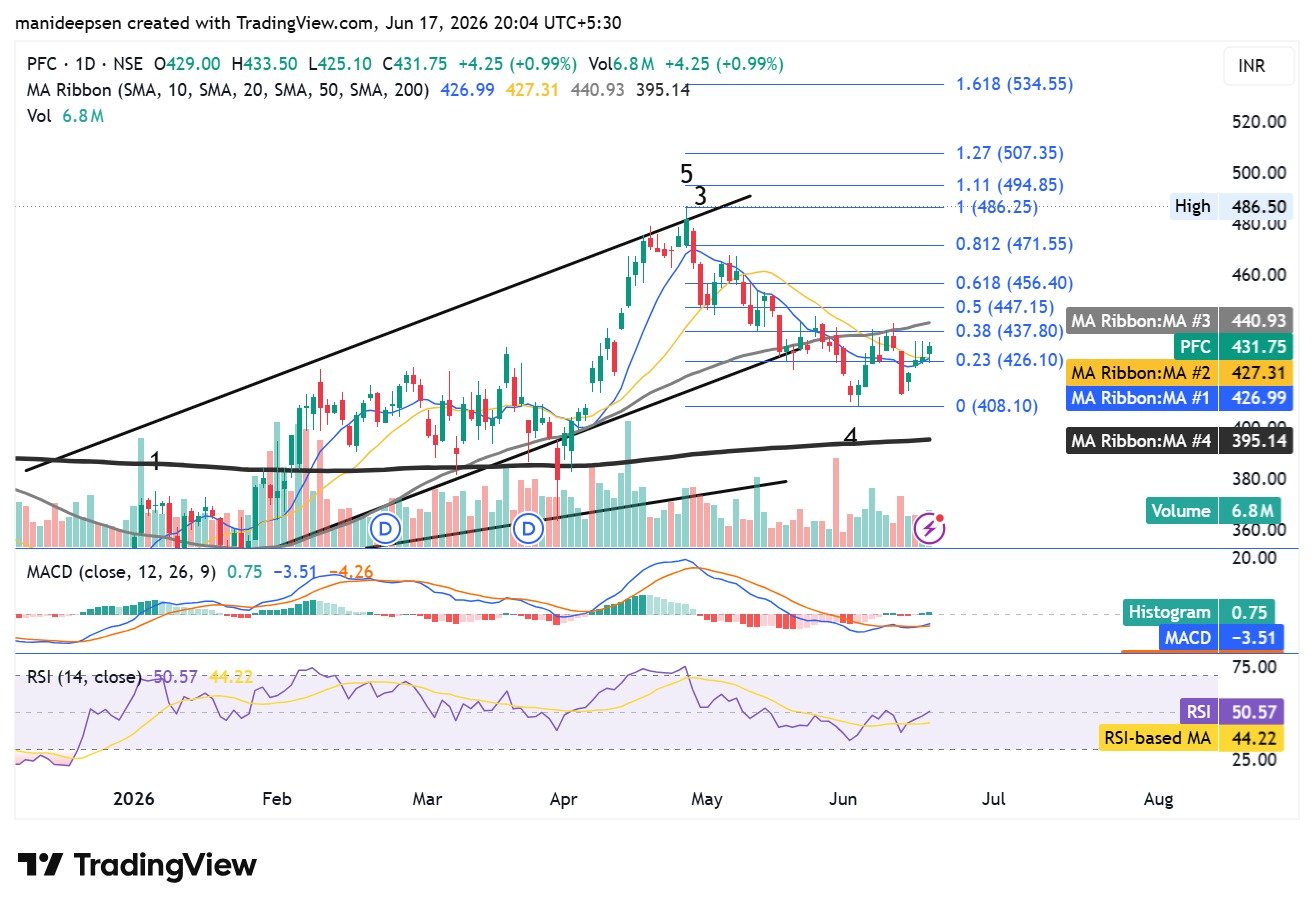 rong upward move that began near ₹360 and later pushed price toward ₹486.50. This move represented nearly a 35 percent rise within a relatively short period.
The pattern resembles an impulsive upward structure where price moved strongly with clear momentum. After price touched the ₹486 region, sellers entered aggressively and pushed the stock lower. This sharp decline suggests that the previous upward cycle likely reached temporary exhaustion.
At this stage, the stock appears to move through a correction phase rather than a continuation of the earlier rally.
Trend Structure Remains Intact
Trendline structure remains one of the strongest positive signals on the chart. Price corrected sharply after the recent peak but found support near an upward-sloping trendline that has acted as support for several months.
This tells us buyers still defend the broader trend.
A deeper long-term support zone sits near ₹395, which also aligns with a major lower trendline visible on the chart. As long as price stays above this level, the larger bullish structure remains intact.
A breakdown below this region may weaken the entire medium-term setup.
Fibonacci Levels Show Immediate Resistance Ahead
Fibonacci retracement levels help identify the current battle zone between buyers and sellers.
The recent swing ranges between ₹408.10 and ₹486.25.
Important retracement levels are:
| Level | Price |
|---|---|
| 0.236 | ₹426.10 |
| 0.382 | ₹437.80 |
| 0.50 | ₹447.15 |
| 0.618 | ₹456.40 |
| 0.812 | ₹471.55 |
The stock currently trades above ₹426, which gives early strength to buyers.
However, price still remains below ₹438, the first major resistance level. Until this zone breaks decisively, full bullish confirmation remains absent.
Moving Averages Show Early Improvement
The moving average ribbon offers a useful view of trend direction.
Current average levels remain:
10 DMA: ₹426.99
20 DMA: ₹427.31
50 DMA: ₹440.93
200 DMA: ₹395.14
Price now sits above both the 10-day and 20-day averages. This usually signals short-term strength.
At the same time, price still trades below the 50-day moving average near ₹440, which acts as immediate overhead resistance.
The long-term average near ₹395 continues to support the broader trend.
This structure suggests improving momentum, although confirmation still remains incomplete.
Volume Does Not Yet Show Strong Institutional Participation
Volume on the latest candle stands near 6.8 million shares.
During the earlier rally, volume expanded significantly, which supported the strong upward move. During the correction phase, sell-side volume also increased.
The recent recovery, however, shows moderate participation rather than aggressive buying.
This usually indicates selective buying activity instead of broad institutional accumulation.
A strong breakout above resistance will require much higher volume compared with current levels.
MACD Suggests Momentum Recovery
The MACD indicator now gives early positive signals.
Current values show:
Histogram: +0.75
MACD Line: -3.51
The histogram has shifted back into positive territory. This often reflects a gradual improvement in momentum after a correction.
Although this remains an encouraging sign, the MACD line still stays close to the neutral zone.
This means bullish momentum has started to recover, but strength remains limited for now.
RSI Shows Neutral Strength
Relative Strength Index currently stands at 50.57.
RSI has moved higher after recent weakness and now trades above its own moving average near 44.22.
This suggests momentum has improved compared with earlier sessions.
At the same time, RSI near 50 usually reflects neutral market conditions rather than strong bullish control.
A move above 60 would provide stronger confidence in trend continuation.
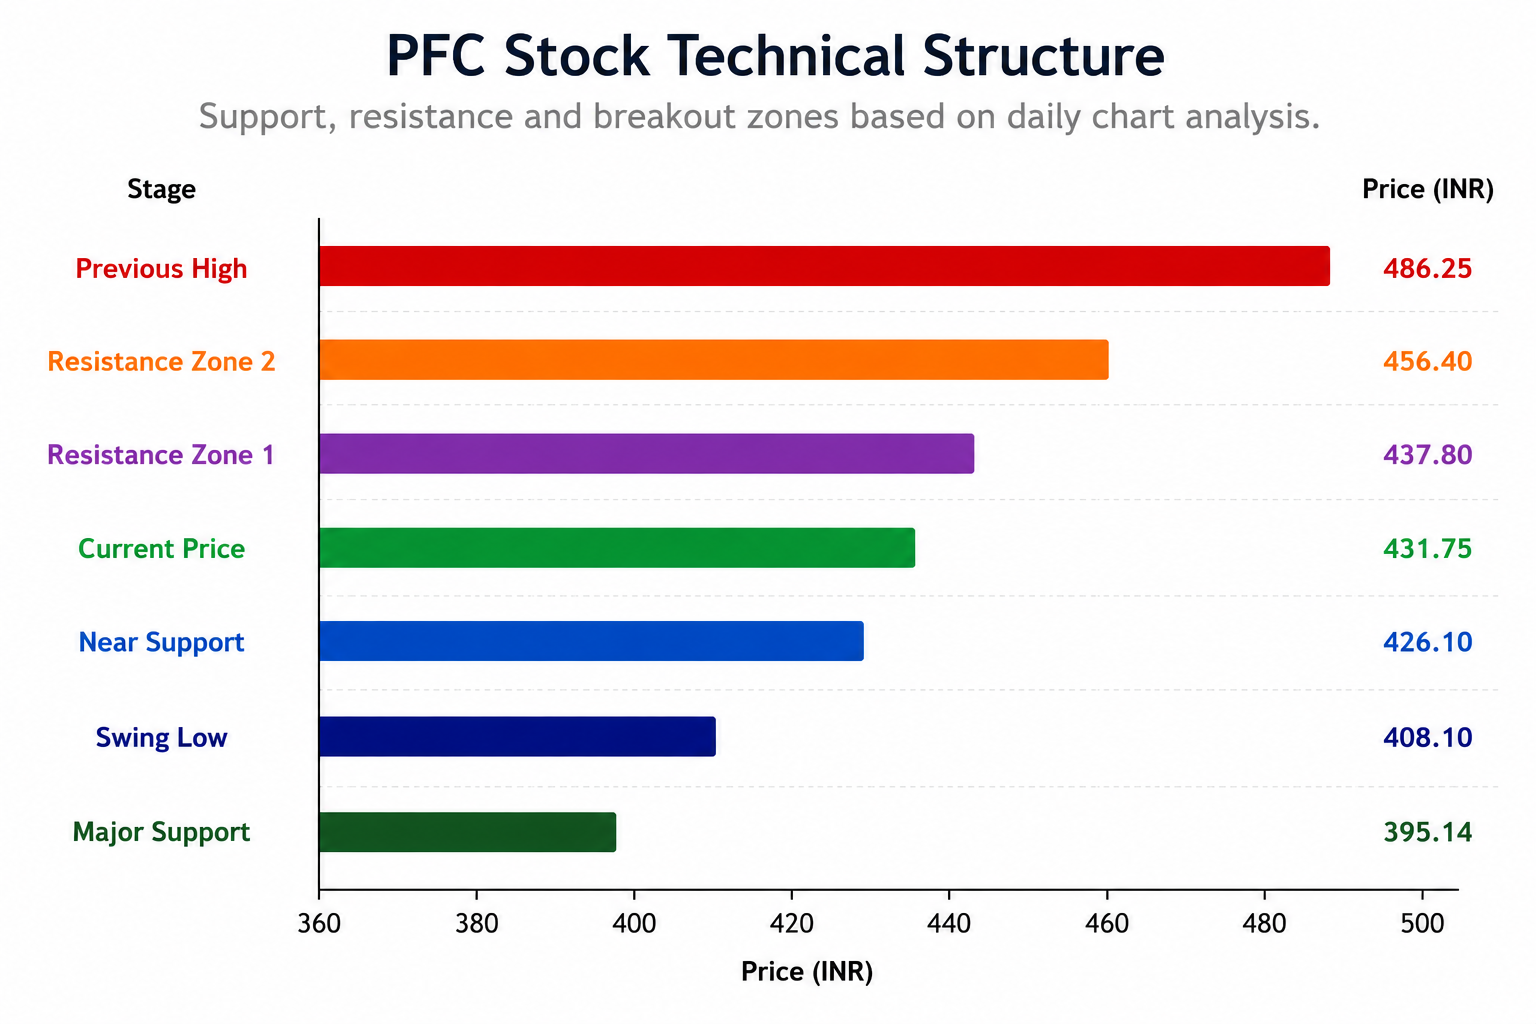
Important Price Zones Traders Watch
The nearest support zone sits near ₹426, which aligns with short-term Fibonacci support and moving averages.
The second major support level stands near ₹408, where price found recent demand.
The strongest structural support remains near ₹395, which also aligns with the 200-day moving average.
On the upside, the first resistance zone sits near ₹438 to ₹440.
The second major resistance area comes near ₹447 to ₹456.
If buyers push price above these zones, the next important level appears near ₹471, followed by the earlier high at ₹486.
Probability Assessment Based on Current Structure
The most likely near-term outcome remains sideways consolidation between ₹425 and ₹445 as price tests resistance.
A bullish breakout may emerge if price closes above ₹440 with strong volume expansion.
Failure near resistance may bring another test of ₹408 support.
The broader structure remains constructive, but price action still requires confirmation before a fresh upward trend can fully develop.
Overall Conclusion
PFC currently shows early signs of recovery after a sharp correction from recent highs.
Technical indicators have improved. Price has reclaimed short-term moving averages. Momentum indicators show positive change. Trendline support continues to hold.
Despite these positive developments, resistance near ₹440 remains the most important level on the chart.
A successful breakout above this zone may open a path toward ₹456 and later ₹471.
Until that happens, the stock remains in a cautious recovery phase rather than a confirmed bullish breakout.
Frequently Asked Questions
Is PFC stock bullish right now?
The stock shows early bullish recovery, but confirmation needs a breakout above ₹440.
What is the strongest support level for PFC?
The strongest long-term support currently sits near ₹395.
Why is ₹440 important for PFC stock?
This level matches the 50-day moving average and acts as immediate resistance.
Can PFC retest previous highs?
A successful move above ₹456 may open a path toward the earlier high near ₹486.
What does current RSI indicate?
RSI near 50 suggests neutral momentum with early signs of strength recovery.
ALSO READ: Nifty India Defence Index Shows Strong Bullish Trend