
Genus Power Infrastructures Limited, a well-known company in India’s electrical equipment sector, came into market focus after a large block trade worth ₹576.5 crore took place on the BSE Limited. The transaction involved nearly 1.98 crore shares, which moved in a single session and immediately caught the attention of traders, investors, and market participants.
A transaction of this size usually stands out because such deals rarely come from retail investors. In most cases, trades of this scale involve institutional investors, large shareholders, funds, or strategic participants. While the exchange data confirms the trade size and price, the identities of the buyer and seller have not yet become publicly known.
The development has created fresh discussion around the stock, especially because the company operates in a sector that has seen strong attention due to India’s expanding smart meter and power infrastructure plans.
Details of the Block Trade
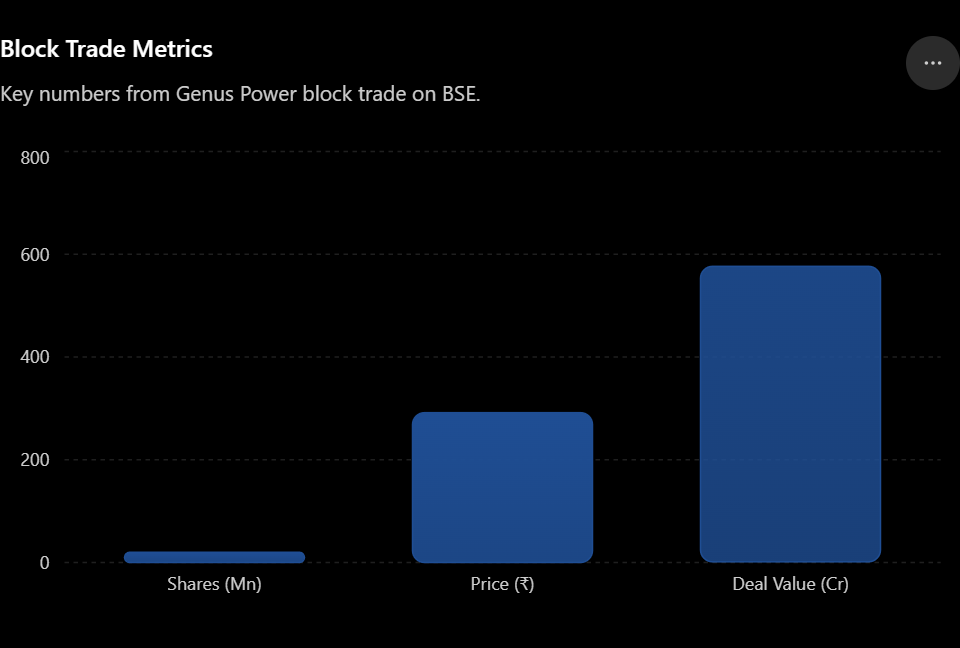
The exchange data shows that approximately 19,766,887 shares of Genus Power changed hands during the block deal transaction.
The trade happened at a price of ₹291.65 per share, which pushed the total transaction value to ₹576.5 crore.
The numbers below summarize the trade.
| Parameter | Details |
|---|---|
| Exchange | BSE |
| Number of Shares | 19,766,887 |
| Trade Price | ₹291.65 per share |
| Total Deal Value | ₹576.5 crore |
This transaction represents a significant amount of capital movement in a single trading session. Large trades of this nature usually attract attention because they often indicate institutional participation.
The trade value alone makes this one of the notable market events for the company in recent sessions. When such large quantities move together, the market usually pays close attention because the transaction may signal a strategic move by larger participants.
ALSO READ: Happy Square Wins Rs 21.0044 Cr Toll Plaza Management Order
Why the Market Watches Block Deals Closely
A block trade refers to a large transaction executed in one order between large participants. This differs from normal daily trading activity where thousands of smaller buyers and sellers enter the market throughout the day.
When a block deal crosses hundreds of crores in value, it often creates immediate market interest because investors try to understand the reason behind the trade.
In some situations, a large institution may decide to increase exposure to a company after positive internal research or future growth expectations. In other situations, an early investor may reduce stake after a period of price appreciation.
At this stage, public exchange data only confirms the transaction itself. It does not confirm the exact reason behind the deal. Because of this, any interpretation remains speculative until further disclosures become available.
Recent Share Price Performance
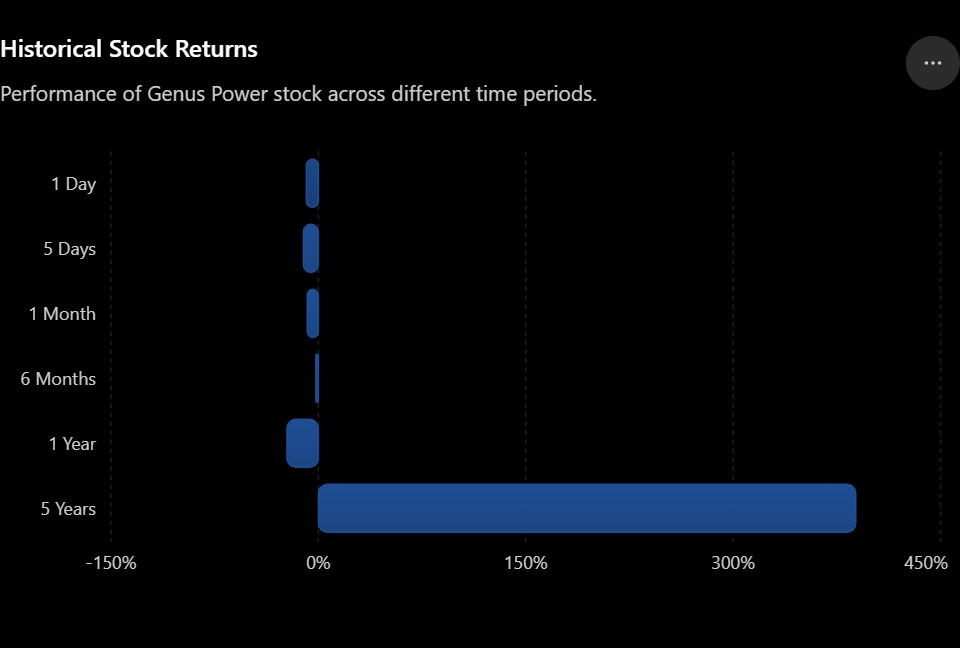
Recent return numbers show that the stock has remained under pressure over shorter time periods.
The company has reported negative returns in the last few sessions, but long-term historical returns still remain strong.
The available return data appears below.
| Period | Return |
|---|---|
| 1 Day | -9.04% |
| 5 Days | -10.83% |
| 1 Month | -8.04% |
| 6 Months | -1.81% |
| 1 Year | -22.72% |
| 5 Years | +388.72% |
These numbers suggest that short-term market sentiment has weakened recently. However, the longer five-year period still shows strong wealth creation.
The contrast between short-term weakness and long-term gains creates an interesting picture. It shows that recent price movement has turned negative even though the company delivered strong returns over a broader period.
Trading Session Activity
The stock also recorded heavy overall market participation during the trading session.
Total traded volume reached 237.28 lakh shares, while total traded value stood at ₹680.13 crore.
The company currently carries a market capitalization of ₹8,806.30 crore, while free float market capitalization stands at ₹3,166.33 crore.
The available exchange data appears below.
| Trade Information | Value |
|---|---|
| Traded Volume | 237.28 lakh |
| Traded Value | ₹680.13 crore |
| Market Cap | ₹8,806.30 crore |
| Free Float Market Cap | ₹3,166.33 crore |
| Impact Cost | 0.15 |
| Face Value | ₹1.00 |
| Margin Rate | 35.00 |
| Deliverable Quantity | 43.57% |
The traded value of ₹680.13 crore shows unusually high market activity during the session. This suggests strong attention from participants after the large transaction became visible.
The impact cost of 0.15 indicates that liquidity remained relatively stable despite high transaction volume.
Delivery Data and Market Behavior
One number that deserves attention is the 43.57 percent deliverable quantity ratio.
This figure represents the percentage of shares that moved into delivery rather than simple intraday trading.
A higher delivery ratio often shows that a significant portion of participants chose to hold shares beyond the trading session rather than close positions within the same day.
While this does not automatically indicate positive sentiment, it often shows stronger conviction compared with purely speculative activity.
Price Range and Volatility Levels
Exchange data also gives a broader picture of price behavior.
The stock reached a 52-week high of ₹394.00 on 05 August 2025.
Its 52-week low stood at ₹210.40 on 04 February 2026.
The exchange currently shows an upper band of ₹382.10 and a lower band of ₹254.80, with a price band limit of 20 percent.
The company trades with a tick size of ₹0.05.
The price information table appears below.
| Price Information | Value |
|---|---|
| 52 Week High | ₹394.00 |
| 52 Week Low | ₹210.40 |
| Upper Band | ₹382.10 |
| Lower Band | ₹254.80 |
| Price Band | 20% |
| Tick Size | ₹0.05 |
| Daily Volatility | 2.78 |
| Annualised Volatility | 53.11 |
The annualised volatility figure of 53.11 suggests that the stock remains highly active and can experience larger price movement compared with low volatility companies.
This often attracts both institutional participants and short-term traders.