
The chart shows Canara Bank (CANBK) on the daily timeframe. It presents price data, short-term moving averages, volume, RSI, MACD, and an Elliott-wave style structure. The chart also marks several support and resistance zones and shows a possible upward price path toward ₹141.16 and ₹152.41.
This review is only a technical interpretation of the chart supplied here. It does not state what the stock will do in the future. It also does not amount to investment advice, a buy or sell recommendation, or a promise of profit. Market prices can change for many reasons that a chart cannot show. Any decision about CANBK should also take account of financial results, valuation, news, market conditions, personal risk limits, and other relevant facts.
Current Price Position
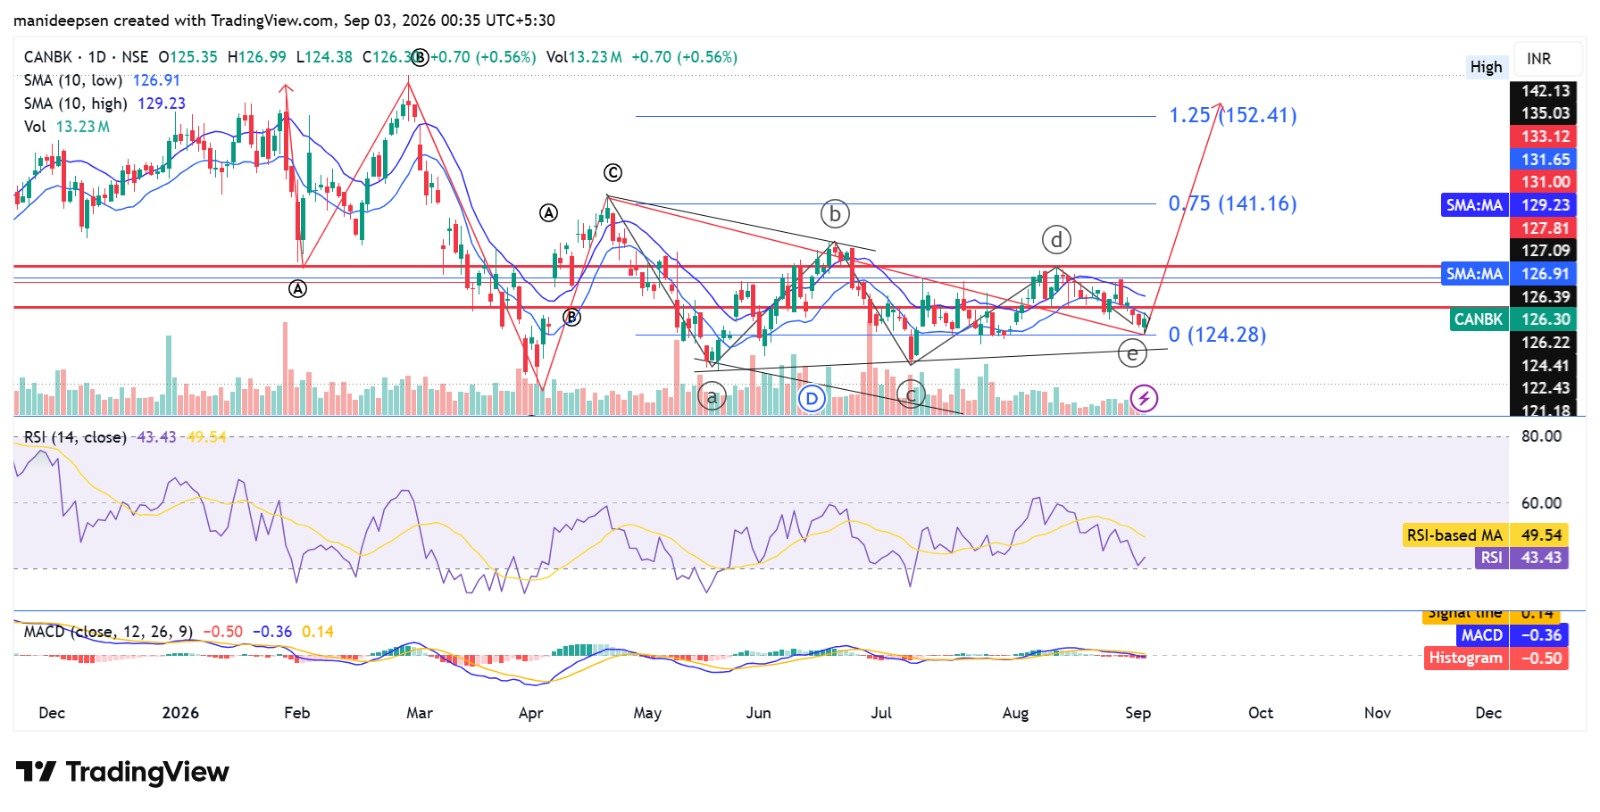
As per the chart, CANBK closed at ₹126.30, after an open of ₹125.35. The recorded high was ₹126.99, while the low was ₹124.38. The daily move shown on the chart was +₹0.70, or +0.56%.
The price sits close to the lower part of the short-term price range shown on the chart. More importantly, the close at ₹126.30 is below both marked 10-day simple moving averages. The 10-day SMA based on the low is ₹126.91, while the 10-day SMA based on the high is ₹129.23.
This gives a simple short-term picture. Price has not yet regained the main short-term average zone. Until that changes, the chart does not provide strong confirmation of a fresh upward move.
| Chart item | Value |
|---|---|
| Open | ₹125.35 |
| High | ₹126.99 |
| Low | ₹124.38 |
| Close | ₹126.30 |
| Daily change | +₹0.70 |
| Daily change % | +0.56% |
| Volume | 13.23M |
| 10-day SMA, low | ₹126.91 |
| 10-day SMA, high | ₹129.23 |
| RSI | 43.43 |
| RSI-based MA | 49.54 |
| MACD | -0.36 |
| Signal line | 0.14 |
| Histogram | -0.50 |
The Main Support Zone
The most important level on the chart is ₹124.28. The chart marks this price as the 0 level of the displayed wave structure.
The recent price action has stayed close to this area. The day low of ₹124.38 is also very close to the marked support at ₹124.28. This makes the ₹124.28–₹124.38 area important from a chart perspective.
A price level on a chart is not a guarantee that buyers will appear there. It is better viewed as an area where the price may react. If CANBK stays above this zone and later moves above nearby resistance, the bullish interpretation shown on the chart may gain more support.
On the other hand, a clear daily close below ₹124.28 would weaken the current bullish structure. It would not automatically mean a major fall, but it would mean that the wave interpretation shown on the chart may need a fresh review.
The Short-Term Resistance Zone
The first major hurdle appears near ₹126.91. This is the 10-day SMA based on the low. The next important level is ₹129.23, which is the 10-day SMA based on the high.
The area from about ₹126.91 to ₹129.23 therefore matters. CANBK needs to move through this area with reasonable price strength before the chart can show a clearer short-term improvement.
A move above ₹129.23 would be more useful than a small move above ₹126.91 alone. However, even a move above ₹129.23 would not by itself confirm the much higher targets on the chart.
The next area sits near ₹131–₹133. The chart also marks ₹131.00, ₹131.65, and ₹133.12 on the right side. These levels can act as additional resistance.
| Price area | Chart role | Simple interpretation |
|---|---|---|
| ₹124.28 | Main support | Key level for the present structure |
| ₹126.91 | Short-term resistance | First level to reclaim |
| ₹129.23 | Short-term resistance | More important moving-average level |
| ₹131–₹133 | Resistance zone | Stronger test for the bullish case |
| ₹135.03 | Higher resistance | Further price hurdle |
| ₹141.16 | Major chart target | First major upside objective |
| ₹152.41 | Extended chart target | Higher objective shown by the chart |
Elliott-Wave Interpretation
The chart uses labels such as A, B, C, a, b, c, d, and e. These labels appear to form an Elliott-wave style interpretation of the price path.
The recent structure appears to suggest a corrective phase from the prior high, with the chart author placing the possible final e point close to ₹124.28. The red arrow then shows a possible upward move from that zone.
The chart marks ₹141.16 as a 0.75 level and ₹152.41 as a 1.25 level. These appear to represent possible Fibonacci-based price objectives within the chart’s wave model.
This interpretation should be treated as a scenario rather than a fact. Elliott-wave counts can change when new price data appears. Two analysts can also assign different wave labels to the same price pattern.
For that reason, the best use of this chart is not to assume that ₹152.41 must occur. Instead, the wave structure can serve as a framework for possible price paths, subject to confirmation from actual price action.
RSI Analysis
The chart shows an RSI of 43.43 and an RSI-based moving average of 49.54.
RSI measures price momentum on a scale from 0 to 100. A level above 50 often suggests stronger positive momentum, while a level below 50 often suggests weaker momentum. Very high or very low readings can also show stronger conditions, although they do not guarantee a reversal.
Here, RSI at 43.43 is below 50 and below its own average at 49.54. This gives a relatively weak short-term momentum signal.
At the same time, RSI is not at an extreme low level. The chart therefore does not show a classic deeply oversold condition.
A stronger technical case would arise if RSI first moved above 50 and then held above that level while price also cleared the ₹129–₹131 area. Such a move would provide better momentum support for the bullish scenario.
MACD Analysis
The MACD section also gives a cautious message.
The chart shows MACD at -0.36, a signal line at 0.14, and a histogram at -0.50.
The MACD line is below the signal line, while the histogram is negative. In simple terms, this suggests that short-term momentum remains weak.
This matters because the large upward arrow on the chart is not yet supported by all of the momentum tools. The price structure may offer a possible bullish setup, but RSI and MACD do not yet provide strong confirmation.
A change in MACD structure, together with a rise in price above the marked resistance zones, would make the bullish case more credible. Without such confirmation, the upside path remains a scenario rather than an established trend.
Volume
The chart shows daily volume of 13.23M shares or units as displayed by TradingView.
Volume can help assess the strength behind a price move. A price breakout with stronger volume can sometimes provide more confidence than a breakout with very low volume. However, volume alone cannot confirm whether a move will continue.
The supplied chart does not provide enough information for a complete volume study. It would be useful to compare the volume on a future move above ₹129.23 or ₹131–₹133 with the recent daily average.
If price rises through resistance with clearly higher volume, the breakout may have greater technical weight. If price rises on weak volume and then falls back below resistance, the move may have less strength.
Bullish Scenario
The bullish scenario starts with the assumption that the ₹124.28 support area holds.
If price remains above this zone, then the first task for the bulls would be a move above ₹126.91. A stronger move above ₹129.23 would be more significant because it would place price above both marked short-term SMA levels.
The next test would be the ₹131–₹133 zone. A sustained move above this area would give the bullish chart structure better technical support.
If that sequence occurs, the chart’s first major projected objective is ₹141.16. A later move toward ₹152.41 would represent the extended scenario shown by the red arrow.
The key point is that each level should be treated as a separate test. The chart does not justify the assumption that a move above ₹126.91 will automatically lead to ₹152.41.
Bearish or Weak Scenario
The weaker scenario starts if CANBK fails to hold ₹124.28.
A decisive daily close below that level would raise questions about the current wave count. The price could then enter a lower range, although the supplied chart alone does not provide enough evidence to state a specific downside target with confidence.
There is also a more moderate weak case. CANBK may remain above ₹124.28 but fail to cross ₹129.23. In that situation, the stock could continue to trade within the current range.
This would fit the present RSI and MACD picture better than an immediate large upside move.
Key Levels at a Glance
| Scenario | Price condition | Technical reading |
|---|---|---|
| Support holds | Above ₹124.28 | Bullish structure remains possible |
| First recovery | Above ₹126.91 | Short-term improvement |
| Stronger recovery | Above ₹129.23 | Better bullish confirmation |
| Major breakout area | Above ₹131–₹133 | Bullish case becomes stronger |
| First major objective | ₹141.16 | Chart-based upside level |
| Extended objective | ₹152.41 | Higher chart-based scenario |
| Structure risk | Below ₹124.28 | Current bullish count weakens |
What the Chart Says Overall
The chart presents a possible bullish reversal structure, but it does not yet show full confirmation.
The strongest positive feature is the proximity of price to the ₹124.28 support level. The chart’s wave structure suggests that this area may represent the end of a corrective phase. If that view proves correct, the marked upside levels of ₹141.16 and ₹152.41 become relevant technical objectives.
The main concern is momentum. RSI is at 43.43, below its average of 49.54, while MACD is at -0.36, below the signal line at 0.14, with a histogram of -0.50. These readings do not yet support a strong bullish conclusion.
Price also remains below the 10-day SMA levels of ₹126.91 and ₹129.23.
Therefore, the chart currently looks more like a decision zone than a confirmed uptrend.
Risk Interpretation
From a risk perspective, ₹124.28 is the most useful reference level on the supplied chart. The closer price stays to that level without a clear recovery, the greater the importance of a confirmed support test.
A technical setup becomes more constructive if price moves above resistance and the momentum indicators also improve. A setup becomes less constructive if price breaks support while RSI and MACD remain weak.
No single indicator should be treated as proof of future price direction. Technical analysis works with probabilities and scenarios, not certainty.
Conclusion
Based only on the supplied daily chart, CANBK has a possible bullish structure near ₹124.28, with marked upside objectives at ₹141.16 and ₹152.41. These levels are part of the chart’s technical model and should not be treated as guaranteed future prices.
The first major confirmation area is ₹126.91–₹129.23, followed by ₹131–₹133. A sustained move above these zones would make the bullish scenario more credible. A clear daily close below ₹124.28 would weaken the current wave interpretation.
The present momentum data remains cautious. RSI at 43.43 is below 50, and MACD at -0.36 remains below its 0.14 signal line. This means the chart does not yet provide enough evidence for a confident bullish conclusion.
In simple terms, the chart says: ₹124.28 is the key support, ₹129.23 is an important hurdle, ₹131–₹133 is a stronger confirmation area, ₹141.16 is the first major upside objective, and ₹152.41 is the extended upside scenario.
This is a chart-based analysis only. It should not be treated as a guarantee, personalised financial advice, or a recommendation to buy, hold, or sell CANBK.