
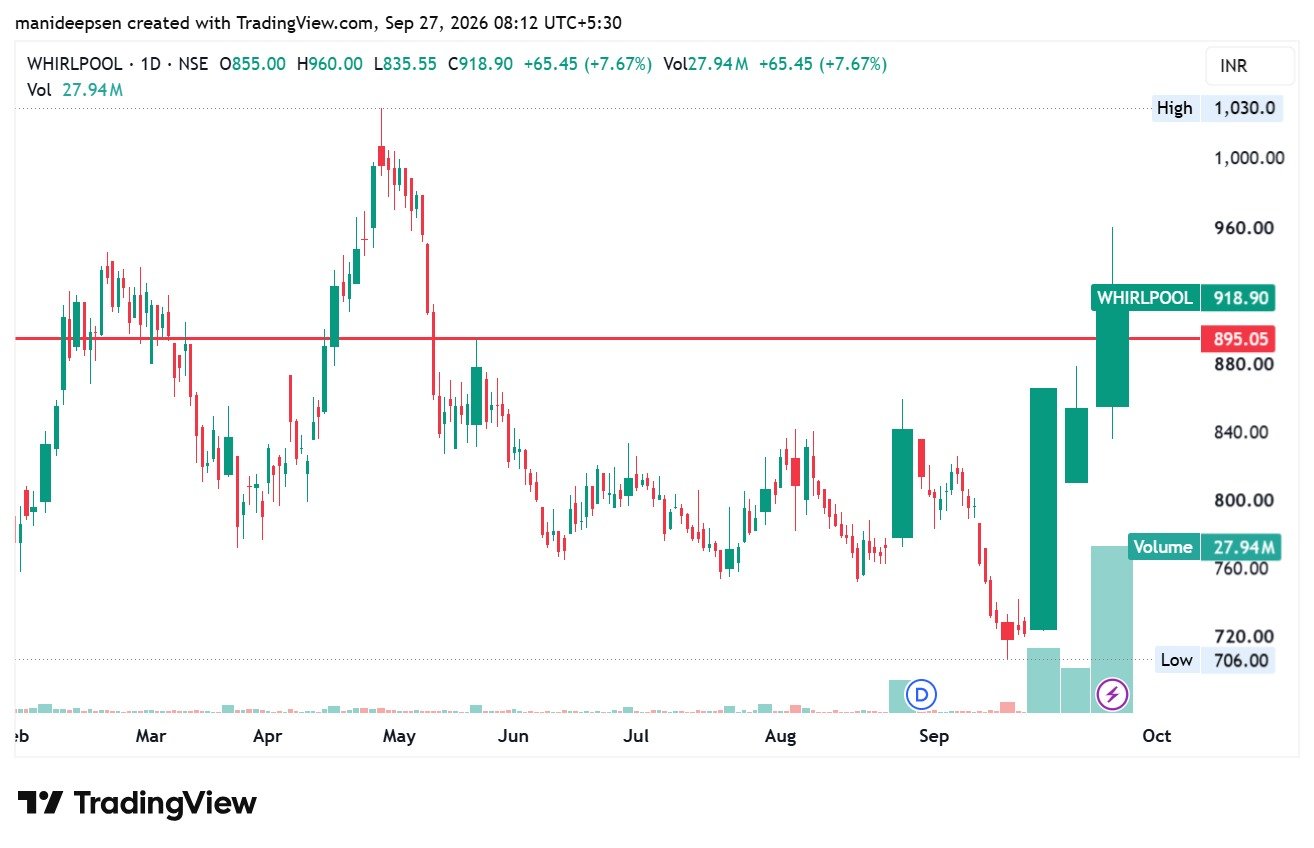
The chart shows Whirlpool of India Ltd. (NSE: WHIRLPOOL) on a daily time frame. The chart date is September 27, 2026, and the chart carries the time 08:12 UTC+5:30. The analysis below uses only the price, volume, and levels visible in the supplied chart. It does not use company results, news, valuation data, broker reports, or any information after the date shown on the chart.
This is a technical chart study for educational purposes. It is not a recommendation to buy, sell, or hold the stock. A chart can show a market structure, but it cannot provide certainty about the next price move. Actual results can differ from any technical scenario described below.
The latest price action
The latest daily candle is the main feature of the chart. Whirlpool opened at ₹855.00, reached a high of ₹960.00, fell to an intraday low of ₹835.55, and closed at ₹918.90.
The daily change was +₹65.45, or +7.67%. The reported volume was 27.94 million shares.
These figures show a very wide price range for one session. The distance between the low of ₹835.55 and the high of ₹960 was ₹124.45. The close at ₹918.90 was also well above the open at ₹855.
The candle therefore shows strong upward price action during the session. It also shows that sellers appeared near ₹960, since the stock did not close near its intraday high. That does not by itself mean that ₹960 will stop the next advance. It simply marks an area where supply appeared on the chart.
The most important fact is that the stock closed above the marked level of ₹895.05.
The ₹895.05 level
The red horizontal line at ₹895.05 is the central technical level on this chart.
Before the latest move, the price spent a long period below this area. The stock had several attempts to recover during the months shown on the chart, but the broader structure remained below the upper price zone.
The latest candle moved above ₹895.05 and closed at ₹918.90. This gives the chart a different short-term structure.
A move above a previous resistance area can have two broad technical outcomes. The first is a sustained move above that level, where the old resistance later acts as support. The second is a failed move, where price returns below the level soon after the breakout.
For this reason, ₹895.05 deserves close attention after the latest session. It is not a guaranteed support level. It is simply the clearest reference point created by the chart.
Key price data
| Item | Value |
|---|---|
| Open | ₹855.00 |
| High | ₹960.00 |
| Low | ₹835.55 |
| Close | ₹918.90 |
| Daily change | +₹65.45 |
| Daily change (%) | +7.67% |
| Volume | 27.94M |
| Marked resistance | ₹895.05 |
| Chart high | ₹1,030.00 |
| Chart low | ₹706.00 |
Volume adds weight to the move
The volume figure is 27.94 million shares. On the supplied chart, this is much larger than the volume seen during most of the prior period.
High volume beside a large upward candle can add strength to a technical breakout. It shows that the price move came with substantial market activity. A move above resistance on very low volume would normally carry less technical weight.
However, volume does not prove that the price must rise further. High volume can also appear near a short-term peak when buyers and sellers both become very active.
The useful point here is more limited: the move above ₹895.05 had strong volume support on the chart. That makes the latest session more notable than an ordinary low-volume move above the same level.
A later decline below ₹895.05, especially on strong volume, would therefore deserve attention. It could suggest that the market did not accept the higher price area.
₹960 is the first major test
The latest session reached ₹960. This is the first clear price barrier above the close of ₹918.90.
A future daily close above ₹960 would place the stock above the latest session high. Such a move could show that buyers remain active after the large daily candle.
A failure near ₹960 would also be normal from a technical point of view. After a sharp one-day rise, some traders may book profits, while others may wait for a pullback before taking a new position.
Therefore, ₹960 should be treated as a reference level rather than a guaranteed ceiling.
The price relation can be described simply:
| Price area | Chart relevance |
|---|---|
| ₹1,030 | Major visible high |
| ₹1,000 | Psychological price area |
| ₹960 | Latest daily high |
| ₹918.90 | Latest close |
| ₹895.05 | Key breakout reference |
| ₹855 | Latest open |
| ₹835.55 | Latest daily low |
| ₹800 | Earlier price area |
| ₹720–₹706 | Lower major support zone visible on chart |
The ₹1,000 and ₹1,030 areas
Above ₹960, the next obvious reference is ₹1,000. This level has psychological importance because it is a round-number price. Round numbers often receive extra attention from market participants, although there is no rule that they must act as resistance.
Above ₹1,000, the chart shows a previous high near ₹1,030. The chart marks this as the highest visible price.
The move from ₹918.90 to ₹1,000 would require a rise of about 8.82%. The move from ₹918.90 to ₹1,030 would require about 12.10%.
These are simple mathematical distances from the supplied closing price. They are not price targets or forecasts.
| Reference | Approx. distance from ₹918.90 |
|---|---|
| ₹960 | +4.47% |
| ₹1,000 | +8.82% |
| ₹1,030 | +12.10% |
| ₹895.05 | -2.59% |
| ₹855 | -6.95% |
| ₹835.55 | -9.07% |
| ₹800 | -12.94% |
| ₹720 | -21.65% |
| ₹706 | -23.17% |
The importance of a retest
One of the more useful technical concepts on this chart is the idea of a retest.
After a stock moves above resistance, it may return toward that same level. If price reaches ₹895.05 and then finds demand near that area, the chart may show that the former resistance has become a support zone.
This would provide more evidence for the breakout structure.
For example, a decline from ₹918.90 toward ₹895.05 would not automatically mean that the bullish setup has failed. A temporary return toward the breakout area can occur after a sharp move.
The more concerning situation would be a clear daily close below ₹895.05 followed by further weakness. That would reduce the technical value of the latest breakout.
The chart alone cannot tell us whether a future move will take this form. It can only define the levels that matter.
The lower levels
The latest daily low is ₹835.55. This level is also useful because it shows the lowest price reached during the large bullish session.
If price falls below ₹895.05, the ₹835.55 area becomes a useful lower reference. A decline below ₹835.55 would erase a larger part of the latest upward move.
The chart also shows an earlier price area near ₹800. This zone acted as part of the broader price structure during the months before the latest rally.
Below ₹800, the chart shows a much lower area around ₹720 to ₹706. The chart marks ₹706 as the visible low.
These levels are not equal in importance. ₹895.05 is the key near-term breakout level, while ₹835.55 and ₹800 are lower reference areas. The ₹720–₹706 zone belongs to the larger base structure visible on the chart.
The larger chart structure
The chart covers several months. During the earlier part of the period, Whirlpool reached a high near ₹1,030. It then saw a broad decline and spent a long period in a lower range.
The stock later moved toward the ₹720–₹840 region several times. This created a broad base-like structure on the supplied chart.
The latest move is different because price has now moved sharply from that lower region toward ₹960 and closed above ₹895.05.
From a pure chart perspective, this creates a possible change from a long consolidation structure toward a recovery structure.
That statement should not be read as a prediction. A recovery structure remains valid only while the price action supports it. A return below key levels can change the chart quickly.
What the latest candle says
The candle has a useful mix of information.
The open was ₹855, while the close was ₹918.90. This means the stock finished ₹63.90 above its opening price.
The low of ₹835.55 came below the opening price, while the high of ₹960 came well above it. This shows a large intraday range.
The close was also above the marked ₹895.05 level. That is important because the stock did not merely cross the level for a short period and finish below it.
At the same time, the close was below ₹960. This shows some rejection from the day’s highest price.
The simplest interpretation is that the session had strong upward pressure, but also notable activity near the upper end of the day’s range.
Two main technical scenarios
The chart allows two broad paths without any need for a price prediction.
In the first path, price remains above ₹895.05. A move above ₹960 would then become the next major test. A later move toward ₹1,000 and the prior high near ₹1,030 would place the stock back near the upper part of the visible historical range.
In the second path, price loses ₹895.05. In that case, the market could return toward the lower reference areas near ₹855, ₹835.55, or ₹800. A move below ₹835.55 would show that a larger part of the latest rise had been lost.
Neither path is a forecast. They are simply two ways to read the levels visible on the supplied chart.
Risk factors in the chart
The biggest short-term risk is the size of the latest move. A rise of 7.67% in one daily session creates a much larger distance between the latest close and several recent support areas.
The stock also reached ₹960 but closed at ₹918.90. This means the session had some rejection from the high.
Another risk is a false breakout. A price move above resistance can fail if the stock later returns below that level. In this case, ₹895.05 is the key level for that question.
There is also gap and volatility risk. The latest candle has a very wide range from ₹835.55 to ₹960. Future sessions may show similarly large price swings. This can make short-term risk control harder.
A simple technical framework
| Question | Chart level | What it tells you |
|---|---|---|
| Has price stayed above the breakout area? | ₹895.05 | Key short-term structure |
| Has price crossed the latest high? | ₹960 | Next upside test |
| Has price reached the round-number area? | ₹1,000 | Major psychological zone |
| Has price reached the prior visible high? | ₹1,030 | Major historical test |
| Has price lost the latest session low? | ₹835.55 | Weakness in the latest move |
| Has price returned to the older range? | Around ₹800 | Larger support area |
| Has price returned to the base low? | ₹720–₹706 | Major lower support zone |
What matters most from here
For the next part of the chart, the most useful information may not be another large candle. A period of price stability can also provide useful evidence.
If price remains above ₹895.05 and later crosses ₹960, the chart would show continued strength above both the former resistance and the latest high.
If price moves below ₹895.05, the reaction around that level becomes more important. A quick recovery above it would give a different message from a sustained move below it.
Volume should also remain part of the analysis. The latest volume of 27.94M is a major feature of the session. A future price move with strong volume would carry different information from a similar move with very low volume.
Final assessment of the chart
The supplied daily chart shows a major upward move after a long period of weaker price action. The latest close of ₹918.90 is above the marked ₹895.05 resistance, and the session had unusually high volume of 27.94M relative to much of the visible history.
The first level above the market is ₹960, which was the latest high. Above that, ₹1,000 and the prior high near ₹1,030 are the next visible reference areas.
On the downside, ₹895.05 is the key short-term level. Below it, ₹855, ₹835.55, and ₹800 become relevant reference points. The wider chart also shows ₹720–₹706 as a major lower zone.
The chart therefore has a clear technical structure, but it does not provide certainty. The main question is whether the market can maintain the area above ₹895.05 after such a large one-day move. The answer will depend on future price and volume data, not on the latest candle alone.
This analysis is based only on the supplied chart and is not financial, investment, tax, or legal advice. A technical chart does not account for company fundamentals, corporate events, market-wide shocks, liquidity, personal risk tolerance, or changes after the chart date. Any financial decision should take those factors into account separately.
FAQs About the Whirlpool India Chart
1. What is the latest closing price shown on the chart?
The latest closing price shown for Whirlpool of India is ₹918.90. The stock gained ₹65.45, or 7.67%, during the session shown on the chart.
2. What were the open, high and low prices?
The stock opened at ₹855.00, reached an intraday high of ₹960.00, and recorded an intraday low of ₹835.55. The wide range shows high price activity during the session.
3. What is the most important level on the chart?
The most important near-term reference level is ₹895.05. This is the horizontal level marked on the chart and sits below the latest close of ₹918.90.
4. Why is ₹895.05 important?
The stock moved above ₹895.05 and closed at ₹918.90. From a technical perspective, traders may watch whether price can remain above this area. A sustained move below it would change the short-term chart structure.
5. What is the next resistance above ₹918.90?
The immediate reference level is ₹960, which was the latest session high. Above ₹960, the chart shows ₹1,000 and then the previous visible high near ₹1,030.
6. Is ₹960 a confirmed resistance level?
It is better described as a recent resistance reference rather than a confirmed permanent resistance level. It is based on the latest intraday high of ₹960. Future price action would provide more evidence about its significance.
7. What does ₹1,000 represent?
₹1,000 is a round-number price level. Such levels often receive attention in markets, but the chart alone cannot establish that ₹1,000 must act as resistance.
8. What is the highest price visible on the chart?
The chart marks a high of ₹1,030. This is the highest visible price in the displayed period and therefore provides an important historical reference.
9. What is the key support level after ₹895.05?
If price falls below ₹895.05, the next reference areas visible on the chart include ₹855 and ₹835.55. The latter is the low of the latest session.
10. What happens if the stock falls below ₹835.55?
A move below ₹835.55 would mean that the stock has lost the low of the latest large bullish candle. From a chart perspective, this would show additional weakness in the recent move.
11. Is ₹800 also an important level?
Yes. The chart shows repeated price activity around the ₹800 area during the earlier months. It can therefore serve as a broader support reference if the price moves lower.
12. What are the major lower levels on the chart?
The chart shows a lower region around ₹720 to ₹706. The marked chart low is ₹706. These levels belong to the larger price structure rather than the immediate breakout area.
13. Why is the latest volume important?
The latest reported volume is 27.94 million shares. This is much higher than the volume visible during much of the earlier chart period. High volume alongside a strong price move can provide additional technical evidence that market participation was substantial.
14. Does high volume guarantee that the price will continue upward?
No. High volume does not guarantee a future price direction. It only shows that a large amount of trading activity occurred. The next price and volume data are needed to assess whether the move receives further confirmation.
15. What is a possible breakout confirmation?
One possible form of confirmation would be continued price action above ₹895.05, followed by a move above the recent high of ₹960. This would represent continued strength above the two most relevant short-term reference levels on the supplied chart.
16. What would indicate a possible failed breakout?
A sustained move back below ₹895.05 could weaken the breakout structure. The significance would depend on how long price stays below the level, the size of the move, and the accompanying volume.
17. Is a pullback toward ₹895.05 necessarily negative?
No. After a sharp price move, a pullback can occur. If price approaches ₹895.05 and later recovers, that could provide different technical information from a sustained breakdown below the level.
18. Why is the latest candle significant?
The latest candle shows an open of ₹855.00, a high of ₹960.00, a low of ₹835.55, and a close of ₹918.90. It therefore covers a wide price range and finishes above the marked ₹895.05 level.
19. Does this chart prove that Whirlpool will reach ₹1,000 or ₹1,030?
No. The chart shows those prices as historical or reference levels. It cannot establish that the stock will reach either level in the future. Future market conditions can produce very different outcomes.
20. What are the main levels to monitor from this chart?
The main reference points are ₹895.05, ₹960, ₹1,000, ₹1,030, ₹835.55, and ₹800. The chart’s wider lower zone is around ₹720–₹706. Among these, ₹895.05 is particularly relevant because it is the marked breakout level, while ₹960 is the latest session high.
Note: These FAQs describe the supplied chart and its visible technical structure. They are not a recommendation to buy, sell, or hold Whirlpool of India shares, and they do not predict future returns.