
This review uses only the daily DELTACORP chart supplied in the question. It focuses on price structure, Fibonacci levels, volume, support, resistance, and possible chart scenarios. It does not use company financial results, news, management statements, sector data, or any other external source.
The chart alone cannot establish the future price of a security. Technical levels can fail, sometimes without much warning. The purpose here is to explain what the chart shows in simple terms, rather than to give a personal investment recommendation. Any decision about a trade or investment requires separate review of risk, time horizon, capital size, valuation, company information, and market conditions.
Current Price Structure
The chart shows a major change in the short-term price structure of Delta Corp.
The stock first fell from the area near ₹62 and then moved down toward the lower part of the chart. The lowest marked price is ₹51.66, while the Fibonacci base level is shown at ₹51.58. After that low, price began to recover.
The recovery first faced several small candles. Price then moved above ₹55, ₹57.50 and ₹59.59. After that, the pace of the move became much stronger.
The chart shows a close of ₹76.84, with a daily high of ₹77.89 and a daily low of ₹69.31. The day therefore had a very wide range. The close also sits close to the upper part of that range.
This type of price action usually tells us that demand was strong during the session. However, one strong session does not prove that the same force will remain for the next few sessions.
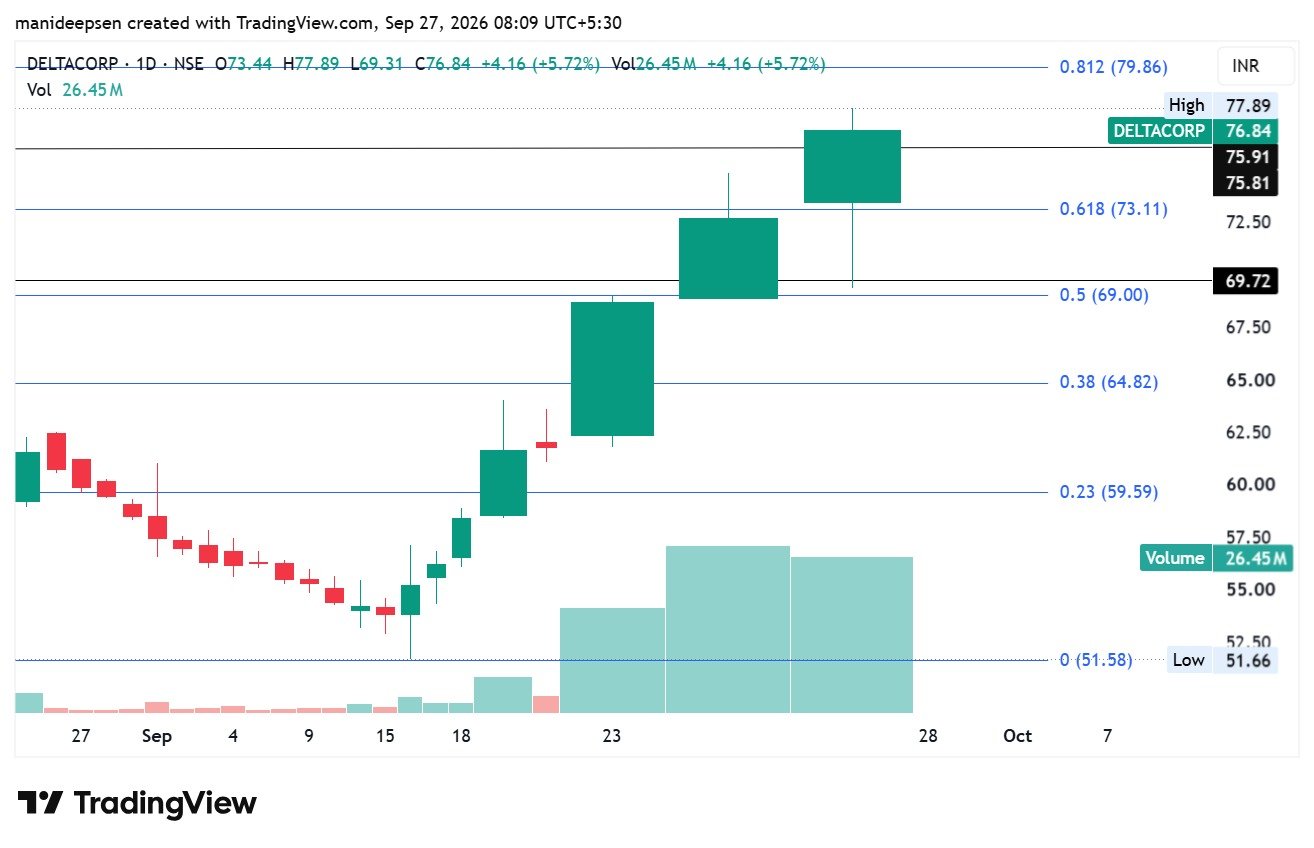
| Chart item | Value |
|---|---|
| Open | ₹73.44 |
| High | ₹77.89 |
| Low | ₹69.31 |
| Close | ₹76.84 |
| Daily change | +₹4.16 |
| Daily change | +5.72% |
| Volume | 26.45M |
| Chart low | ₹51.66 |
| Fibonacci 0 level | ₹51.58 |
| Fibonacci 23.6% | ₹59.59 |
| Fibonacci 38.2% | ₹64.82 |
| Fibonacci 50% | ₹69.00 |
| Fibonacci 61.8% | ₹73.11 |
| Fibonacci 81.2% | ₹79.86 |
The Larger Move on the Chart
The most important feature is the distance between the low near ₹51.58 and the current price near ₹76.84.
The move has covered more than ₹25 from the Fibonacci base. That is a substantial rise in relation to the price range shown on the chart.
The early part of the recovery was slow. Around the middle of September, the chart had several small candles near ₹54–₹58. After that, price moved through ₹59.59 and then through ₹64.82.
Once price crossed ₹64.82, the move became much stronger. The stock then moved toward ₹69 and later above ₹73.11.
This creates a clear sequence of higher price levels. The chart therefore has a bullish short-term structure. That description refers only to the price pattern on the supplied chart. It does not mean that the stock must continue to rise.
The most recent candles also have large real bodies. A large green candle means that the close was well above the open. Such candles can reflect strong demand, but they can also appear near the end of a rapid move. For that reason, the next few sessions can be more important than the last candle by itself.
Fibonacci Levels and Their Role
The Fibonacci levels on the chart give a useful framework for price zones.
The first major level is ₹59.59, marked as the 23.6% level. Price moved above this area before the stronger part of the recovery began.
The next level is ₹64.82, marked as 38.2%. Price also moved above this level with a strong green candle.
The middle level is ₹69.00, marked as 50%. Price crossed this area and then stayed above it.
The next level is ₹73.11, marked as 61.8%. This is particularly important because the latest price sits above it. If price stays above this area after a pullback, the chart can retain its current short-term structure.
The upper reference level shown on the chart is ₹79.86. This sits close to the latest high of ₹77.89. Therefore, the zone between about ₹78 and ₹80 deserves close attention from a technical point of view.
| Fibonacci zone | Price | Chart role |
|---|---|---|
| 0% | ₹51.58 | Base of the marked range |
| 23.6% | ₹59.59 | Earlier resistance, now lower support area |
| 38.2% | ₹64.82 | Earlier resistance, now support area |
| 50% | ₹69.00 | Midpoint of the marked range |
| 61.8% | ₹73.11 | Key near-term support |
| 81.2% | ₹79.86 | Upper reference and nearby resistance area |
Fibonacci levels are not guarantees. They are reference zones that traders often use to assess price reaction. A price level becomes more useful when actual market activity supports it through repeated reactions.
The ₹73.11 Level
Among the levels on the chart, ₹73.11 deserves special attention.
The stock moved above ₹73.11 and closed at ₹76.84. That places the latest close above the 61.8% Fibonacci level.
The daily low, however, was ₹69.31. This means sellers did push the price below ₹73 during the session. Buyers then brought price back above ₹73 before the close.
That detail matters.
It shows that the session had a large amount of price movement. It also shows that the lower prices did not remain in control by the close.
If future sessions hold above ₹73.11, the level may act as a reference for short-term price support. If price moves below it and remains below it, the next areas to watch would be around ₹69.00 and then ₹64.82.
A single move below a level is not enough to call a confirmed breakdown. The daily close, follow-through, volume, and price action on later sessions would matter.
The ₹77.89–₹79.86 Zone
The area above the current close is the main technical question on the chart.
The latest high is ₹77.89. The chart also marks ₹79.86 as the upper Fibonacci reference.
This creates a nearby zone from roughly ₹78 to ₹80.
Price may face supply in this area because it is close to the upper part of the marked Fibonacci range. The chart does not provide enough information to state that a reversal must occur there.
There are two basic possibilities.
If price moves above ₹77.89 and then holds above that level, the market may show further strength. A sustained move above ₹79.86 would also place price above the upper Fibonacci reference shown on the chart.
If price fails near ₹78–₹80 and then moves back below ₹73.11, the recent rise could enter a deeper correction or consolidation phase.
The distinction between a temporary rejection and a larger reversal would require later price data.
Volume Analysis
Volume is another important part of this chart.
The latest displayed volume is 26.45M. The chart shows much lower volume during the earlier decline and the early part of the recovery. Volume then increased as price moved higher.
This is useful because a price move with higher volume often has more market participation than a move with very low volume.
The volume bars near the latest price rise are much larger than many of the earlier bars. That adds weight to the observation that the recent price move had strong activity behind it.
At the same time, high volume does not automatically mean that price must continue higher. High volume can appear during both strong advances and major changes in direction.
For that reason, volume should be read together with the closing price and the next few sessions.
Candle Structure
The latest candle has an open near ₹73.44, a high of ₹77.89, a low of ₹69.31, and a close of ₹76.84.
The close is much closer to the high than to the low. This suggests that the session ended with buyers in control relative to the large intraday range.
However, the wide range also means that the stock had significant volatility during the day.
The difference between the high and low is ₹8.58. Compared with the closing price of ₹76.84, this is a large daily range.
That has an important risk implication. A trader who enters after a large price move may face sizeable daily fluctuations. A small adverse move in percentage terms can translate into a meaningful rupee move when the daily range is this wide.
Support Zones
The chart gives several areas that can serve as technical reference points.
The first area is around ₹73.11. This is the nearest major Fibonacci level below the current close.
The next area is around ₹69.00–₹69.72. The chart has both the 50% Fibonacci level at ₹69.00 and a black horizontal level at ₹69.72. That makes the ₹69 area particularly relevant.
Below that, ₹64.82 is the next major Fibonacci reference.
The lower level at ₹59.59 is another important area, although a fall from ₹76.84 to ₹59.59 would represent a much deeper decline than a normal short-term pullback.
| Price zone | Possible technical role |
|---|---|
| ₹75.9 | Near-term price reference |
| ₹73.11 | Major near-term support |
| ₹69.72–₹69.00 | Stronger support zone |
| ₹64.82 | Deeper support |
| ₹59.59 | Major lower support |
| ₹51.58–₹51.66 | Base area shown on chart |
These levels should be treated as zones rather than exact lines. Markets rarely react to every technical level at one exact price.
What Would Strengthen the Current Structure
The current chart structure would remain technically firm if price holds above ₹73.11 and continues to form higher highs and higher lows.
A move above ₹77.89 would remove the most recent high as an immediate barrier. A move above ₹79.86 would take price beyond the upper Fibonacci reference shown on the chart.
Volume would add more evidence if a move above these levels came with strong activity and a firm daily close.
A strong close matters more than a brief intraday move above a level. For example, a price that trades above ₹80 for a short period but closes below ₹80 tells a different story from a session that closes firmly above that area.
What Would Weaken the Structure
The first warning would be a loss of ₹73.11.
A move below ₹73.11 would not automatically mean that the entire bullish structure has failed. It would simply show that the latest support level has lost strength.
A sustained move below the ₹69 area would be a more important technical change. It would place price back near the 50% Fibonacci level and could indicate a deeper correction.
A move toward ₹64.82 would represent a further loss of short-term momentum.
The chart therefore gives a clear framework: ₹73.11 is the first major level to watch, while ₹69 and ₹64.82 provide deeper reference areas.
Risk and Practical Interpretation
The main risk visible on the chart is not a lack of momentum. It is the speed of the recent rise.
Price has moved from about ₹51.58 to ₹76.84 in a relatively short period. After such a sharp move, price does not need to fall for the chart to cool down. It can also move sideways for several sessions.
This distinction is important. A sideways phase above ₹73.11 would not have the same meaning as a sharp fall below ₹69.
Another risk is the nearby ₹78–₹80 zone. Price is already close to that area. Therefore, the room between the current close and the marked upper reference is limited.
A person who considers a position based only on this chart should also account for the large daily range. The chart shows enough volatility to create meaningful short-term price changes.
Final Technical View
Based only on the supplied daily chart, Delta Corp has a strong short-term bullish price structure. The recovery from the ₹51.58 area has passed several major Fibonacci levels, and the latest close of ₹76.84 sits above the 61.8% level at ₹73.11.
The latest session also had high volume at 26.45M, a high of ₹77.89, and a close near the upper part of the daily range. These features support the observation that the latest move had strong market participation.
The main technical question now sits near ₹78–₹80. The chart marks ₹79.86 as the upper Fibonacci reference, while ₹77.89 is the latest high.
Below the current price, ₹73.11 is the key near-term level. The ₹69.00–₹69.72 area is the next major zone, followed by ₹64.82.
The chart therefore presents a simple technical map. Above ₹73.11, the current structure remains stronger. Around ₹78–₹80, price faces an important test. A firm move above that area would alter the current resistance structure. A sustained move below ₹73.11 would weaken the short-term setup, while a deeper move below ₹69 would show a more material loss of momentum.
These observations are technical, not a forecast or a recommendation to buy or sell. The chart alone cannot assess the company’s value, financial position, future results, regulatory factors, or broader market risk. Any real investment decision should use those factors in addition to the price chart.
ALSO READ: Protean Daily Chart: A Simple Technical Review
FAQs About the Delta Corp Chart
1. What is the current price of Delta Corp in the chart?
The chart shows a closing price of ₹76.84. The session opened at ₹73.44, reached a high of ₹77.89, and recorded a low of ₹69.31.
2. What is the short-term trend shown by the chart?
The chart shows a strong upward short-term trend. Price has moved from the ₹51.58 area to ₹76.84 and has crossed several Fibonacci levels during the recovery.
3. What is the major support level near the current price?
The main nearby support is ₹73.11, which is the 61.8% Fibonacci level shown on the chart. Price closing above this level keeps the recent structure relatively strong.
4. Why is ₹73.11 important?
₹73.11 is important because it marks the 61.8% Fibonacci level. The latest closing price is above this level, while the session also tested lower prices before recovering.
5. What is the next major resistance level?
The chart places the immediate resistance area around ₹77.89–₹79.86. ₹77.89 is the latest high, while ₹79.86 is the upper Fibonacci reference shown on the chart.
6. What happens if Delta Corp crosses ₹79.86?
A sustained move above ₹79.86 would place the price above the upper Fibonacci reference visible on this chart. Further price data would then be needed to identify new resistance levels.
7. Is ₹69 an important level?
Yes. The chart marks ₹69.00 as the 50% Fibonacci level. There is also a horizontal reference near ₹69.72, so the ₹69.00–₹69.72 area can be treated as an important technical zone.
8. What is the next support below ₹69?
The next major Fibonacci support shown on the chart is ₹64.82, which represents the 38.2% level.
9. What does the ₹59.59 level represent?
₹59.59 is the 23.6% Fibonacci level. It was part of the earlier recovery structure and can act as a lower technical reference if price experiences a much deeper decline.
10. What is the lowest level shown on the chart?
The marked Fibonacci base is ₹51.58, while the actual displayed low is ₹51.66. This area represents the bottom of the price range used for the Fibonacci study.
11. What does the latest candle indicate?
The latest candle opened at ₹73.44 and closed at ₹76.84, after reaching ₹77.89 and falling as low as ₹69.31. The close near the upper part of the daily range shows strong buying pressure during the session.
12. Why is the latest volume important?
The chart shows volume of 26.45M. This is considerably higher than many of the earlier volume bars. The increase in volume occurred alongside the strong price rise, which indicates substantial market activity.
13. Does high volume guarantee further price growth?
No. High volume only shows that a large amount of trading activity took place. It does not guarantee the direction of the next move. Future price action must confirm whether buyers or sellers retain control.
14. Has the stock become overextended?
The chart shows a rapid rise from approximately ₹51.58 to ₹76.84. That makes short-term volatility an important consideration. However, a conclusion about whether the stock is fundamentally overvalued cannot come from this chart alone.
15. What would weaken the current technical structure?
A sustained move below ₹73.11 would weaken the immediate structure. A move below the ₹69 area would represent a more significant loss of short-term momentum and could bring ₹64.82 into focus.
16. What would support further bullish momentum?
A move above the recent high of ₹77.89, followed by a sustained move toward or above ₹79.86, would show that price has moved through the main resistance area visible on the chart.
17. Is a pullback possible after this rise?
Yes. A pullback is always possible after a rapid price move. The chart alone cannot establish whether one will occur. The reaction around ₹73.11, ₹69, and ₹64.82 would provide useful information if price declines.
18. What is the significance of ₹64.82?
₹64.82 is the 38.2% Fibonacci level. It is below both ₹69 and ₹73.11, so a move toward this area would represent a deeper correction from the current price.
19. Can this chart alone be used for an investment decision?
The chart can help with technical analysis, but it does not provide information about financial results, valuation, debt, business performance, regulatory developments, management decisions, or broader market conditions. Those factors require separate analysis.
20. What are the most important levels to watch?
The main levels from this chart are ₹79.86, ₹77.89, ₹73.11, ₹69.72–₹69.00, ₹64.82, and ₹59.59. In simple terms, ₹73.11 is the key nearby support, while ₹77.89–₹79.86 is the main upper zone shown by the chart.