
In the world of financial markets, analyzing stock indices such as the Nifty is crucial for investors and traders alike. Technical analysis, which involves studying historical price data and chart patterns, provides valuable insights into potential market movements. In this analysis, we’ll delve into the current outlook for the Nifty based on technical indicators, focusing on key support and resistance levels, as well as potential price targets.
Understanding Technical Analysis
Technical analysis is based on the premise that historical price movements repeat themselves, and by analyzing past data, investors can predict future price trends. It relies on various tools and techniques, including chart patterns, trend lines, and technical indicators, to identify potential entry and exit points in the market.
Current Outlook for the Nifty
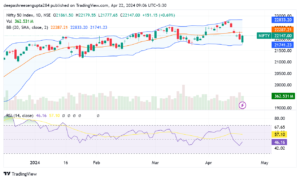
According to recent chart analysis, the Nifty is poised for a potential flat to positive opening above the 22140 levels. This indicates a neutral to slightly bullish sentiment among market participants. However, further upside momentum is expected once the index breaches the 22560 levels, signaling a clear path for upward movement.
Key Resistance Levels:
22140: Immediate resistance level indicating a potential flat to positive opening.
22560: Significant resistance level where the index is expected to gain momentum and march upwards.
Key Support Levels:
22040: First support level below 22140, indicating initial downside protection.
21860: Second support level providing additional downside support.
21700: Critical support level representing a significant barrier to further downside movement.
Technical Analysis Tools and Techniques
To further validate these projections, let’s utilize some common technical analysis tools and techniques:
Moving Averages: Moving averages smooth out price data and help identify trends. The 50-day and 200-day moving averages are commonly used to gauge short-term and long-term trends, respectively. If the short-term moving average crosses above the long-term moving average, it’s considered a bullish signal, and vice versa.
Relative Strength Index (RSI): The RSI is a momentum oscillator that measures the speed and change of price movements. Readings above 70 indicate overbought conditions, while readings below 30 indicate oversold conditions. By monitoring the RSI, investors can identify potential reversal points in the market.
Volume Analysis: Volume is an important indicator of market strength and helps confirm the validity of price movements. Increasing volume during an uptrend suggests bullish sentiment, while decreasing volume during a downtrend may indicate weakening momentum.
Implementation of Technical Analysis in Trading Strategies
Armed with this technical analysis, traders and investors can devise effective trading strategies to capitalize on potential market movements. Here are some strategies based on the current outlook for the Nifty:
Breakout Trading: Traders can initiate long positions once the Nifty breaks above the 22560 resistance level, with a target price set at higher levels. Conversely, short positions can be considered if the index fails to sustain above this level.
Support and Resistance Trading: Investors can implement a support and resistance trading strategy by buying near support levels and selling near resistance levels. This strategy aims to capture price movements within a defined range while minimizing downside risk.
Trend Following: Trend-following strategies involve buying during uptrends and selling during downtrends. Traders can use moving averages or trend lines to identify the direction of the trend and initiate trades accordingly. In the current scenario, a bullish trend is expected once the Nifty surpasses the 22560 resistance level.
Risk Management and Trade Execution
While technical analysis provides valuable insights into market trends, it’s essential to practice proper risk management and trade execution. Here are some tips to mitigate risks and enhance trading effectiveness:
Set Stop Loss Orders: Establishing stop-loss orders helps limit potential losses and protect capital in case the market moves against your position. Stop-loss levels can be placed below key support levels identified through technical analysis.
Diversify Your Portfolio: Avoid putting all your capital into a single trade or asset class. Diversifying your portfolio across different sectors and asset classes helps spread risk and reduce the impact of adverse market movements.
Stay Informed: Keep abreast of market news, economic indicators, and geopolitical events that may impact the Nifty and broader financial markets. Staying informed allows traders to adapt their strategies accordingly and capitalize on emerging opportunities.
Conclusion
Technical analysis serves as a valuable tool for predicting market trends and identifying potential entry and exit points in the Nifty. By analyzing key support and resistance levels, as well as employing various technical indicators, investors and traders can formulate effective trading strategies to navigate the market with confidence.
However, it’s important to remember that technical analysis is not foolproof and should be used in conjunction with other forms of analysis, such as fundamental analysis and market sentiment. Additionally, risk management and trade execution play crucial roles in successful trading, and traders should always prioritize capital preservation and disciplined decision-making.
In conclusion, by applying sound technical analysis principles and adhering to prudent risk management practices, investors can enhance their chances of success in trading the Nifty and other financial instruments.