
Himadri Speciality Chemical has remained under investor focus in recent years because of strong financial growth and rising presence in advanced material segments. The company operates in specialty chemicals, carbon products, and battery material businesses. These sectors currently receive strong market attention because of future demand expectations linked with electric vehicles and energy storage industries.
On June 8, 2026, the stock closed at Rs. 667.20 on NSE. The share ended the session lower by 2.6 percent. The previous close stood at Rs. 685.05. During the day, the stock touched a high of Rs. 692.15 and a low of Rs. 633.80. The broad trading range reflected heavy activity and short-term volatility in the counter.
Even after the decline, the long-term trend in both stock performance and business growth continued to remain strong. The recent fall appeared more connected with market behaviour rather than any visible breakdown in core financial performance.
Profit Numbers Show Consistent Expansion
The latest quarterly figures indicated steady improvement in profitability. Net profit came at Rs. 207.53 crore, while consolidated net profit stood at Rs. 200.79 crore. Adjusted earnings per share remained at Rs. 3.98.
The quarterly trend chart also reflected gradual expansion in earnings across several quarters. Such movement usually indicates stable execution and healthy operational performance within the business.
The company also did not report major prior period adjustments or unusual write-offs during the reported quarter. Prior period items remained at zero, while miscellaneous expenses written off also stood at zero. This data may support confidence in earnings quality because the reported profit did not depend heavily on exceptional accounting adjustments.
Return on Equity Stays at Healthy Levels
Return on Equity stood at 18.10 percent. This ratio measures the profit generated from shareholder capital. A figure near this level generally indicates efficient use of equity within industrial and specialty chemical businesses.
Healthy ROE levels often attract long-term investors because they reflect the company’s ability to generate profit without excessive dependence on fresh capital.
Strong Return on Capital Employed
Return on Capital Employed came at 22.42 percent. This metric often receives close attention from institutional and long-term investors because it reflects how effectively a company uses total capital within operations.
A ROCE above 20 percent generally indicates strong operational efficiency and disciplined capital allocation. Within cyclical sectors such as chemicals and material businesses, such levels often reflect stable margin structure and healthy business execution.
Asset Utilisation Remains Stable
Return on Assets stood at 12.99 percent. This ratio measures profit generation against total assets owned by the business. The figure suggested that the company managed its assets in an effective manner during the reported period.
Healthy ROA levels may also indicate balanced expansion without unnecessary pressure on the balance sheet.
Multi-Year Returns Remain Strong
The long-term stock performance remained one of the strongest aspects visible in the data. The share price recorded a one-year growth rate of 38 percent. The three-year growth figure stood at 73.29 percent, while the five-year growth rate reached 67.44 percent. Over ten years, the stock reported growth of 41.93 percent.
These figures reflected substantial wealth creation across multiple market cycles. Such performance often attracts fresh investor participation, especially when supported by improving profitability and operational expansion.
At the same time, strong historical returns may also raise future expectations from the market. Whenever expectations rise sharply, short-term volatility may increase because investors closely track every quarterly development.
Sales Expansion Slows in Recent Period
Business growth data reflected a mixed but largely positive picture. Net sales growth remained modest over the recent three-year period at 3.76 percent. However, the five-year sales growth rate stood at 22.65 percent, while the ten-year figure came at 13.43 percent.
The slower near-term sales growth may indicate moderation in demand conditions or changes in market cycles. However, the longer-term trend still reflected business expansion across multiple periods.
Revenue growth remains an important factor because it reflects actual business demand. Stable sales expansion often supports sustainability in earnings over longer periods.
Operational Efficiency Supports Profitability
EBITDA growth remained much stronger than revenue growth. EBITDA growth stood at 34.08 percent for three years and 49.02 percent for five years.
This trend suggested improvement in operational efficiency and margin structure within the business. Margin expansion may come from multiple factors, including better product mix, improved pricing power, cost control, or stronger contribution from higher-value segments.
Whenever EBITDA growth rises faster than sales growth, it usually indicates that the company generates more operating profit from each unit of revenue.
Such trends often strengthen investor confidence because they reflect improving business quality rather than only volume expansion.
Earnings Expansion Outpaces Revenue Growth
Net profit growth remained one of the strongest elements in the financial data. The company reported a three-year profit growth rate of 46.47 percent. The five-year figure stood at 73.73 percent, while the ten-year growth rate came at 45.48 percent.
These numbers indicated that earnings expanded at a much faster pace than revenue during several periods.
The difference between sales growth and profit growth may point toward operational leverage, efficiency improvement, stronger pricing power, or better contribution from high-margin products.
However, market participants often monitor such trends carefully because sustainability becomes an important question whenever margins rise sharply over time.
Battery Material Exposure Adds Market Attention
Recent investor interest in Himadri Speciality Chemical also linked closely with its exposure to battery materials and advanced carbon products.
The market currently assigns strong importance to companies connected with electric vehicle supply chains, energy storage systems, and advanced industrial materials. Businesses with exposure to such themes often receive higher market valuations because investors expect future demand growth.
This optimism may support strong price movement over long periods. However, it may also increase volatility whenever investors reassess growth expectations or valuation levels.
Short-Term Decline Does Not Necessarily Reflect Fundamental Weakness
Multiple Factors May Influence Daily Price Movement
The recent decline in the stock price did not necessarily indicate weakness in the core business. Short-term movement in stocks often comes from several market-related factors beyond quarterly earnings data.
Profit booking after a strong rally remains one possible explanation. Investors who entered at lower levels may choose to secure gains after rapid appreciation in the stock price.
Market valuation may also influence short-term movement. Whenever a stock delivers strong returns within a limited period, expectations from future growth often become elevated. In such situations, even healthy results may fail to fully satisfy investor expectations.
Sector sentiment may also affect stock movement. Specialty chemical companies often react to changes in raw material prices, export demand, commodity cycles, and institutional fund allocation patterns.
Financial Strength Continues to Support Long-Term Outlook
The available financial data currently reflected a company with healthy profitability, improving operational performance, and strong long-term earnings growth.
Return ratios remained strong, quarterly profits continued to improve, and long-term shareholder returns stayed impressive. At the same time, the stock also carried higher market expectations because of its sharp appreciation and exposure to future-oriented business segments.
Future performance may depend on whether the company continues to maintain earnings quality, operational efficiency, margin stability, and long-term business expansion across its core and emerging segments.
Stock Remains Near Its 52-Week High
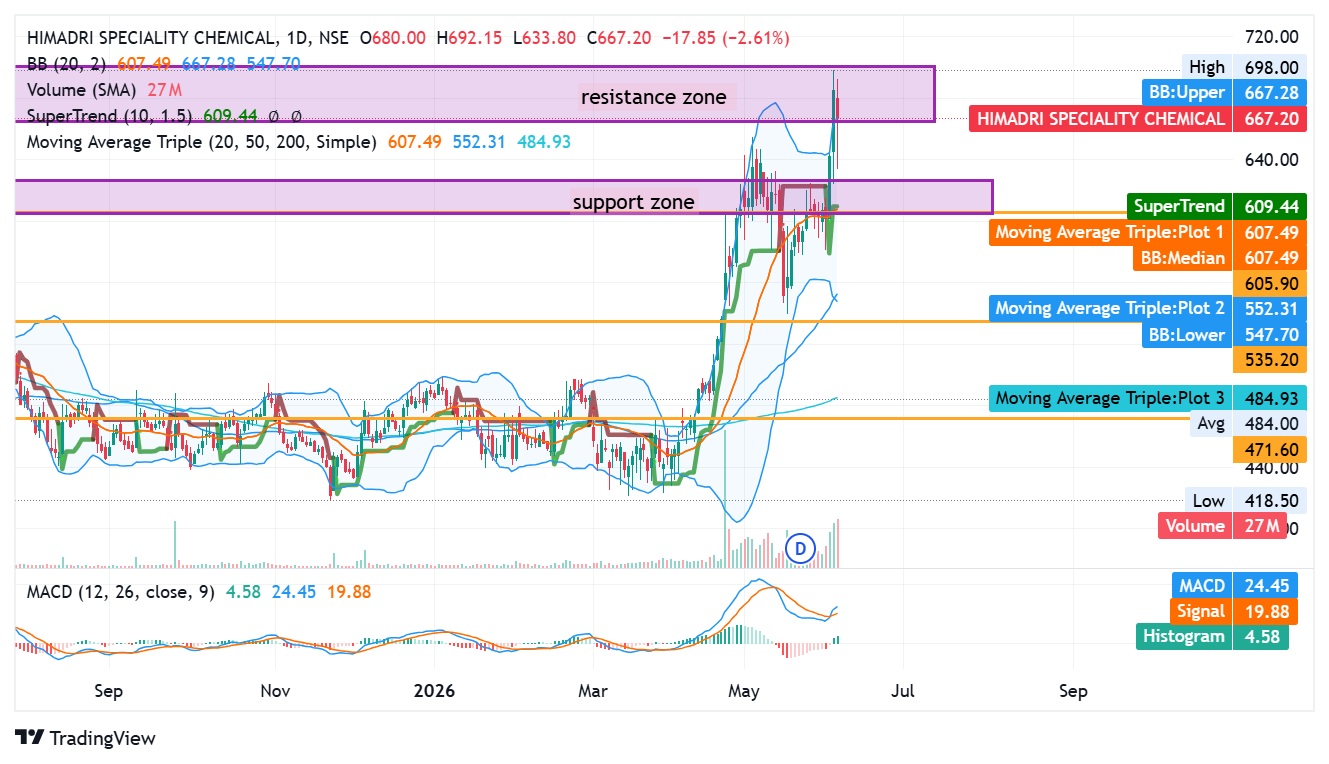
Himadri Speciality Chemical continued to remain under strong market attention after a major rally during the last few years. The stock closed at Rs. 667.20 on June 8, 2026, with a daily decline of 2.61 percent. The share opened at Rs. 680.00 and touched an intraday high of Rs. 692.15. The low remained at Rs. 633.80.
The stock currently trades very close to its 52-week high of Rs. 698.00, recorded on June 5, 2026. The 52-week low stood at Rs. 418.50 on November 24, 2025. This wide difference between the yearly high and low reflected strong upward movement during the last several months.
Even after the recent decline, the broader trend still appeared positive because the stock continued to remain well above major moving average levels.
Multi-Year Performance Remains Exceptional
The long-term return profile remained one of the strongest aspects visible in the available data. The stock generated returns of 32.25 percent during the last one year. The three-year return stood at 398.48 percent, while the five-year return reached 1,087.16 percent.
The annualised growth figures also remained notable. The stock reported annual growth of 39.27 percent over three years and 64.29 percent across five years.
Year-to-date return came at 35.25 percent, which reflected continued investor confidence during 2026 despite short-term volatility.
However, shorter time periods showed signs of consolidation. One-month movement stood at 2.96 percent, while recent downside pressure also remained visible in the negative short-term percentage figures attached with the data.
Such movement often appears after major rallies because investors reassess valuation levels and future growth expectations.
Resistance Zone Appears Near Rs. 690–700
The technical chart showed a clearly defined resistance area near Rs. 690 to Rs. 700. The stock attempted to cross this region but faced selling pressure near the upper band.
The price also remained close to the upper Bollinger Band level of Rs. 667.28. Stocks near upper Bollinger ranges often reflect strong momentum, though such positions may also indicate temporary overheating in the short term.
The chart showed repeated rejection near the resistance region. This pattern may suggest that traders currently view the Rs. 700 zone as an important psychological and technical level.
If the stock achieves sustained movement above this area with strong volume support, market sentiment may remain positive. However, failure near resistance zones sometimes leads to temporary consolidation or profit booking.
Major Support Appears Near Rs. 605–610
The chart also highlighted a visible support region near Rs. 605 to Rs. 610. This zone aligned closely with the SuperTrend indicator at Rs. 609.44 and the 20-day moving average near Rs. 607.49.
The stock recently tested this area before sharp recovery toward higher levels. Such behaviour may indicate active buyer participation near lower zones.
Another support area appeared near Rs. 552, which matched the 50-day moving average and lower Bollinger Band region. Stronger long-term support remained near Rs. 484, which aligned with the 200-day moving average.
As long as the stock remains above major moving averages, the broader trend may continue to favour bullish sentiment from a technical perspective.
Price Trades Above Key Trend Indicators
The moving average structure remained positive across all major time frames.
The 20-day moving average stood at Rs. 607.49. The 50-day moving average remained near Rs. 552.31, while the 200-day moving average stood at Rs. 484.93.
The current market price of Rs. 667.20 remained significantly above all three averages.
This alignment generally reflects trend strength because shorter averages stayed above longer averages. Such positioning often appears during strong upward cycles where market sentiment remains constructive over medium and long durations.
At the same time, a sharp gap between current price and long-term moving averages may also indicate elevated momentum. Stocks in such situations sometimes witness temporary cooling phases before the next directional move.
Momentum Trend Still Favors Buyers
The MACD indicator also remained in positive territory. MACD stood at 24.45, while the signal line remained at 19.88. The histogram value stood at 4.58.
The MACD line continued to stay above the signal line, which generally reflects positive momentum within the prevailing trend.
However, the histogram showed moderation compared with earlier peaks on the chart. Such movement may suggest slowing momentum after a rapid upward phase.
This condition does not automatically indicate reversal, though it may reflect near-term exhaustion after strong price appreciation.
Trading Value Remains High
Trade activity remained elevated during the session. Traded volume stood at 270 lakh shares, while traded value reached Rs. 1,795.22 crore.
Such numbers reflected active participation from both institutional and retail market participants.
The company also maintained a total market capitalisation of Rs. 33,123.16 crore. Free float market capitalisation stood at Rs. 15,369.38 crore.
Impact cost remained low at 0.05, which generally reflects healthy liquidity and smoother trade execution for larger market participants.
However, deliverable quantity remained at 10.63 percent of traded quantity. Lower delivery percentages sometimes indicate speculative or short-term market activity rather than long-duration positional accumulation.
Price Swings May Continue
Daily volatility stood at 2.38 percent, while annualised volatility remained at 45.47 percent.
These numbers reflected large price movement capability within short periods. Stocks with high momentum and strong retail participation often show elevated volatility during bullish phases.
The price band ranged between Rs. 533.80 and Rs. 800.60 under the exchange framework. Such wide limits also reflected the stock’s active nature.
Investors and traders often monitor volatility closely because sharp price swings may increase both opportunity and risk.
P/E Ratio Reflects High Expectations
The stock currently traded at a symbol P/E ratio of 45.78.
This valuation level indicated that the market already priced strong future growth expectations into the stock.
Higher P/E multiples often appear in companies with strong profit growth, expanding margins, and future sector opportunities. Himadri’s exposure to battery materials and advanced carbon products may support such market optimism.
However, elevated valuation levels may also increase sensitivity toward future earnings performance. Whenever market expectations rise sharply, even healthy quarterly results sometimes fail to fully satisfy investors.
This situation may partly explain recent profit booking near the 52-week high zone.
Carbon Black Sector Receives Fresh Attention
Himadri Speciality Chemical belongs to the Carbon Black industry and also operates in specialty material segments linked with future industrial demand.
The company remains part of the NIFTY Smallcap 100 index, which increases visibility among institutional investors and thematic funds.
The market currently places strong focus on businesses connected with electric vehicles, battery supply chains, and advanced material applications. Such themes may continue to support investor attention toward companies operating in related sectors.
At the same time, cyclical industries often react to changes in raw material costs, export demand, commodity cycles, and global industrial activity.
Trend Structure Remains Positive Despite Near-Term Pressure
The overall technical structure currently reflected a stock within a strong long-term uptrend but near an important resistance zone.
The price remained above all key moving averages, the SuperTrend indicator stayed positive, and momentum indicators continued to support bullish sentiment.
However, the stock also appeared close to overextended territory after sharp appreciation during recent months. The repeated rejection near the Rs. 690–700 zone may attract temporary consolidation or profit booking in the near term.
From a broader perspective, the combination of strong long-term returns, healthy liquidity, rising profitability, and future sector exposure continued to support positive market interest.
Future movement may largely depend on whether the company continues to deliver earnings growth strong enough to justify current valuation levels and sustain investor expectations.
Disclaimer: This article is for informational and educational purposes only. It does not constitute investment advice, financial recommendation, or a buy or sell suggestion. Stock market investments carry risk, and readers should conduct independent research or consult a qualified financial advisor before making investment decisions.
Frequently Asked Questions
Is Himadri Speciality Chemical still in an uptrend?
The broader trend still appeared positive because the stock traded above the 20-day, 50-day, and 200-day moving averages. Momentum indicators also remained supportive.
Why did the stock face pressure near Rs. 700?
The Rs. 690–700 zone acted as a major resistance area on the chart. Investors may have booked profits near this psychological and technical level after the sharp rally.
What does the P/E ratio of 45.78 indicate?
The valuation suggested that the market already priced strong future growth expectations into the stock. High P/E ratios often reflect optimism toward future earnings potential.
What are the major support levels for the stock?
The first major support zone appeared near Rs. 605–610. Additional support remained near Rs. 552 and Rs. 484 based on moving averages.
Does the stock show high volatility?
Yes. Daily volatility stood at 2.38 percent, while annualised volatility remained at 45.47 percent. Such levels reflected sharp price movement potential within short periods.
ALSO READ: Why Titagarh Rail Systems Share Price Shows Strong Growth
DARA SOURCE: NSE INDIA