
Shares of CCL Products (India) Limited saw a strong rise in the latest trading session. The stock closed at Rs. 1,173 after a gain of 8.7 percent. The previous close stood at Rs. 1,079.10. During the session, the stock touched a high of Rs. 1,219.90 and a low of Rs. 1,061.20. The VWAP came at Rs. 1,154.43.
The price action showed strong buying interest across the day. The stock opened slightly lower at Rs. 1,070, but buyers took control after the early phase of trade. The closing level stayed well above the VWAP, which often reflects sustained market participation through the session.
This type of move usually does not come from technical factors alone. In many cases, market participants react to business growth, earnings visibility, sector trends, and future expectations. The recent financial data of the company gives some support to this view.
Revenue Growth Remains Strong
The quarterly financial numbers show strong growth in revenue. Consolidated net sales for the latest quarter stood at Rs. 1,224.44 crore. The chart pattern in the quarterly section also showed a steady rise in sales during the last several quarters.
Strong revenue expansion often reflects healthy demand for products and better market reach. In the case of CCL Products, the company operates in the coffee segment with a large export presence. Growth in export demand can support higher sales over time.
The company also showed strong annual growth numbers. The growth pattern section highlighted that net sales growth reached 43.52 percent on a trailing twelve month basis. The three-year growth rate stood at 29.11 percent, while the five-year growth rate also came at 29.11 percent.
These numbers suggest that the company maintained consistent business expansion across different time periods. Sustained growth over several years usually attracts investor attention because it may indicate business stability and market acceptance.
EBITDA Trend Shows Operational Strength
EBITDA for the latest quarter came at Rs. 191.82 crore. The chart trend suggested gradual improvement over the past several quarters.
EBITDA growth often reflects operating strength before interest, tax, and depreciation costs. In this case, EBITDA growth remained healthy alongside revenue expansion. The EBITDA growth rate stood at 32.04 percent on a trailing twelve month basis. The three-year growth rate came at 22.38 percent, while the five-year growth figure stood at 19.74 percent.
These figures suggest that the company managed to expand operations while maintaining reasonable profitability levels. Market participants often view stable EBITDA growth as a positive sign because it may reflect business efficiency and healthy demand conditions.
The expenditure figure for the quarter stood at Rs. 1,032.62 crore. Even with higher expenses, the company reported healthy EBITDA numbers. This may suggest that revenue growth remained ahead of cost pressure during the reported period.
Profit Numbers Reflect Positive Business Momentum
Profit trends also showed improvement. Profit before tax stood at Rs. 123.14 crore for the latest quarter. The quarterly chart pattern showed gradual improvement over time.
Net profit growth reached 25.06 percent on a trailing twelve month basis. The three-year profit growth rate stood at 10.98 percent, while the five-year figure came at 16.32 percent.
These numbers indicate that earnings growth remained positive across multiple periods, although profit growth stayed lower than sales growth. Such a pattern can appear in businesses where raw material costs, operating costs, or expansion expenses rise alongside revenue.
Still, positive profit growth over long periods usually supports market confidence. Investors often focus on companies that show stable earnings expansion because future expectations depend heavily on profit visibility.
ALSO READ: Top Trending Stocks, Highs & Movers to Watch Now
Return Ratios Stay At Healthy Levels
Return ratios provide another view of business quality. The company reported a return on equity of 17.23 percent. Return on capital employed stood at 13.15 percent, while return on assets came at 7.98 percent.
These figures suggest that the company generated reasonable returns from shareholder capital and business assets. A return on equity above 15 percent often reflects acceptable capital efficiency in many manufacturing and export-oriented businesses.
However, the ratio charts also showed a gradual decline during recent years. This trend may suggest that the company deployed additional capital for expansion projects or future growth plans. In such situations, return ratios can soften for some time before new investments contribute fully to earnings.
The current numbers still remain within a reasonable range, although future quarterly performance may play an important role in determining whether return ratios improve further.
Valuation Stays On The Higher Side
The valuation metrics suggest that the market currently assigns a premium to the stock. Earnings per share stood at Rs. 29.07, while the price-to-earnings ratio came at 40.26.
The industry PE stood at 70.71. Even so, the present valuation level suggests that investors already expect strong future growth from the company. Stocks with high PE ratios usually require continued earnings expansion to maintain market confidence.
The price-to-book ratio stood at 6.67, while the PEG ratio came at 3.67. The dividend yield remained low at 0.49 percent.
These figures suggest that the market currently values the company more as a growth business rather than a dividend-based investment option. In many cases, investors accept lower dividend yield when they expect future earnings growth and long-term business expansion.
Still, premium valuation levels can also increase market sensitivity. Any slowdown in earnings growth or pressure on margins may influence investor sentiment in the future.
Stock Touches New 52-Week High
CCL Products (India) Limited saw a sharp rise in share price during the latest trading session. The stock closed at Rs. 1,173 after a gain of 8.70 percent. During the session, the stock touched a fresh 52-week high of Rs. 1,219.90. The day low stood at Rs. 1,061.20.
The move came with strong traded activity. Total traded volume reached 63.72 lakh shares, while traded value stood at Rs. 735.60 crore. Such numbers usually reflect strong market participation across the session.
The stock also closed near the upper part of the day’s range. In many cases, this type of close may reflect sustained buyer interest through the session rather than short-term speculative movement alone.
The company currently has a total market capitalisation of Rs. 15,783 crore. The free float market capitalisation stood at Rs. 8,319.05 crore. The impact cost remained low at 0.06, which may indicate healthy liquidity in the counter.
ALSO READ: Top Trending Stocks, Highs & Movers to Watch Now
Price Structure Shows Strong Long-Term Trend
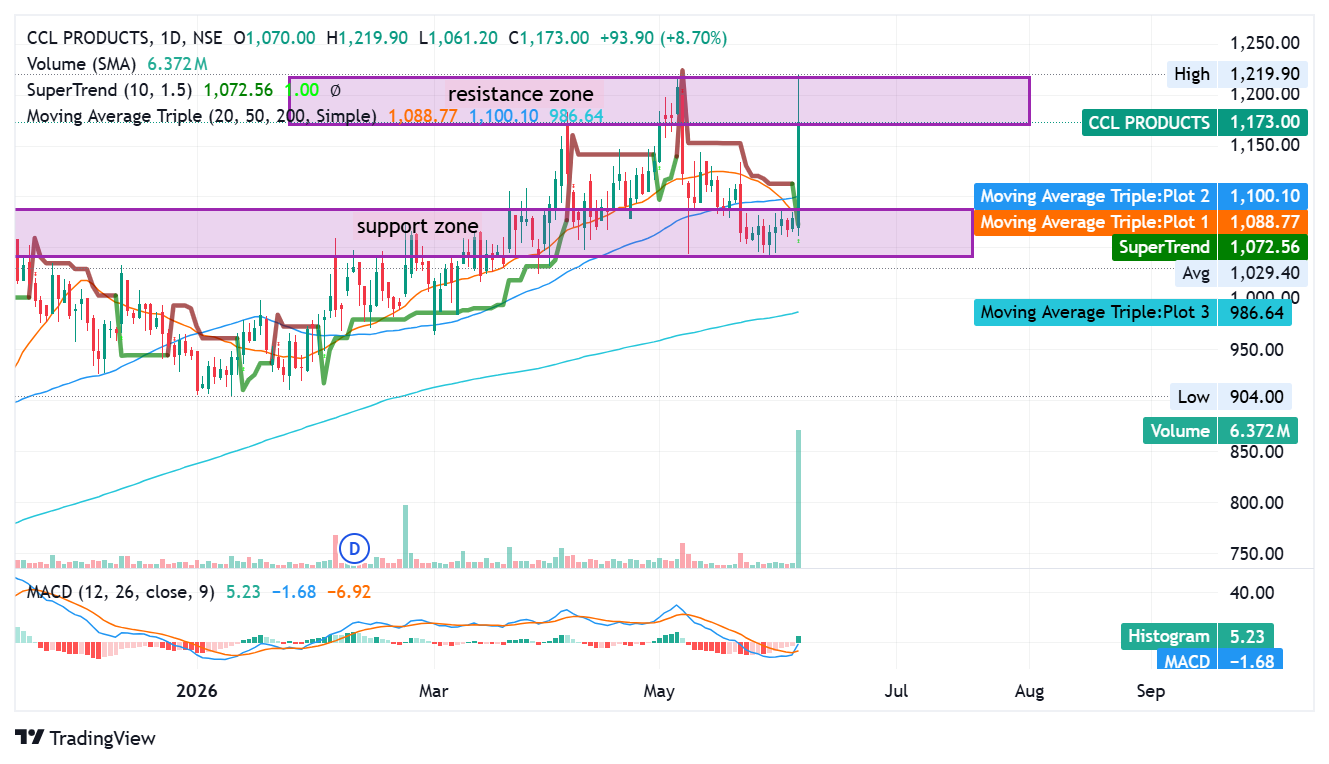
The chart pattern reflected a strong upward structure over the past several months. The stock remained above all major moving averages.
The 20-day moving average stood near Rs. 1,088.77. The 50-day moving average remained close to Rs. 1,100.10. The 200-day moving average stayed near Rs. 986.64.
When a stock trades above short, medium, and long-term averages at the same time, market participants often interpret the structure as a positive long-term trend. The gap between the current market price and the 200-day average also showed the strength of the broader trend.
The SuperTrend indicator remained positive near Rs. 1,072.56. This level also matched closely with the recent support area on the chart. In many situations, traders view such zones as areas where demand may return after temporary price weakness.
The chart also showed a broad support region between Rs. 1,050 and Rs. 1,100. The stock spent several sessions near this area before the latest breakout move. Such price behaviour sometimes reflects accumulation by market participants before a sharp directional move.
Resistance Zone Remains Important
The chart highlighted a resistance zone near Rs. 1,170 to Rs. 1,220. The stock touched this region earlier and later saw temporary weakness. During the latest session, price again entered this area and touched Rs. 1,219.90.
This level may remain important in the near term because historical supply appeared near this region earlier. In many cases, stocks require repeated attempts before a clear breakout above a major resistance area.
If the stock manages to remain above the Rs. 1,150 region for a sustained period, market confidence may remain stable. On the other hand, sharp weakness below support zones may bring caution among short-term participants.
The upper circuit band for the stock currently stood at Rs. 1,407.60, while the lower band remained at Rs. 938.40. The wide price band reflected the stock’s active nature and relatively high volatility profile.
MACD Suggests Recovery In Momentum
The MACD indicator showed signs of improvement after a weak phase during recent weeks. The histogram moved into positive territory at 5.23. The MACD line also attempted recovery after a previous correction phase.
Such movement often suggests that short-term momentum may improve after a consolidation period. However, momentum indicators alone do not guarantee future direction. Market conditions, earnings expectations, sector trends, and liquidity also play major roles in stock price behaviour.
The stock also saw elevated volume during the breakout session. In many situations, high volume near resistance levels attracts market attention because it may indicate stronger conviction among buyers.
Still, one trading session alone may not confirm a long-term breakout. Future price stability near higher levels often becomes important after sharp upward movement.
ALSO READ: Himadri Near Highs as Momentum Faces Resistance
Long-Term Returns Stay Strong
The long-term return profile of the stock remained strong across multiple periods.
The stock delivered 35 percent return during the last one-year period. The three-year return stood at 86.61 percent, while the five-year return reached 238.10 percent.
These numbers reflected strong wealth creation over long periods. Such performance usually attracts institutional and retail interest, especially when business growth supports price movement.
The year-to-date return stood at 29.84 percent before the latest correction figure shown in the data. Even after periods of volatility, the broader long-term trend remained positive.
However, shorter time frames showed some fluctuations. The one-week period reflected 11.01 percent movement along with a negative comparative figure of 1.18 percent. The one-month section showed 5.24 percent along with a negative comparative value of 4.07 percent.
These fluctuations suggested that the stock also experienced periods of short-term pressure despite the broader upward structure.
Valuation Reflects High Growth Expectations
The symbol PE ratio stood at 37.13. Such valuation levels generally suggest that the market expects continued business growth and earnings expansion in future periods.
High PE stocks often require strong quarterly execution to maintain investor confidence. If earnings growth remains healthy, the market may continue to assign premium valuation multiples. However, slower growth or pressure on margins may influence sentiment negatively.
The company belongs to the Tea and Coffee industry and remains part of the NIFTY 500 index. Index inclusion often improves visibility among institutional investors and mutual funds.
The company also has a long listed history. The date of listing stood at 07 June 2004. Businesses with long operating history sometimes receive higher market confidence because investors can study performance across different business cycles.
Volatility Remains Elevated
The annualised volatility figure stood at 43.75, while daily volatility remained at 2.29. These numbers suggested that the stock may witness sharp movement during short periods.
Higher volatility often appears in mid-cap growth businesses where investor expectations remain elevated. Such stocks can deliver strong upside during positive phases but may also witness quick corrections during uncertain periods.
The deliverable quantity ratio stood at 7.12 percent. This figure may indicate that a large part of the traded quantity came from short-term activity during the session. In active momentum phases, both investors and traders often participate at the same time.
Overall View
The available financial and technical data together suggest that CCL Products currently remains in a strong long-term trend supported by healthy business growth and positive market sentiment.
Revenue growth, EBITDA expansion, stable profitability, and strong historical returns supported investor confidence. The stock also traded above major moving averages and touched a fresh 52-week high during the latest session.
At the same time, valuation levels remained elevated. The PE ratio above 37 suggested that the market already priced in a significant part of future growth expectations.
The present structure may continue to attract attention if earnings growth remains stable and the stock sustains above important support zones. However, sharp upward movement near resistance areas and elevated volatility may also lead to periods of correction or consolidation.
Future quarterly performance, margin stability, export demand conditions, and broader market sentiment may remain important factors for the stock during the coming quarters.
This article is for educational and informational purposes only. It does not represent investment advice, stock recommendation, or financial guidance. Market investments carry risk. Investors should conduct independent research or consult a qualified financial advisor before any investment decision.
FAQs
1. Why did CCL Products stock rise sharply?
The stock saw strong market interest after healthy business growth, rising quarterly sales, positive earnings trend, and strong trading volume near important resistance levels.
2. What is the current 52-week high of CCL Products?
The stock touched a fresh 52-week high of Rs. 1,219.90 during the latest trading session.
3. Is CCL Products fundamentally strong?
The available financial data showed strong sales growth, stable EBITDA expansion, positive profit trend, and healthy return ratios. However, valuation levels also remained high.
4. What does the PE ratio of 37.13 indicate?
A PE ratio above 37 generally suggests that the market expects future earnings growth from the company. Higher valuation may also increase sensitivity to future quarterly results.
5. What are the important technical levels for the stock?
The support zone remained near Rs. 1,050 to Rs. 1,100, while the resistance area appeared near Rs. 1,170 to Rs. 1,220 based on the chart structure.
ALSO READ: Why Titagarh Rail Systems Share Price Shows Strong Growth
DARA SOURCE: NSE INDIA