
Apollo Tyres remains one of the most closely watched companies in India’s tyre sector. The company has a strong brand presence, a long operating history, and a major role in both domestic and international tyre markets. Recent financial data shows several positive developments, but market performance tells a more complex story. Even after strong quarterly numbers, the stock still trades far below its previous highs. This creates an important question for investors. Is Apollo Tyres a strong opportunity, or does the market see risks that financial numbers do not fully show?
A close study of the latest available data helps answer this question.
Current Stock Price Shows Recovery but Trend Still Looks Weak
Apollo Tyres closed at ₹396.30. The stock opened at ₹388 and touched a day high of ₹397.35 before ending the session with a gain of 4.2 percent. This strong daily move brought attention back to the stock after months of weakness.
The bigger picture, however, tells a different story. The stock reached a 52-week high of ₹540.50 on 14 November 2025. It later dropped sharply and touched a 52-week low of ₹365.30 on 20 May 2026. Even after the recent rise, the share price still remains nearly 27 percent below its highest point.
Longer period returns also show weakness. Year to date return stands at minus 19.71 percent. One-year return stands at minus 12.20 percent. This means investors have stayed cautious for a long time.
The recent price recovery looks positive, but the stock has not fully escaped its broader weak trend.
Delivery Data Shows Buyers Took Real Positions
One important signal comes from delivery percentage. This number helps investors understand whether market participants bought shares for actual holding or only for quick trading.
Apollo Tyres recorded deliverable quantity at 47.39 percent on the latest trading day. In earlier sessions, delivery percentage remained near similar levels, with several days above 40 percent and some sessions near 49 percent.
High delivery percentage usually suggests that buyers took shares into their demat accounts instead of closing positions during the day.
The total traded volume stood at 11.47 lakh shares while traded value reached ₹44.92 crore.
This data shows genuine buying interest instead of pure short-term speculation. It does not automatically confirm aggressive institutional buying, but it clearly suggests the market saw meaningful demand.
Quarterly Revenue Growth Looks Healthy
Recent quarterly numbers present one of the strongest parts of Apollo Tyres’ financial performance.
Quarterly sales rose from ₹45,805.11 million to ₹52,369.69 million. This shows revenue growth of 14.33 percent compared with the same period last year.
Revenue growth often acts as one of the most reliable indicators because companies cannot easily manipulate sales growth over long periods.
This increase suggests the company maintained healthy demand across its operations. It also shows stable customer demand despite broader concerns around auto sector cycles and raw material cost fluctuations.
For any manufacturing business, double-digit revenue expansion usually creates confidence that the core business remains stable.
Apollo Tyres clearly performed well in this area.
Profit Numbers Show Huge Growth but Need Careful Reading
At first look, profit growth appears extremely impressive.
Quarterly net profit growth stands at 241.77 percent year on year. Profit after tax moved from ₹1491.63 million to ₹9033.73 million.
Such a large jump normally creates excitement among investors. However, deeper examination shows this number needs caution.
The financial report shows negative tax adjustments, especially deferred tax changes. Deferred tax adjustments can sharply increase reported profit without reflecting actual improvement in day-to-day business performance.
This means the large profit jump does not come entirely from regular operations.
Investors should avoid assuming profit will continue to rise at this unusually high pace in future quarters.
The business certainly improved, but the headline profit figure looks stronger than the real operating improvement.
Operating Performance Improved Significantly
Apart from profit numbers, Apollo Tyres reported strong operational improvement.
EBITDA growth came at 27.64 percent. PBDT growth reached 55.09 percent.
EBITDA reflects earnings before interest, tax, depreciation and amortisation. This metric helps investors judge how well the core business performs.
Strong EBITDA growth usually means better operating efficiency. It often indicates stronger pricing power, better cost management, or lower pressure from raw material expenses during the quarter.
Apollo Tyres performed very well here.
This part of the earnings report shows that the business itself remained healthy, even after removing the unusually high tax benefit.
Operational strength remains one of the biggest positives in the company’s recent performance.
ALSO READ: Vedanta Iron and Steel Limited IPO Full Business Analysis
Valuation Looks Reasonable Compared With Industry
Apollo Tyres currently trades at a price-to-earnings ratio of 18.33.
Industry average PE stands at 21.98.
Normally, lower PE compared with sector average suggests the stock trades at cheaper valuation relative to competitors.
The company also has a PEG ratio of 0.55. PEG ratio helps investors compare valuation against growth rate. Values below one often indicate attractive valuation.
Price to book value stands at 1.51, which remains relatively low for an established listed company.
At first glance, these numbers suggest Apollo Tyres looks undervalued.
However, investors must remember one important factor.
If current earnings received temporary support from tax adjustments, then actual valuation may not look as cheap as these numbers suggest.
Because of this, Apollo Tyres appears fairly valued or slightly undervalued, but not deeply undervalued.
Return Ratios Show Business Efficiency Still Needs Improvement
Return ratios help investors judge how efficiently management uses capital.
Apollo Tyres reported return on equity at 7.82 percent. Return on capital employed stands at 11.21 percent. Return on assets remains at 4.15 percent.
These numbers create concern.
High-quality long-term businesses usually maintain return on equity above 15 percent and return on capital employed above 18 percent.
Apollo Tyres remains far below these ideal levels.
This does not mean the business performs poorly. It simply means the company does not convert capital into profit as efficiently as stronger businesses.
This becomes important for long-term investors because capital efficiency often separates average companies from exceptional companies.
Apollo Tyres remains profitable, but efficiency still leaves room for improvement.
Apollo Tyres Technical Analysis: Price Recovery Faces Key Test
Apollo Tyres has shown fresh strength after a long period of price weakness. The latest daily chart presents early signs of recovery, but several important resistance zones still stand above the current market price. Recent candle structure, momentum indicators, volume behaviour, and Fibonacci levels together show that the stock has entered an important phase where traders and investors may closely watch the next few sessions.
The present chart does not confirm a strong breakout yet. However, short-term price behaviour suggests that market sentiment has improved compared with the sharp decline seen during the last few months.
A detailed study of the chart helps explain what the stock currently shows.
Price Structure Shows Recovery After Sharp Correction
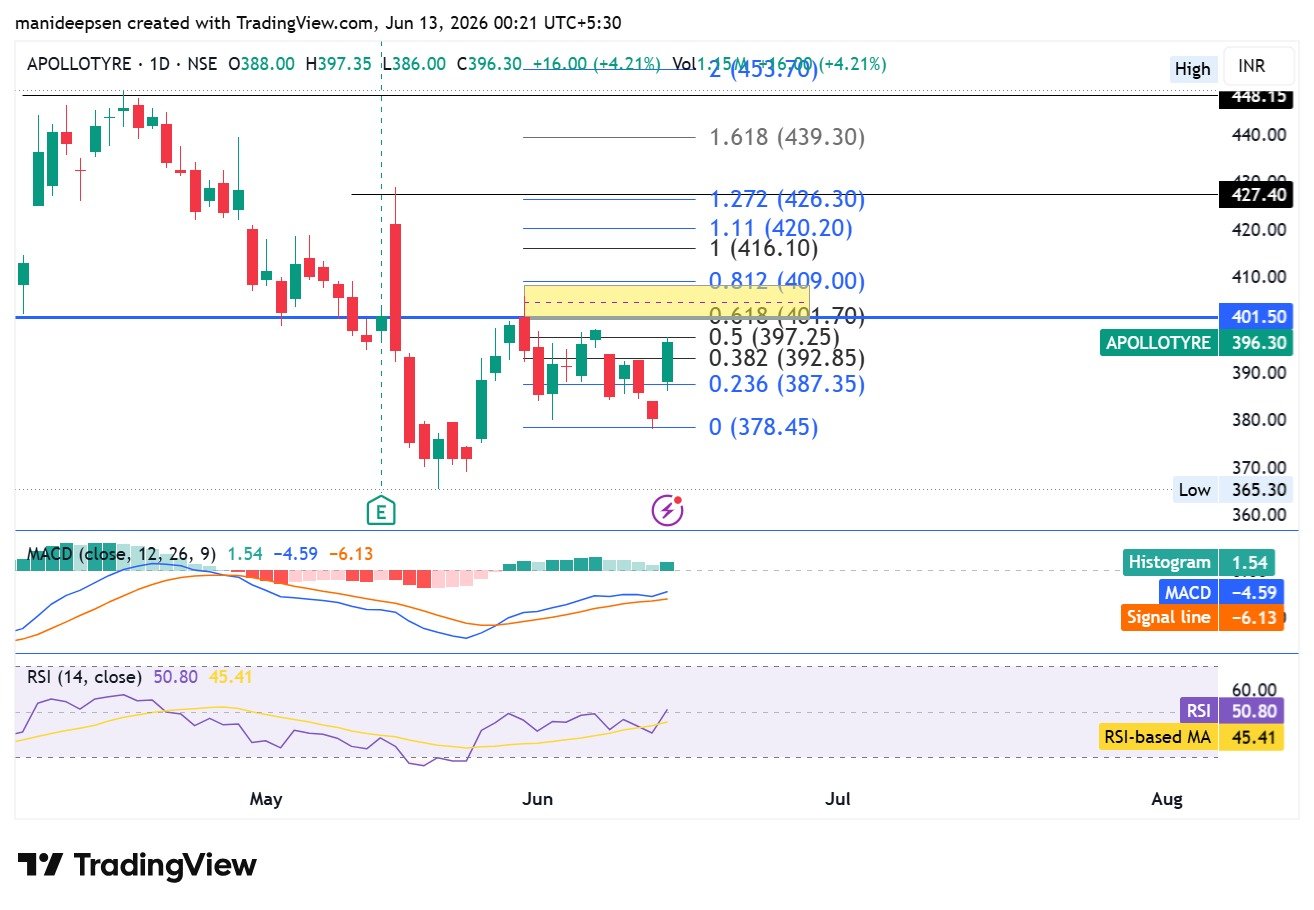
Apollo Tyres closed at ₹396.30 on the NSE. The stock gained ₹16 during the session, which equals a rise of 4.21 percent. The day opened at ₹388.00 and touched a high of ₹397.35. The lowest traded level during the session came at ₹386.00.
This daily move appears important because the stock had already gone through a large correction phase before this recovery started.
The chart shows a previous high near ₹448.15, while the recent low stands near ₹365.30. This means Apollo Tyres lost a large part of its value during the previous downtrend.
After touching ₹365.30, buyers returned near lower price zones and helped price move upward again.
This recent recovery suggests selling pressure has reduced, at least in the short term.
Fibonacci Levels Show Immediate Resistance Ahead
The chart includes Fibonacci retracement levels measured from the previous high to the recent low. These levels often help traders identify possible resistance zones where price may face difficulty.
The nearest Fibonacci level stands at 0.5 retracement near ₹397.25.
Apollo Tyres closed almost exactly near this zone at ₹396.30.
This area now becomes an immediate test.
Above this level, the next Fibonacci resistance appears at 0.618 near ₹401.70.
This zone carries additional importance because a horizontal price resistance line also exists near ₹401.50.
If price moves above this area and holds strength, market participants may watch the next resistance zones.
The next levels appear near ₹409.00, followed by ₹416.10.
Further upward zones stand near ₹420.20 and ₹426.30.
The upper Fibonacci extension reaches ₹439.30.
These levels do not guarantee future price direction, but they help identify areas where supply may increase.
At the present moment, Apollo Tyres trades directly below a major technical barrier.
Support Zones Remain Clearly Defined
Support levels become important whenever a stock faces selling pressure.
The first visible support zone stands near ₹392.85, which matches the 0.382 Fibonacci level.
Below that, another important support appears near ₹387.35.
A deeper support area exists near ₹378.45.
The strongest recent support remains near ₹365.30, which marks the recent swing low.
As long as price stays above the higher support zones, market confidence may remain relatively stable.
A move below these lower levels may create fresh weakness.
The chart currently shows price holding above important support areas, which helps maintain positive short-term structure.
Volume Activity Shows Return of Market Interest
Volume often helps confirm whether price movement reflects genuine demand.
The chart shows volume near 1.25 million shares during the session.
This volume came alongside a strong green candle and a 4.21 percent daily rise.
When price rises together with healthy market participation, it usually suggests buyers entered the stock with conviction.
Large price movement without volume often creates doubt.
In this case, the volume structure supports the recent positive move.
This does not confirm long-term strength, but it suggests better demand compared with earlier sessions.
The market clearly paid attention to this recent move.
MACD Indicator Shows Momentum Improvement
The MACD indicator helps measure momentum changes.
Current MACD value stands at negative 4.59.
Signal line stands at negative 6.13.
Histogram value shows positive 1.54.
Although both MACD and signal line remain below zero, an important detail deserves attention.
The MACD line now sits above the signal line.
This often suggests momentum has improved after a weak phase.
The histogram bars have turned green after a long period of red bars.
This change often reflects reduced selling pressure.
However, both lines remain below the zero mark.
Because of this, the broader trend still needs confirmation.
The indicator shows improvement, but it does not fully confirm trend reversal yet.
RSI Shows Neutral Strength With Positive Shift
Relative Strength Index, or RSI, helps measure whether a stock looks overbought or oversold.
Current RSI value stands at 50.80.
RSI-based moving average stands at 45.41.
An RSI near 50 usually suggests balance between buyers and sellers.
Values above 70 often suggest overbought conditions.
Values below 30 often suggest oversold conditions.
Apollo Tyres currently sits in neutral territory.
One important observation stands out.
The RSI line has moved above its moving average line.
This often reflects stronger short-term sentiment.
The stock no longer appears deeply weak based on momentum measurement.
At the same time, RSI remains far below overheated territory.
This suggests room for further movement if demand continues.
Candle Structure Reflects Buyer Support Near Lower Range
Recent candle behaviour gives useful insight into market psychology.
The chart shows several sessions where price stayed within a narrow range after the sharp decline.
This type of movement often reflects consolidation.
Consolidation usually means the market tries to find fair value after a strong move.
After this phase, a large green candle appeared.
This suggests buyers entered near lower price levels and absorbed available supply.
The latest candles continue to hold near recent highs.
Price has not returned sharply lower after the recovery candle.
This usually shows that sellers have not fully regained control.
The stock now enters a zone where the next few candles may define future direction.
Overall Chart Structure Suggests Early Recovery Phase
The complete technical picture presents a mixed but improving structure.
The stock has recovered from the recent low of ₹365.30 and now trades near ₹396.30.
Momentum indicators have improved.
Volume supports recent strength.
RSI has returned above neutral levels.
MACD shows positive crossover.
At the same time, important resistance remains directly above current price.
The ₹401 to ₹402 zone stands as the first major technical barrier.
Higher resistance levels continue near ₹409, ₹416, and ₹420.
The broader trend has not fully shifted because price still remains well below the earlier high near ₹448.
From a purely chart-based perspective, Apollo Tyres currently shows early signs of technical recovery after a period of weakness.
This structure may suggest improving sentiment, but the chart still requires confirmation above major resistance zones before stronger conclusions become reasonable.
The present data reflects improving technical conditions, though caution remains necessary because broader trend recovery has not fully completed.
Disclaimer
This analysis is only for educational and informational purposes. The article is based on publicly available market data, price charts, and financial information available at the time of writing. Stock market conditions can change at any time and future price movement may differ from past trends. Readers should do their own research and consult a qualified financial advisor before making any investment decision.
Frequently Asked Questions
Is Apollo Tyres stock showing signs of recovery?
The chart shows early recovery signs after a sharp fall. Price has moved up from the recent low of ₹365.30 and momentum indicators now look stronger than before.
Why is the ₹401 level important for Apollo Tyres?
The ₹401 zone acts as a major resistance area because price stands near an important Fibonacci retracement level. A move above this area may improve market sentiment.
What does the MACD indicator show right now?
The MACD line has moved above the signal line and the histogram has turned positive. This usually shows that short-term momentum has improved after recent weakness.
Is Apollo Tyres still in a long-term downtrend?
The stock has recovered in recent sessions, but price still remains well below the earlier high near ₹448.15. This means the broader trend has not fully changed yet.
What is the biggest risk visible on the chart?
The biggest risk comes from strong resistance zones between ₹401 and ₹420. If price fails near these levels, the stock may face fresh selling pressure again.
ALSO READ: Banks & Metals Signal Strong Market Opening