
Thangamayil Jewellery Limited has officially announced the closure of its trading window before the release of its financial results for the first quarter of the financial year 2026-27, also known as Q1 FY27. This announcement has caught the attention of investors and stock market watchers, especially those who closely follow the jewellery sector in India.
The company made this move as part of the normal rules and regulations that listed companies must follow before they publish important financial information. Although such announcements often create interest in the market, this particular update does not directly show whether the company has good or bad results ahead. It is mainly a compliance step that companies take before major financial disclosures.
The trading window closure usually happens when company officials may have access to sensitive financial details that are not yet available to the public. During this period, certain people inside the company cannot buy or sell company shares.
This process helps maintain fairness in the stock market and ensures that no person gets an unfair advantage by using private information.
What Does Trading Window Closure Mean?
To understand this news properly, it is important to know what a trading window closure actually means. Publicly listed companies in India follow strict rules set by the Securities and Exchange Board of India, commonly known as SEBI. These rules exist to prevent insider trading.
Insider trading happens when a person with confidential company information buys or sells shares before that information becomes public. This can create an unfair situation because ordinary investors do not have access to the same knowledge.
To stop this from happening, companies temporarily stop certain people from trading company shares before major announcements. This restricted period is known as the trading window closure.
At Thangamayil Jewellery, this restriction applies to company promoters, senior executives, employees in key positions, and anyone who has access to financial information before public release.
Once the company publishes its quarterly financial report, the trading restriction normally remains in place for another 48 hours. After that period ends, regular trading becomes allowed again for insiders.
Q1 FY27 Financial Results Are Expected Soon
The trading window closure clearly shows that Thangamayil Jewellery is preparing to release its first quarter financial results for FY27 very soon. Based on the company’s previous reporting schedule, market experts expect the earnings announcement to happen sometime in July 2026.
Quarterly financial reports play a very important role because they show how a company performed during the last three months. Investors study these reports carefully before making decisions about buying or selling shares.
These reports usually reveal total revenue, net profit, expenses, business growth, and future management plans. For a company like Thangamayil Jewellery, investors also closely examine customer demand, store performance, and how gold prices affect business.
Since jewellery companies depend heavily on gold prices and consumer spending, even small changes in market conditions can affect profits.
As the result date comes closer, investor interest in the company usually rises. Many traders wait for these numbers before making fresh investment decisions.
This Is a Normal Corporate Procedure
It is important for investors to understand that this trading window closure should not be treated as a positive or negative business signal.
Sometimes people misunderstand such announcements and assume that a company may have exceptionally strong or weak results. In reality, this process is simply part of normal corporate governance.
Almost every listed company follows the same practice before releasing quarterly earnings, annual reports, merger announcements, or any major financial update.
The main purpose is to protect the integrity of the stock market and make sure every investor receives information at the same time.
For Thangamayil Jewellery, this announcement only confirms that internal financial data is now under restricted access until official publication.
It does not reveal anything about whether profits have increased or whether the company faced business challenges during the quarter.
Because of this, market experts usually describe trading window closure announcements as neutral events.
Investors Will Closely Watch Upcoming Earnings
Even though the trading window closure itself carries no major signal, investors are now focusing on the upcoming Q1 FY27 earnings report.
Thangamayil Jewellery operates in India’s highly competitive jewellery market, where customer demand often changes based on wedding seasons, festivals, gold prices, and general economic conditions.
One of the biggest areas investors will study is sales growth. If customer demand remained strong during the quarter, the company may report healthy revenue numbers.
Another important factor is profit margin. Jewellery companies often face pressure when gold prices rise sharply. If the company manages pricing effectively, profit margins may remain stable.
Inventory management will also receive close attention. Since gold remains the core raw material, efficient stock management plays a major role in business performance.
Store expansion is another key area. Investors want to know whether new showroom openings continue to support growth and help the company increase market share.
Management commentary after results will also become important because investors often look for future guidance about upcoming quarters.
ALSO READ: Best Dividend Paying Stocks on June 25 Corporate Action List
Strong Performance In FY26 Created High Expectations
One reason why investors now pay close attention to Thangamayil Jewellery is the company’s extremely strong performance during the previous financial year.
The company reported impressive numbers in FY26, which significantly raised market expectations for future growth.
Its annual revenue showed a remarkable increase of 73 percent compared to the previous year. This strong growth reflected healthy customer demand and successful business expansion.
Even more impressive was the company’s net profit growth. Thangamayil Jewellery recorded a massive 196 percent increase in annual profit compared to the earlier year.
The final quarter of FY26 showed even stronger momentum. During Q4 FY26, the company reported a huge 354 percent jump in profit compared with the same quarter of the previous year.
These numbers surprised many market observers because such rapid profit growth is rarely seen in traditional retail sectors.
Because FY26 performance was so strong, investors now expect the company to maintain similar momentum during FY27.
This creates additional pressure on management because the upcoming Q1 FY27 results must meet these higher expectations.
Technical Charts Show Strong Price Momentum Ahead of Results
Apart from the company’s business performance, stock market charts now show that Thangamayil Jewellery remains in a very strong upward trend. Recent price movement suggests investors have shown strong confidence in the company over the last several months. The stock has delivered a massive rally and now trades close to record high levels.
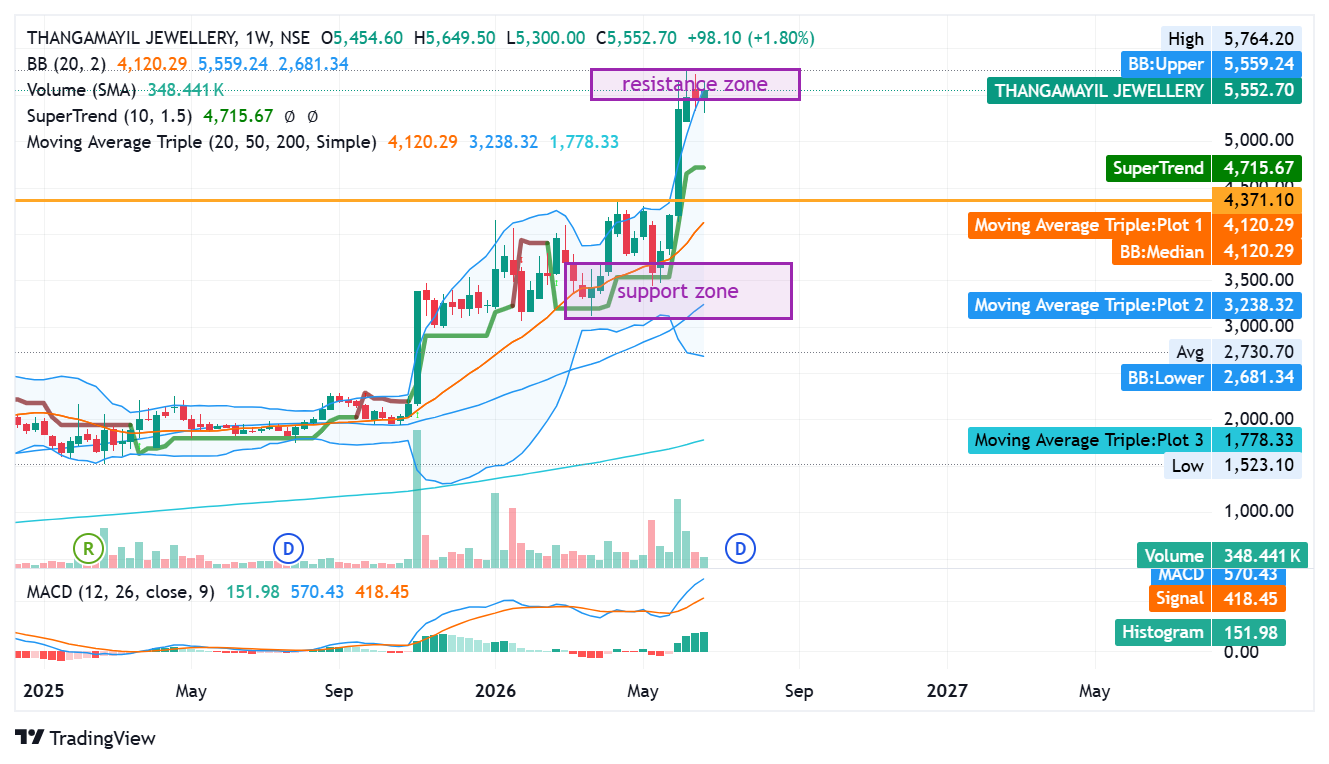
On the weekly chart, the stock closed near ₹5,552.70. During the latest trading session, the share touched a high of ₹5,649.50 while the low stood at ₹5,300.00. The stock gained ₹98.10, which means a rise of 1.80 percent in the latest session. This steady rise shows buyers still hold control over price movement.
The bigger picture looks even stronger when recent performance gets compared with earlier price levels. In the past year, the stock moved from nearly ₹1,500 levels to above ₹5,500. Such a sharp rise shows strong investor interest and clear market confidence toward the company’s future growth.
Stock Faces Important Resistance Zone Near High Levels
The technical chart shows the stock has now entered an important resistance zone. This area sits between ₹5,400 and ₹5,600. In simple terms, resistance means a price area where stocks often face selling pressure because many traders choose to book profit after a sharp rise.
The stock recently moved above this important zone and even touched a fresh high near ₹5,764.20. This breakout is important because it shows buyers pushed the stock above earlier barriers. Usually, when price crosses resistance levels with strong force, it creates confidence for another possible upward move.
At the same time, whenever a stock rises too fast in a short period, temporary weakness often appears. The market may pause for some time before the next move begins. This does not mean trend weakness. It simply means price may need rest after such a sharp jump.
Support Levels Remain Strong Below Current Price
Even if the stock sees some short term weakness, several support zones remain below the current market price. Support means an area where buyers usually return and prevent deeper correction.
The first strong support zone appears between ₹4,300 and ₹4,400. This level matters because several technical indicators sit close to this range.
Another important support area stands between ₹3,400 and ₹3,700. This zone acted as a base before the latest breakout happened. In many cases, old resistance later becomes new support. If the stock moves lower, this area may attract fresh buyers once again.
As long as price remains above these important support zones, the overall trend remains healthy.
Moving Averages Confirm Long Term Strength
Moving averages help investors understand whether a stock remains strong over a longer time frame. In the case of Thangamayil Jewellery, all major moving averages show strong bullish structure.
The 20 week moving average stands at ₹4,120.29. The 50 week moving average stands at ₹3,238.32. The 200 week moving average stands at ₹1,778.33.
The stock currently trades far above all these levels. This usually shows strong long term confidence among investors. When price stays above important moving averages for a long period, it often means buyers continue to trust the business outlook.
At present, the gap between current price and the 20 week average looks very large. This tells investors that price has moved sharply in a short period. In many cases, such a move brings temporary correction before another rally begins.
ALSO READ: EMA Partners Buys Taggd in ₹95 Crore Talent Expansion Deal
SuperTrend Indicator Supports Bullish Structure
Another technical indicator called SuperTrend also confirms positive momentum in the stock.
The current SuperTrend level stands at ₹4,715.67. Since the stock price remains well above this level at ₹5,552.70, the trend remains strongly positive.
This indicator usually helps traders identify trend reversal points. As long as the stock remains above the SuperTrend level, buyers stay in control.
If price later falls below this level, some weakness may appear. For now, there is no sign of major technical weakness on the chart.
Bollinger Bands Show Stock Looks Expensive Short Term
The Bollinger Band indicator helps traders understand whether price has moved too far too fast.
The Upper Bollinger Band stands at ₹5,559.24. The Middle Band stands at ₹4,120.29. The Lower Band stands at ₹2,681.34.
At present, the stock trades almost exactly near the upper band. This usually means the stock has become expensive in the short term after a very fast rally.
Stocks rarely continue upward movement at the same speed for long periods. After such sharp rallies, some cooling period often comes.
This does not suggest trend reversal. It only means the stock may stay flat or move slightly lower before the next major upward move begins.
MACD Indicator Shows Momentum Still Positive
The MACD indicator helps investors study market momentum.
Current MACD numbers remain very positive.
The MACD line stands at 570.43. The Signal line stands at 418.45. The Histogram stands at 151.98.
Since the MACD line remains above the Signal line, positive momentum continues in the stock. The gap between both lines also shows buyers remain active.
Usually, when MACD moves strongly above the signal line, it confirms bullish sentiment in the market.
At this stage, no technical sign points toward immediate trend reversal.
Higher Volume Supports Recent Price Breakout
Volume remains one of the most important signals in technical analysis because it shows how strong buyer interest really is.
Current market volume stands near 348.441 thousand shares.
Recent breakout candles came with higher than normal volume. This makes the breakout more reliable.
When stocks move higher with strong volume, it usually means buyers support the move with conviction. If volume stays weak during breakouts, price often falls back quickly.
In this case, strong volume suggests the recent rally carries genuine market support.
What Investors Should Watch Next
Investors now wait for two major developments.
The first event is the upcoming Q1 FY27 earnings report. Since the company delivered very strong FY26 numbers, expectations remain high. Revenue growth of 73 percent, net profit growth of 196 percent, and 354 percent jump in Q4 FY26 profit already created strong optimism in the market.
The second factor is short term stock movement near the current resistance zone.
If the stock remains above ₹5,500, the next upside move may push price toward ₹5,900 to ₹6,200 levels.
If profit booking starts, the stock may move lower toward ₹4,700 or ₹4,400 support levels.
Any sharp fall below ₹4,100 may become the first warning sign for investors.
Strong Business and Strong Charts Keep Outlook Positive
Thangamayil Jewellery currently stands in a strong position both from business performance and stock market structure.
The company enters Q1 FY27 results season after a very successful FY26 performance. At the same time, technical charts show strong bullish momentum with healthy volume support and major breakout above earlier resistance levels.
Short term traders may watch for temporary correction because price has moved sharply in recent weeks.
Long term investors, however, continue to see positive signals as long as the stock remains above important support levels.
For now, market sentiment remains favorable, and all attention now shifts toward the upcoming Q1 FY27 earnings announcement.
Disclaimer
This article is only for information and educational purposes. It is based on publicly available company updates, financial data, and technical chart analysis. It should not be treated as financial advice, investment advice, or stock market recommendation. Stock market investments carry risk, and prices can change quickly based on market conditions. Investors should do their own research or speak with a qualified financial advisor before making any investment decision.
Frequently Asked Questions
1. Why did Thangamayil Jewellery close its trading window?
Thangamayil Jewellery closed its trading window as part of normal SEBI regulations before the release of its Q1 FY27 financial results. This prevents insiders from buying or selling shares before important company information becomes public.
2. Does trading window closure mean bad news for the company?
No, trading window closure does not mean bad news. It is a routine process that listed companies follow before announcing quarterly financial results.
3. When will Thangamayil Jewellery announce Q1 FY27 results?
Based on previous reporting patterns, the company is expected to release Q1 FY27 earnings around July 2026, although the exact date may vary.
4. How did Thangamayil Jewellery perform in FY26?
The company reported very strong FY26 numbers. Revenue grew by 73 percent, net profit rose by 196 percent, and Q4 FY26 profit jumped by 354 percent compared to the previous year.
5. Why are investors watching the Q1 FY27 results closely?
Investors are watching closely because the company delivered excellent FY26 performance. The upcoming quarter will show whether the business can maintain similar growth momentum.
6. What is the current stock price of Thangamayil Jewellery?
According to the weekly chart analysis, the stock recently closed near ₹5,552.70 after gaining 1.80 percent in the latest trading session.
7. What is the major resistance level for the stock right now?
The stock currently faces an important resistance zone between ₹5,400 and ₹5,600. It recently crossed this range and touched a fresh high near ₹5,764.20.
8. Which support levels are important for investors?
The first strong support zone stands near ₹4,300 to ₹4,400. Another major support area sits between ₹3,400 and ₹3,700 if deeper correction happens.
9. What do technical indicators say about the stock?
Technical indicators remain positive. The stock trades above major moving averages, SuperTrend remains bullish at ₹4,715.67, MACD shows strong momentum, and volume supports the recent breakout.
10. Is Thangamayil Jewellery stock still bullish?
The long term trend remains bullish because the stock trades above key support levels and recently broke above historical resistance. However, short term correction may happen because price has risen very sharply in recent weeks.
ALSO READ: Magson Retail Plans New Fund Raise Through CCDs Issue


