
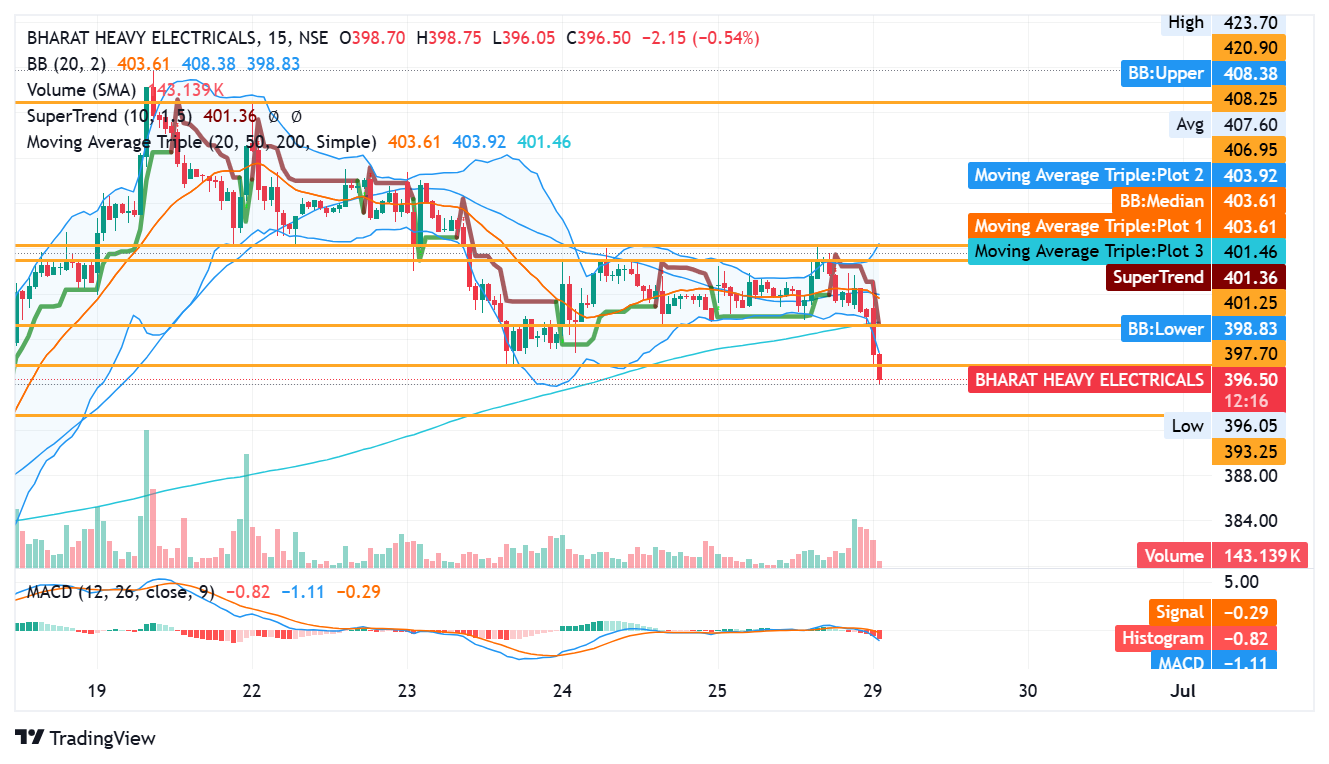
BHEL, also known as Bharat Heavy Electricals Limited, saw clear weakness during the trading session on 29 June 2026. The stock opened at ₹402.70, exactly at the previous close of ₹402.70, which showed a neutral start. During early trade, price moved upward and touched an intraday high of ₹405.15, but buyers failed to maintain control.
Soon after this upward move, the stock reversed direction and heavy selling entered the market. Price then dropped sharply and reached an intraday low of ₹393.85. At the time of observation, the stock traded near ₹396.50, which reflected a meaningful fall from the previous closing level. The market session showed weakness as sellers controlled price action for most of the day.
This type of move usually reflects a sudden shift in short-term sentiment, where buyers step back and supply starts to dominate the market.
Technical Structure Has Turned Weak
The technical structure on the chart now shows a bearish shift. The stock moved below several important technical levels that traders usually watch for trend direction.
The Bollinger Band setup showed an upper band near ₹408.38, a middle band at ₹403.61, and a lower band at ₹398.83. Current price moved below the lower band and traded near ₹396.50.
When price falls below the lower Bollinger Band, it often shows strong selling pressure. It can also signal oversold conditions in the very short term, but it usually confirms weakness until price starts recovery.
At present, technical structure remains negative.
Major Moving Average Breakdown
One important concern comes from the moving average structure. The stock has fallen below all major average levels.
The 20 period moving average stood at ₹403.61. The 50 period moving average stood at ₹403.92. The longer trend average near 200 period stood at ₹401.46.
Current market price at ₹396.50 now sits below all these levels.
This matters because moving averages often act as support zones. When price falls below several major averages at the same time, it often shows that buyers have lost short-term control.
This setup currently supports a bearish view.
SuperTrend Shows Negative Trend Shift
The chart also showed the SuperTrend indicator at ₹401.36.
Current market price remained below this level through the observed session.
SuperTrend usually helps traders understand market direction. Price below SuperTrend often suggests that trend momentum has shifted toward sellers.
As long as price remains under ₹401.36, technical structure remains weak.
Any recovery above this zone may improve sentiment.
MACD Momentum Has Turned Negative
Momentum indicators also support the bearish structure.
The MACD indicator showed the following values.
MACD = -1.11
Signal = -0.29
Histogram = -0.82
This setup means momentum has shifted lower. The MACD line moved below the signal line and the histogram also remained in negative territory.
This often reflects increasing downward pressure.
At present, momentum clearly favors sellers.
Order Book Shows Seller Dominance
The order book gave another important signal.
Buy side demand stood at 5,66,928 shares, which represented 39.49% of visible orders.
Sell side supply stood at 8,68,786 shares, which represented 60.51% of visible orders.
This imbalance showed that more traders wanted to sell than buy.
When sell quantity remains much larger than buy quantity, short-term pressure usually stays negative.
This confirms weakness seen on the chart.
Volume Shows Active Participation
Total traded volume during the session stood at 17.34 lakh shares.
Total traded value reached ₹69.07 crore.
The chart showed large red candles along with higher volume activity during the price decline.
Higher volume during a price fall often suggests active participation from larger market participants.
This pattern usually carries more importance than a simple low-volume decline.
It tells us that the market paid attention to this move.
Important Price Levels to Watch
The nearest support zone now sits around ₹395.
Below this level, the next important support appears near ₹393.25, followed by a psychological level near ₹390.
If weakness continues, another support may appear near ₹385.
On the upside, immediate resistance now stands near ₹398.83, which also aligns with the lower Bollinger Band.
Above that, price may face resistance near ₹401.36, which matches the SuperTrend level.
Further resistance stands at ₹403.61 and ₹408.38.
The stock needs to move above these zones before short-term confidence improves.
Long-Term Performance Still Looks Strong
Even after this sharp decline, long-term performance remains strong.
Over the last one week, the stock returned -3.85%, while the NIFTY Midcap 50 index returned -1.27%.
Over one month, return stood at -5.06%, while the index gained 0.48%.
Year to date return remained strong at 35.75%.
One year return stood at 49.81%.
Three year return reached 365.20%.
Five year return stood at 509.63%.
This shows the long-term trend remains strong, even though short-term weakness has entered the market.
Valuation and Market Position
The company currently has a total market capitalization of ₹1,37,767.84 crore.
Free float market capitalization stands at ₹57,519.82 crore.
The stock trades at a P/E ratio of 91.10.
This valuation remains high for a heavy electrical equipment company.
High valuation can often increase price sensitivity when market sentiment turns cautious.
The stock remains part of the NIFTY MIDCAP 50 index and continues active exchange participation.
Its 52 week high stands at ₹424.90, while 52 week low stands at ₹205.12.
Overall Market Interpretation
The overall picture currently shows short-term weakness.
Price has moved below Bollinger Bands, major moving averages, and SuperTrend support.
MACD momentum has turned negative and order book data shows stronger selling pressure.
Volume activity confirms active market participation during the decline.
At the same time, long-term returns remain very strong and broader market history still shows strong investor interest.
At present, market behavior suggests caution until price starts recovery above major resistance zones.
This observation reflects technical conditions visible on the current session and should not be treated as any form of investment recommendation.
Disclaimer: This analysis is based on publicly visible market data and technical observations from the shared chart. It is for educational and informational discussion only and does not constitute financial advice, investment advice, or a recommendation to buy or sell securities.
Frequently Asked Questions
Is BHEL in a short-term downtrend now?
Based on current chart structure, price action shows short-term weakness after price moved below important support zones.
Why did BHEL fall sharply on 29 June?
The session showed strong selling pressure after early upward movement failed near ₹405, which shifted market sentiment lower.
Is ₹395 an important level now?
Yes. ₹395 has become an immediate support zone after the intraday decline.
Does long-term trend still remain positive?
Yes. Despite current weakness, one year, three year, and five year returns remain strong.
What price level may improve sentiment again?
A move back above ₹401 to ₹403 may improve short-term confidence, though market behavior can change quickly.
ALSO READ: Titagarh Rail Systems Eyes Big Indian Railways Wagon Deal